Fecal Sludge To Energy in a Prototype Supercritical Water Oxidation Reactor
|
|
|
- Derick Newman
- 5 years ago
- Views:
Transcription


1 Fecal Sludge To Energy in a Prototype Supercritical Water Oxidation Reactor Marc A. DESHUSSES Department of Civil and Environmental Engineering Duke University, Durham, North Carolina

2

3 2.4 billion people do not have access to improved sanitation Open defecation = everyday business for about 1,100,000,000 people

4 WSH STRATEGY AND PRIORITIES INSTITUTIONAL OPEN DEFECATION Untreated sludge ends in the environment (Dhaka, Bangladesh) 20% WC to sewer Safely emptied Leakage Illegally dumped Effectively treated Not effectively treated 2% 2% of fecal sludge safely disposed Unsafely emptied 79% On-site facility Left to overflow or abandoned of fecal sludge 98% unsafely disposed 1% Open defecation 1% 69% 9% 9% 1% 9% Source: WSP analysis, using BMGF funded research Residential environment Drainage systems Receiving waters Bill & Melinda Gates Foundation 4


5 Confined Animal Feeding Operations (CAFOs) = as much waste as a small town 8600 m 3 anaerobic digester 8600 hogs 1400 m 3 manure/week 17 tons COD/week 1.6 tons N/week 0.6 tons P/week Issues: organics and nitrogen management, methane and odor emissions, antibiotic resistant bacteria, very low cost margins
 Minerals (5-8%) Bacteria and bacterial debris (10-30%) Where all pathogens and most of the")
 Organic salts (38%) ~440 W h/(p d) Urea (36%) Organic compounds (13%) Ammonium salts (13%) Contains")
6 Content of Fecal Waste Feces: g/(p day) ~ 80% moisture Fats (5-25%) Carbohydrates (10-30 %) Nitrogenous materials (2-3%) Minerals (5-8%) Bacteria and bacterial debris (10-30%) Where all pathogens and most of the energy is ~80 g dry, 107 g COD, ~2 g N, 1.6 MJ / (p day) Urine: L/(p day) Organic salts (38%) ~440 W h/(p d) Urea (36%) Organic compounds (13%) Ammonium salts (13%) Contains most of the nitrogen ~7 gn/(p day) and P ~1gP/(p d)

7 This is a 87 kwh dump!!!
 Supercritical treatment facility, 20 ft.")
8 Our Vision: Omni Processor for Fecal Waste Sanitation for the urban poor using supercritical water oxidation (SCWO) Pit Latrine Collection & Transport Businesses (~ kwh/d) Supercritical treatment facility, 20 ft. container for ~1000 people
 o High conversion to CO 2 + clean water o No SOx, NOx or odor o No need to dry waste o Can co-treat haz.")
9 In supercritical water, organics are rapidly oxidized (in seconds) resulting in heat, and CO 2 Benefits o Very fast reaction (sec.) o High conversion to CO 2 + clean water o No SOx, NOx or odor o No need to dry waste o Can co-treat haz. wastes Technical risks o Corrosion o Salts deposition/plugging


10 Pilot unit at Duke - Heat and energy recovery - Metallurgy and corrosion - Process control - Slurry pumping
11 System Characteristics Basic characteristics kg dry/day 1-2 m 3 /day Assume feed ~7-15% solids Reactor ID: 19 mm Reactor length: 4.0 m Heat exchanger length: 39 m Reynolds #: 30,000 60,000 Residence time in reaction section = 2.5 to 4.5 seconds! Anti corrosion and plugging measures High Re number, slight down slope Minimize transition zones Reactor and part of heat exchanger in Inconel 625 Tandem HEPS Periodic maintenance Other Startup with isopropyl alcohol (IPA) but any other liquid fuel will work Air is used as oxidant

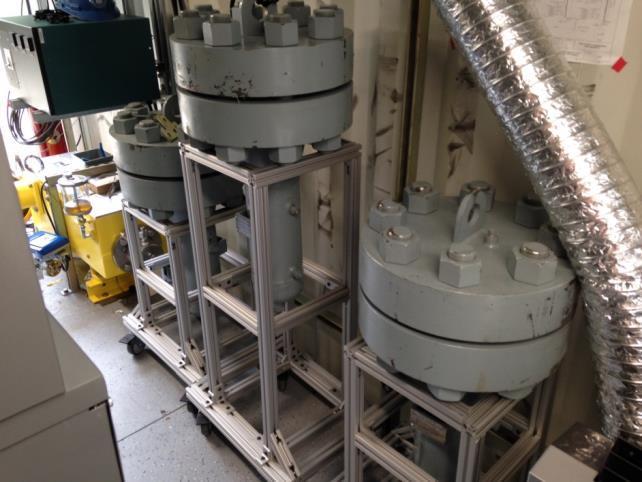
12 Pilot unit construction
 Reactor CO 2, N 2, O 2 Solids")

13 Power (kw) Process Flow Diagram Fecal sludge (+co-fuel) Air Gas-liquidsolid separators (Furnace) Reactor CO 2, N 2, O 2 Solids Water loop Clean water out Air-water preheat Air-water mixture 50 kg wet /h, 10% solids basis Heat to 400 C supercritical Heat of combusion

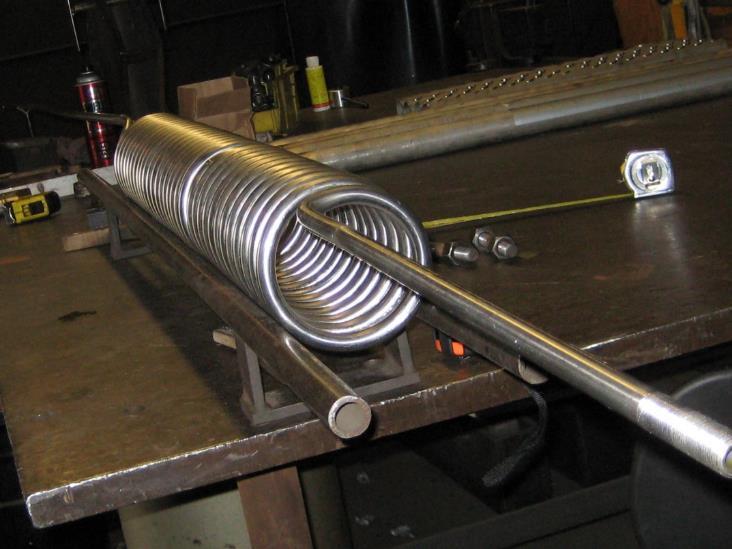
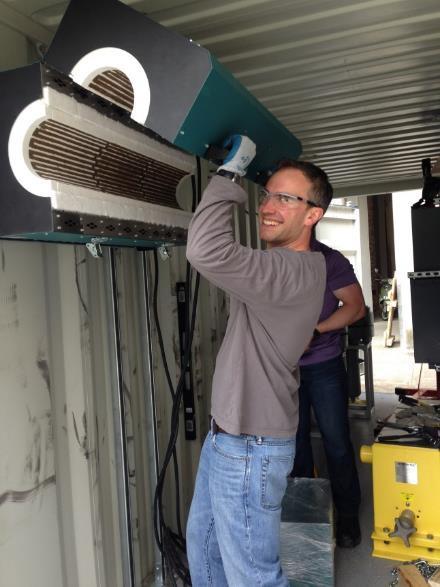
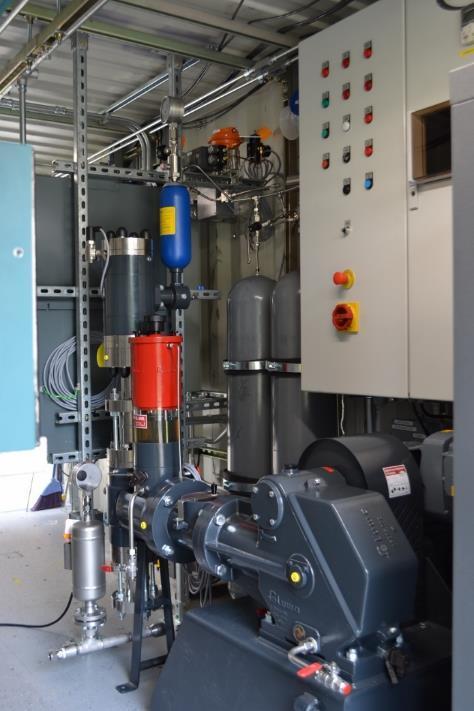
14 Pilot unit construction
 Starter and")
")

")

15 SCWO Feedstocks Processed Isopropanol (IPA) Starter and model fuel High solids-content (16%) secondary sludge Ash content: 24% HHV: 15 MJ/kg dry Dried chicken manure HHV: 12 MJ/kg dry Fecal Simulant (lab only) Dog feces HHV: 15.7 MJ/kg dry Used as surrogates for human fecal waste (8-15% solids)
16 Test run with 1.3% isopropanol Typical IPA run: 99.9% removal
17 Removal (%) System Characterization with IPA Effect of n: Stoichiometric factor of O COD Removal IPA Removal O 2 Stoichiometric factor (-)
18 System Characterization with IPA Calorific content of feed increases

")


19 Biosolids as received (14 MJ/kg dry) Secondary Sludge Treatment Feed Feed Slurry feed: 4.3% biosolids 9% IPA Effluent Effluent After settling

20 Secondary Sludge Treatment T after reaction IPA run MJ/kg Sludge run 2.4 MJ/kg from IPA MJ/kg from sludge T = 586 ± 4.9 C T = 577 ± 12.2 C T = 475 ± 17.5 C T = 462 ± 7.3 C T = 219 ± 0.8 C T = 204 ± 8.0 C
21 Secondary Sludge Treatment Summary IPA Influent Effluent Analysis (9.6% IPA) Steady State COD (mg/l) Removal (%) Sludge +IPA Influent Effluent Analysis (3% sludge + 9% IPA) Steady State COD (mg/l) Total N (mg/l) NH 3 (mg/l) NO 3 - (mg/l) NO 2 - (mg/l) PO 4 (mg/l) ph Conductivity (?S/cm) Removal (%)


 Feed")
22 Dog Feces Treatment Slurry feed pre-processing: 14% solids (15.7 MJ/kg dry) Feed 10% solids + 4% IPA Effluent
23 Fresh Dog Feces Treatment Summary Dog poop +IPA Influent Effluent Analysis (10% sludge + 4% IPA) Steady State COD (mg/l) Total N (mg/l) NH 3 (mg/l) NO 3 - (mg/l) NO 2 - (mg/l) PO 4 (mg/l) ph Conductivity (µs/cm) Removal (%)
24 Treatment of Micro Pollutants Experimental Approach Spiked trace contaminants during a run Used high concentrations of Triclosan, Acetaminophen, and Ibuprofen Run with spiked IPA first, then spiked dog feces and IPA Results Ibuprofen and acetaminophen (10 mg/l each) not analyzed yet Triclosan: Relevant concentration: µg/l Concentration spiked: 100 µg/l Concentration in effluent (IPA treatment): ND at < 0.1 µg/l Concentration in effluent (dog feces + IPA treatment ): < 0.1 µg/l Removal > 99.99%
25 Modeling Studies Develop a conceptual model of the process (with reaction kinetics, mass and energy balances) Use model to: Conduct data analysis Explore process sensitivity Process optimization and design Methods: Aspen Plus Peng-Robinson equation of state Plug flow kinetic reactor (Rplug) Heat exchangers sizing using the Exchanger Design and Rating (EDR) tool Reactions (IPA) 2C 3 H 8 O + 9O 2 8H 2 O + 6CO 2 C 3 H 8 O + 3O 2 4H 2 O + 3CO r i = ke E a Τ C IPA C O2 2CO + O 2 2CO 2
26 Modeling the Heat Exchangers Shell side Tube side Exp. Model U (W/m 2 -K) Q (kw) LMTD (K)
27 Modeling the Heat Exchangers Tube side Exp. Model U (W/m2-K) Q (kw) LMTD Shell side


28 Adding Heat Losses to the System Model vs. Experiments We are currently using the model to optimize process design and operation using a factorial approach
29 Current and Projected Energy Balance Motor Size (kw) Duty Cycle Actual Power (kw) Furnace 15 90% 13.5 Air Compressor % 9.0 Water Pump % 1.9 Biomass Pump 11 15% 1.7 PC Pump % 0.34 PLC and Sensors 1 100% 1 Net Electric Power Draw (kw): 27.3 Optimized Gasoline design: Equilivance* (gal/day): 49 Turn of furnace (autothermal) Recover energy from gas expansion (3-6 kw) Expected draw ~6-10 kw Produce 5-10 kw as heat Currently not autothermal: But we have 17 kw heat loss in final cooling and ~10 kw heat losses around the reactor

30 Some Lessons Learned Design Pumping slurries at low flow and high pressure is a challenge Compression fittings in temperature zones above 350 C = high failure rate Operation Capillary depressurization system is difficult to control during start up and shut down but work well otherwise Foam in the HEPS can affect level sensor reading Modeling Losses play a crucial role, requires some tricks in Aspen

31 Concluding Remarks: Why I am Optimistic SCWO achieves both waste treatment and pathogen control extremely fast. We can even co-treat hazardous wastes and produce clean water, without odor, SOx, or NOx emissions Selling high value added by products can be a driver Sell a 10 L shower 5-10 cents = $ per kwh! But many challenges remain Acknowledgments Gates Foundation and USDA for fundingdeshusses lab marc.deshusses@duke.edu