M RC S EA FOR H YD ROPOW E R O N TH E M E KO NG M AI NS T R EAM INCEPTION REPORT VOL II MAINSTREAM PROJECT PROFILE SUMMARIES 23 OCTOBER 2009
|
|
|
- Shon Poole
- 5 years ago
- Views:
Transcription
1 II M RC S EA FOR H YD ROPOW E R O N TH E M E KO NG M AI NS T R EAM INCEPTION REPORT VOL II MAINSTREAM PROJECT PROFILE SUMMARIES 23 OCTOBER 2009 The MRC SEA of Hydropower on the Mekong mainstream comprises 4 main phases: (i) scoping, (ii) baseline assessment, (iii) opportunities & risks assessment, and (iv) avoidance, enhancement and mitigation assessment. This Inception report formally concludes the scoping phase of the SEA and reports on the outcomes of the scoping consultations as well as the methodology and design of the SEA for the subsequent phases. The Inception report is comprises five volumes including supporting materials and reports: VOLUME I: Inception Report VOLUME II: Mainstream project profile summaries VOLUME III: National scoping consultation summaries VOLUME IV: SEA Theme papers and additional studies proposals VOLUME V: The SEA Communications, Consultations and Capacity Building Plan This volume summarizes the results of field missions and developer consultations to define the design and characteristics of the 11 mainstream projects I C E M I n t e r n a t i o n a l C e n t r e f o r E n v i r o n m e n t a l M a n a g e m e n t 1 I C E M
2 CONTENTS _Toc Orientation Sources of Information Design and characteristics overview Detailed Project profiles PAK BENG OVERVIEW OF PROJECT PURPOSE RESERVOIR CONSTRUCTION IMPACTS COSTS Maps and Images LUANG PRABANG OVERVIEW OF PROJECT PURPOSE RESERVOIR CONSTRUCTION IMPACTS COSTS Maps and Images XAYABURI Overview RESERVOIR CONSTRUCTION IMPACTS Maps and Figures I C E M
3 4.4 PAK LAY OVERVIEW OF PROJECT PURPOSE RESERVOIR CONSTRUCTION IMPACTS COSTS Maps and Images SANAKHAM OVERVIEW OF PROJECT PURPOSE RESERVOIR CONSTRUCTION IMPACTS COSTS Maps and Images PAK CHOM OVERVIEW OF PROJECT PURPOSE RESERVOIR CONSTRUCTION IMPACTS COSTS Maps and Images BAN KOUM OVERVIEW OF PROJECT PURPOSE RESERVOIR CONSTRUCTION I C E M
4 4.7.5 IMPACTS COSTS Maps and Images LAT SUA OVERVIEW OF PROJECT PURPOSE RESERVOIR CONSTRUCTION IMPACTS COSTS Maps and Images DON SAHONG OVERVIEW OF PROJECT PURPOSE RESERVOIR CONSTRUCTION IMPACTS COSTS Maps and Images THAKHO HPP OVERVIEW OF PROJECT PURPOSE RESERVOIR CONSTRUCTION IMPACTS COSTS Maps and Images STUNG TRENG OVERVIEW OF PROJECT I C E M
5 PURPOSE RESERVOIR CONSTRUCTION IMPACTS COSTS Maps and Images SAMBOR OVERVIEW OF PROJECT PURPOSE RESERVOIR CONSTRUCTION IMPACTS COSTS Maps and Figures I C E M

6 1 ORIENTATION The Lower Mekong mainstream dams described below can be found in the map below 1 : 1 The SEA team is preparing a comprehensive set of maps in which spelling for all proposed hydropower projects is consistent as follows: Pak Beng, Luang Prabang, Xayaburi, Pak Lay, Sanakham, Pak Chom, Ban Koum, Lat Sua, Don Sahong, Thakho diversion, Stung Treng, Sambor. For the purposes of the inception report Map 1 taken from the MRC website uses alternative spelling for Xayaburi. 6 I C E M
7 2 SOURCES OF INFORMATION The design and characteristics of the 11 mainstream hydropower projects are continually evolving. The information presented in this volume reflects the updated and new information that the SEA team has been able to collect on the projects through a program of developer consultation activities, including: (i) Field missions (ii) Consultations with developers (iii) Developer presentations (iv) Environmental and Feasibility assessments (v) Government reports A detailed listing of information sources is given in Table 1. Table 1 Mainstream projects covered in the SEA No. MAINSTREAM PROJECT DEVELOPER 1 Pak Beng Datang International Power Generation (China) 2 Luang Prabang PETROVIETNAM Power Corporation (Vietnam) 3 Xayabouri SEAN & Ch. Karnchang Public Co Ltd (Thailand) SOURCE OF INFORMATION FOR THE SEA MRC hydropower data base IEE prepared by NorConsult, Optimization Study MRC hydropower data base Consultation & field visit with PetroVietnam, Optimization Study MRC hydropower data base EIA and discussion with TEAM Engineering consultants, Optimization Study 4 Pak Lay CEIEC & Sino-Hydro (China) MRC hydropower data base IEE for Pak Lay by Norconsult, Optimization Study 5 Xanakham Datang International Power Generation (China) 6 Pak Chom Joint feasibility study by Panya consultants commissioned by Ministry of Energy in Thailand and Ministry of Mines and Energy in Lao PDR 7 Lat Sua Italian Thai Asia Corp. Holdings (Thailand) MRC hydropower data base Optimization Study MRC hydropower data base Presentation made by Panya consultants March 2008 MRC hydropower data base Feasibility study prepared by Team Engineering consultants 8 Ban Koum Charoen Energy & Waters Asia Co. Ltd MRC Hydropower database Presentation made by Macro consultants, March Don Sahong Mega First MRC hydropower data base EIA Thakho Compagnie Nationale du Rhone and EDL IEE prepared for CNR and WWF 11 Stung Treng Open Joint Stock Co. Bureyagessttroy MRC Hydropower database 12 Sambor China Southern Power Grid MRC hydropower data base Consultations with China Southern Grid rep in PP Review of the feasibility study 7 I C E M
8 MAINSTREAM DAM LOCATION DEVELOPER EARLIEST POTENTIAL COMMISSION DATE DESIGN STATUS ENVIRONMENTAL ASSESSMENT STATUS Rated Head (m) Plant Design Discharge (m3/s) Installed Capacity (MW) Peaking Capability (MW ) Mean Annual Energy (GWh ) Firm Annual Energy (GWh ) Full Supply Level (mamsl ) Low Supply Level (Mamsl) Live Storage (mcm ) RESERVOIR AREA (km2) Length of dam (m) Height (m) V O L II P R O J E C T P R O F I L E S M R C S E A f o r H Y D R O P O W E R O N T H E M E K O N G M A I N S T R E A M 3 DESIGN AND CHARACTERISTICS OVERVIEW MANAGEMENT STATUS DESIGN SPECIFICATIONS DIMENSIONS Pak Beng Lao PDR Datang International Power Generation Louang Prabang Lao PDR Petrovietnam Power Corporation Xayaburi Lao PDR SEAN & Ch. Karnchang Public Co Ltd MoU, feasibility 2016 MoU, feasibility MoU, feasibility Pak Lay Lao PDR CEIEC and Sino-Hydro 2016 MoU, feasibility Sanakham Lao PDR Datang International Power Generation 2016 MoU, feasibility IEE submitted Feasibility study, 31 7,250 1,230 1,230 5,517 4, ,812 1,410 1,412 5,437 4, Feasibility and full ESIA submitted 24 6,018 1,260 1,260 6,035 5, IEE submitted Not yet 26 4,500 1,320 1,320 6,460 4, , ,200 5,015 3, , , Pakchom Lao PDR N/a 2017 MasterPlan Not yet 22 5,720 1,079 1,079 5,318 5, , Ban Koum Lao PDR Italian Thai Asia Corp. Holdings Latsua Lao PDR Charoen Energy and Water Asia Co Ltd Don Sahong Thakho diversion Stung Treng Lao PDR Mega First 2017 MoU, feasibility 2016 PDA, detailed planning Lao PDR CNR & EDL 2016 MoU, prefeasibility Cambodia Open Joint Stock Co. Bureyagessttroy Sambor Cambodia China Southern Power Grid N/a MoU, prefeasibility 2020 MoU, prefeasibility Not yet 19 11,700 1,872 1,872 8,434 8, Pre-feasibility study submitted , ,668 1, Full EIA submitted, Additional studies 17 2, ,375 1, IEE submitted Not yet 290 (ha) n/a n/a 15 18, ,870 2, Pre-feasibility submitted 33 17,668 2,600 2,030 11,740 9, , MoU, prefeasibility Channel - 1,800m n/a 10, , I C E M
9 4 DETAILED PROJECT PROFILES During consultations with developers, the SEA team prepared a project questionnaire which was filled out with the developers or formally sent for completion, and based upon the information collected as shown in Table 1. (i) Pak Beng (ii) Luang Prabang (iii) Xayabouri (iv) Pak Lay (v) Sanakham (vi) Pak Chom (vii) Ban Koum (viii) Lat Sua (ix) Don Sahong (x) Thakho diversion (xi) Stung Treng (xii) Sambor It should be pointed out that the designs are changing regularly as greater detail on feasibility and constraints are investigated and upon the requirements of the different governments. All information is relevant as of October The details and specific characteristics are evolving through their design cycle and the SEA team will be updating information as needed. 4.1 PAK BENG Source: Pak Beng IEE, Norconsult MRC database figures shown in red where different OVERVIEW OF PROJECT 1. Name of Dam Pak Beng HPP 2. Location of preferred site option 2,188 km upstream of delta o Latitude 19 50'37.64"N o Longitude 101 1'7.22"E MRC database gave a location downstream of Pak Beng town. This was incorrect the location is about 15 km upstream of Pak Beng Town 2. Dam statistics o Height, 85 m 76 (MRC) o Length, 943 m o Type of dam construction Concrete gravity 3. Please provide dam lay out if available N/A 4. Rated head (metres) 30.5 (IEE) 35 (Dept of Electricity) 31 (MRC) 5. Plant discharge (cu.m/sec) 7, Number of Units 10 x 123 MW 9 I C E M
10 7. Installed capacity (MW) 1,230 MW 8. Firm and secondary energy generated annually (gigawatt hours) Mean - 5,517 GWh/yr Firm 4, Mode of operation o continuous generation or peak load o if peak load, hours of operation per day 10. Environmental flow discharges, Q (cu.m/sec) Mean annual Q 3,160 ( masl) Min observed flow 635 ( masl) Max observed flow 23,500 (333.7 masl) 11. Spillway design o open flow o gated spillway, o dimensions 15 gates - Elevation 322 masl 15 m wide x 23 m high 12. Max spillway design discharge and return period used 27,300 (P=0.2%) 13. Estimated sediment load per year (million cu.m/year) 14. Mechanisms proposed for clearing sediment, how often might these be used? Sand flushing gates 15. Dimensions of bottom outlets, 16. Design discharge for bottom outlet (cu.m/sec) 17. Sediment flushing outlets - dimensions and design discharge 3 x (3 m wide x 5 m high) elevation 306 m asl PURPOSE 18. Proposed market for electricity, 3.1 national (%) 10% 4.1 export (%) to which country? 90% Thailand 19. Multipurpose uses considered (if any) Navigation 20. Details of irrigation, if being considered (Cu.m/s or area irrigated) RESERVOIR Headpond type capable of being lowered to pass floods and bedload 21. Full Supply level of reservoir (masl) 345 changed to 340 masl (Dept of Electricity) 22. Low Supply level of reservoir (masl) I C E M
11 23. Area inundated at FSL (sq. km) Active volume of the reservoir (million.cu.m) Dead storage volume of reservoir (million.cu.m) 26. Draw down (m) 27. Expected daily fluctuations in level of reservoir (m) 28. Length of reservoir (km) CONSTRUCTION Area of construction site 214 ha for living areas, construction sites, internal roads, 2 quarries on left and right banks, port area 29. Duration of construction 64 months First generation starts after 48 months 30. Access roads required length (km) 1.74 km to connect the road from Ban Pak Beng Internal access roads 7.4 km concrete roads 6.5 km of gravel roads Upstream bridge across Mekong to connect both sides of site 2.6 ha of mixed deciduous and unstocked forest 31. Transmission line required length (km) To Thailand route not determined yet 32. Expected size of construction workforce, workers o skill types required o policy for local employment 33. Dimensions of navigation locks (if any) 1 lock capacity 500 tonnes 73 m long x 12 m wide x 3.2 m deep Lift m 34. Type and dimensions of fish passes (if any) included but no details IMPACTS Total area of reservoir 87 sq km Mekong river and tributaries 70 sq km 80% Cultivated land 13 sq km 15% Mixed bamboo and secondary forest 4 sq km 5% 35. Total area of agricultural land inundated (ha) 1,325 ha o irrigated area inundated (ha) 332 ha o rainfed agriculture (ha) o slash and burn (ha) 11 I C E M

12 o Main crop types 36. Total Area of forest (ha) o types of forest cover inundated mixed bamboo and secondary forest 37. Number of communities, households and people to be resettled o Communities 28 villages o households 774 households o people 6,700 persons 38. Infrastructure inundated in reservoir o Paved roads (km) o Government buildings, o Hospitals, o Schools, o Temples etc. 39. Tourism and cultural sites lying in the inundation zone o Caves, waterfalls, historic sites o Cultural sites COSTS 40. Estimated cost of the dam (Million $) 41. Estimated environmental and social costs (million $) MAPS AND IMAGES Google earth Image 12 I C E M
13 13 I C E M


14 Pak Beng HPP Dam site drilling boreholes 14 I C E M

15 Surveyors camp 15 I C E M
16 4.2 LUANG PRABANG Source: Feasibility study prepared by PECC1 for Louangprabang MRC database figures shown in red where different OVERVIEW OF PROJECT 3. Name of Dam Louangprabang 4. Location of preferred site option o Latitude km from sea. 3.5 km upstream from Nam Ou confluence o Longitude Dam statistics o Height, 57.5 m o Length, 318 m o Type of dam construction Gravity, concrete 43. Please provide dam lay out if available 44. Rated head (metres) 33.6 m (NB Optimisation study suggests 32 m) 45. Plant discharge (cu.m/sec) 5,091 cu.m/sec 46. Number of Units 10 Kaplan units 47. Installed capacity (MW) 1500 MW 48. Firm and secondary energy generated annually (gigawatt hours) Isolated 7,102.7 x 10 6 KWh Cascade 8,258.0 x 10 6 KWh 49. Mode of operation o continuous generation or peak load o if peak load, hours of operation per day hrs per day isolated 4,735 hrs/yr cascade 5,505 hrs/yr 50. Environmental flow discharges (cu.m/sec) N/A - but Average flow = 3,061 cu.m/sec PMF 45,900 cu.m/sec 51. Spillway design o open flow o gated spillway, o dimensions 10 radial gates 18 x 22 m 52. Max spillway design discharge and return period used 44,838 cu.m/sec - 1:10,000 yrs 53. Estimated sediment load per year (million cu.m/year) 59.1 m tonne per yr Inflow to dam site 46.7 m tonne/yr 16 I C E M
17 6.95% captured by dam site 54. Mechanisms proposed for clearing sediment, how often might these be used? NA 55. Dimensions of bottom outlets, NA 56. Design discharge for bottom outlet (cu.m/sec) NA 57. Sediment flushing outlets - dimensions and design discharge NA PURPOSE 58. Proposed market for electricity, 5.1 national (%) 10% 6.1 export (%) to which country? 90% to Vietnam 59. Multipurpose uses considered (if any) navigation 60. Details of irrigation, if being considered (Cu.m/s or area irrigated) None RESERVOIR 61. Full Supply level of reservoir (masl) 320 masl 62. Low Supply level of reservoir (masl) 318 masl 63. Area inundated at FSL (sq. km) sq km 64. Active volume of the reservoir (million.cu.m) mcu.m 65. Dead storage volume of reservoir (million.cu.m) 1,453.7 m cu.m (total storage 1,589.5 m cu.m) 66. Draw down (m) 2 m 67. Expected daily fluctuations in level of reservoir (m) up to 2 m 68. Length of reservoir (km) 170 at FSL, 140 at MSL CONSTRUCTION 69. Duration of construction 2 yrs prep, 8 yrs construction 70. Access roads required length (km) 1 bridge across Nam Ou, temporary bridge across mainstream 4 km access road along left bank 11 km from Pak Ou to Route Transmission line required length (km) 400 km of 500 kva line to sub-station 17 I C E M
18 72. Expected size of construction workforce, 6000 o skill types required skilled workers from Vietnam, but Laos skilled workers can apply o policy for local employment 73. Dimensions of navigation locks (if any) Multiple step, 1,210,000 ton of shipping /yr 2 locks at 12 x 120 x 3 m depth 74. Type and dimensions of fish passes (if any) Provided for on right bank but no details yet IMPACTS Total reservoir area Existing water surface 7,239 ha 2,864 ha 75. Total area of agricultural land inundated (ha) 194 ha o irrigated area inundated (ha) o rainfed agriculture (ha) o slash and burn (ha) o Main crop types Industrial trees (teak) 76. Total Area of forest (ha) 4,181.0 ha various o types of forest cover inundated 77. Number of communities, households and people to be resettled 9ha of settlement o Communities 36 o households 2,516 o people 12, Infrastructure inundated in reservoir o Paved roads (km) o Government buildings, o Hospitals, o Schools, o Temples etc. 79. Tourism and cultural sites lying in the inundation zone o Caves, waterfalls, historic sites o Cultural sites None small small Pak Ou caves are 3 km downstream of dam site COSTS 80. Estimated cost of the dam (Million $) Billion USD 81. Estimated environmental and social costs (million $) 9.88 million USD over 10 yrs construction period 7 million USD over 30 yr operation 18 I C E M

19 4.2.7 MAPS AND IMAGES Google earth pictures of Louangprabang HPP site 19 I C E M

20 Reservoir area of Louangprabang extends to Pak Beng 20 I C E M


21 View from Pak Ou upstream to dam site Nam Ou confluence with Mekong 21 I C E M


22 Dam site left bank Dam site right bank see village just downstream of dam site 22 I C E M
23 4.3 XAYABURI Source: Team Consult, consulting engineers and EIA consultants for Xayaburi HPP OVERVIEW 1. Name of Dam Xayaburi Hydroelectric Power Project 2. Location of preferred site of option Longitude E 796, 300 Latitude N 2,130, Dam statistics - Height 38 m. - Length 810 m. - Type of dam construction Composite of Powerhouse, Spillway, Fish passing facilities and Navigation locks with no dam body. 4. Rated head : 29.5 m. 5. Plant discharge: 5,000 m 3 sec 6. Number of Units: 8 Kaplan units 7. Installed capacity: 8 x 160 MW = 1,280 MW 8. Firm and secondary energy generated annually. Primary energy Secondary energy Excess energy Total energy 9. Mode of operation 4,180.9 GWh year GWh year 2,264.7 GWh year 7,316.6 GWh year - Operating criteria, Daily discharge = Daily in flow. - Water loss form fish passing facilities 10 m 3 / sec. - Water loss from sand flushing 500 m 3 / sec. for 6 hrs. day during dry season. 10. Environmental flow discharges: 2,000 m 3 / sec. 11. Spillway design - Open flow 47,500 m. / sec. - Gated spillway 12 units. - Dimensions 18 x 20 m 3 23 I C E M
24 12. Max spillway design discharge and return period used 47,500 m 3 sec. for 10,000 years flood. 13. Estimated sediment load per year Under investigation 14. Mechanisms proposed for electing sediment, how often might these be used? Twin steel lined conduits located between every two units and controlled by bonneted gates. In order to allow the operation of the sand flushing outlets without stopping the operation of the near by generators. Flushing about 6 hrs. per day when water in Mekong less than 5,000 m 3 / sec. 15. Dimension of bottom outlets: No bottom outlets 16. Design discharge for bottom outlet: No. 17. Sediment flushing outlet-dimensions and design discharge. Twin 3x3 m conduits that can discharge 140 m 3 / sec each. 18. Proposed market for electricity - national 10% - export 90% to Thailand 19. Multipurpose use considered: Navigation 20. Details of irrigation: No RESERVOIR 21. Full supply level : msl 22. Low supply level: +268 msl. 23. Area inundated at FSL: 49 sq km. 24. Active volume of reservoir: mcm. 25. Dead storage volume of reservoir: mcm. 26. Draw down: 7.0 m. 27. Expected daily fluctuations in level of reservoir: No. 28. Length of reservoir 90 km CONSTRUCTION 29. Duration of construction: 7.5 years 24 I C E M
25 30. Access road required: 25 km. 31. Transmission line required: 220 km. 32. Expected size of construction work force, - Skill types required - Engineer persons - Technician and skilled labor persons - Unskilled labor 2,000-2,200 persons - Policy for local employment Priority to local people 33. Dimensions of navigation locks: Two step of navigation locks 12 m. x 195 m. x 5m. each 34. Type and dimensions of fish passes 2 sets of Fish ladder with opening of 3x10 m 2, between spillway and power house and left abutment near power house IMPACTS 35. Total area of agricultural land inundated - Irrigation area inundated No - Rain fed agriculture 18 ha - Slash and burn No - Main crop types Maize, Job s teas, and sesame 36. Total area of forest -Type of forest cover inundated Teak plant 162 ha 37. Number of communities, households and people to be resettled - Communities: 10 villages - Households: 391 HH. - People: About 2,130 people 38. Infrastructure inundated in reservoir: - Paved roads: No - Government building: One small building not in use - Hospital: No - Schools: 7 - Temple: 4 - Cemetery: Tourism and Cultural sites lying in the inundated zone 25 I C E M


26 - Cave, water fall, historic site: No - Cultural sites No MAPS AND FIGURES Google Earth images of the Xayaburi Dam site 26 I C E M

27 27 I C E M


28 Xayaburi Dam site - looking upstream Xayaburi Dam site looking to right bank, with village to be moved temporarily during construction works 28 I C E M


29 Xayaburi Dam site looking downstream About 20 km upstream of dam site, showing current navigation, settlements and shifting cultivation 29 I C E M
30 4.4 PAK LAY Source: Pak Lay IEE, Norconsult. MRC database figures shown in red where different. Note: Following optimization study, Pak Lay has been subject both to reduced reservoir FSL levels and choice of site Option 2. The design details quoted here refer to the original specification, and so these will change OVERVIEW OF PROJECT 1. Name of Dam Pak Lay (Lao PDR) 2. Location of preferred site Option 1 Option 2 o Latitude 18 o 19.5 N 18 24'5.34"N o Longitude 101 o 31.6 E '1.01"E There is a second option for the site, Option 2, which is located 10 km upstream, which will flood a smaller area and require only 1/3 rd of people to be resettled. 1. Dam statistics o Height, 35 m (54.5 m or 45.5m) o Length, 630 m (738.1m or 1,165m) o Type of dam construction Set of 5 x Earth fill Rock closure dykes Across two channels 2. Please provide dam lay out if available 3. Rated head (metres) max head 38.5 m at masl min. 35 m (25.7m) 4. Plant discharge (cu.m/sec) 4,500 cu.m/sec (5,782 cu.m/sec) 5. Number of Units 2 x 5 = 10 Kaplan units 6. Installed capacity (MW) 1,320 MW 7. Firm and secondary energy generated annually (gigawatt hours) Mean 6,460 GWh (5,782) Firm (4,636) 8. Mode of operation o continuous generation or peak load peak load o if peak load, hours of operation per day 8 10 hrs per day 9. Environmental flow discharges (cu.m/sec) 5 8% of mean annual flow = 308 cu.m/s Mean Annual Flow 3,850 cu.m/sec (4,030) 10. Spillway design o open flow 30 I C E M o gated spillway, o dimensions 12 radial gates 294 m in length, 67 m wide (230 masl at 18 m) 11. Max spillway design discharge and return period used 38,400 cu.m/sec (32,526 Cu.m/sec) 1 in 10,000 year flood (33,600 cu.m/sec = 1 in 1,000 yr flood)
31 12. Estimated sediment load per year (million cu.m/year) N/a 13. Mechanisms proposed for clearing sediment, how often might these be used? 14. Dimensions of bottom outlets, 15. Design discharge for bottom outlet (cu.m/sec) (4,500 cu.m/sec) 16. Sediment flushing outlets - dimensions and design discharge PURPOSE 17. Proposed market for electricity, national (%) export (%) to which country? 100% Thailand 18. Multipurpose uses considered (if any) Hydropower only 19. Details of irrigation, if being considered (Cu.m/s or area irrigated) None RESERVOIR 20. Full Supply level of reservoir (masl) 250 masl (248 masl) Changed to 240 masl (Dept of Electricity) 21. Low Supply level of reservoir (masl) 247 masl (245 masl) Changed to 237 masl (Dept of Electricity) 22. Area inundated at FSL (sq. km) Option sq.km Option 2-70 sq.km 23. Active volume of the reservoir (million.cu.m) (316.5 m.cu.m) Volume of water discharged through turbines 144 m.cu.m Time taken to refill after 8 hours generation at dry season flow 20 hours 24. Dead storage volume of reservoir (million.cu.m) 25. Draw down (m) 3 m 26. Expected daily fluctuations in level of reservoir (m) 1 2 m 27. Length of reservoir (km) Option km Option km CONSTRUCTION 28. Duration of construction 4-5 years 29. Access roads required length (km) 3 options 1) Upgrade existing road from Vientiane to site; 2) construction new road into site; 3) using Mekong river transport 31 I C E M
32 30. Transmission line required length (km) 4 circuit 210 volt from 2 x 500kV Switchyards to Thailand 31. Expected size of construction workforce, several 1,000s o skill types required o policy for local employment 32. Dimensions of navigation locks (if any) 1000 tonne, One single line double-lift lock chamber 33. Type and dimensions of fish passes (if any) Planned but no dimensions yet IMPACTS 34. Flooded area River 33% existing river channel 32 I C E M Forest 48% Agricultural land 24% River bank and island 8% 35. Total area of agricultural land inundated (ha) Option 1 1,300 ha, Option ha o irrigated area inundated (ha) rice paddy 1) 700 ha 2) 165 ha o rainfed agriculture (ha) production land 1) 600 ha, 2) 500 ha o slash and burn (ha) o Main crop types 36. Total Area of forest (ha) o types of forest cover inundated Production forest 1) 3,600 ha 2) 2000 Conservation forest 1)350 ha 2) 180 ha Protection forest 1) 250 ha 2) 0 Option 1 Option 2 Unstocked forest 38% 25% Upper mixed deciduous forest 11% 10% Other land (bamboo, rice paddies, shifting) 18% 16% River and tributaries 33% 37. Number of communities, households and people to be resettled o Communities Option 1 27, Option 2 16 o households
 o Government buildings, o Hospitals, o Schools, o Temples etc. 39.")
33 o people Option 1 19,046, Option 2 6,129 (MRC data base 1,780) NB: With Option 2 and lower FSL at 240 masl, Dept of Electricity considers that NO resettlement necessary 38. Infrastructure inundated in reservoir o Paved roads (km) o Government buildings, o Hospitals, o Schools, o Temples etc. 39. Tourism and cultural sites lying in the inundation zone o Caves, waterfalls, historic sites o Cultural sites COSTS 40. Estimated cost of the dam (Million $) estimated 1,000 M$ +/- 41. Estimated environmental and social costs (million $) MAPS AND IMAGES Google earth Image 33 I C E M


34 Pak Lay Dam Site Option 1 looking upstream 34 I C E M

35 Dam site Option 1 - looking towards right bank 35 I C E M
36 4.5 SANAKHAM Source: TOR for ESIA, Datang, MRC database MRC database figures shown in red where different. Note that following the optimization study, the FSL of the reservoir has been reduced to 220 masl and the dam location has been moved 35 km downstream OVERVIEW OF PROJECT 1. Name of Dam Sanakham HPP 2. Location of preferred site option 1,737 km upstream of delta o Latitude 17 50'N o Longitude 'E Note that this new location is about 1 km upstream of the Thai/Lao border Originally located at o Latitude o Longitude 1772 km upstream of delta 'N 'E 3. Dam statistics o Height, 38 m (MRC) o Length, 1,143.6 m o Type of dam construction Concrete gravity 4. Please provide dam lay out if available N/A 5. Rated head (metres) 25 (MRC) 6. Plant discharge (cu.m/sec) 5, Number of Units 10 x 70 MW 8. Installed capacity (MW) 700 MW (1,268 MW MRC) 9. Firm and secondary energy generated annually (gigawatt hours) Mean - 3,210 GWh/yr (5,516 MW MRC) Firm 4,438 GWh/yr 10. Mode of operation o continuous generation or peak load o if peak load, hours of operation per day Not known yet 11. Environmental flow discharges, Q (cu.m/sec) Mean annual Q 4,160 Min observed flow Max observed flow 33, Spillway design o open flow o gated spillway, 36 I C E M
37 o dimensions 13. Max spillway design discharge and return period used 14. Estimated sediment load per year (million cu.m/year) 15. Mechanisms proposed for clearing sediment, how often might these be used? Sand flushing gates 16. Dimensions of bottom outlets, 17. Design discharge for bottom outlet (cu.m/sec) 18. Sediment flushing outlets - dimensions and design discharge PURPOSE 19. Proposed market for electricity, national (%) 10% export (%) to which country? 90% Thailand 20. Multipurpose uses considered (if any) Navigation 21. Details of irrigation, if being considered (Cu.m/s or area irrigated) RESERVOIR Headpond type capable of being lowered to pass floods and bedload 22. Full Supply level of reservoir (masl) 220 (Dept of Electricity) 23. Low Supply level of reservoir (masl) Area inundated at FSL (sq. km) 94 (but this will increase with move 35 km downstream) 25. Active volume of the reservoir (million.cu.m) (but this will increase with move 35 km downstream) 26. Dead storage volume of reservoir (million.cu.m) 27. Draw down (m) 5 m 28. Expected daily fluctuations in level of reservoir (m) not known 29. Length of reservoir (km) 80 km CONSTRUCTION 37 I C E M
38 Area of construction site? 30. Duration of construction? months Access roads required length (km) 31. Transmission line required length (km) To Thailand route not determined yet 32. Expected size of construction workforce, workers o skill types required o policy for local employment 33. Dimensions of navigation locks (if any) 2 step ship lock capacity 1,000 tonnes 34. Type and dimensions of fish passes (if any) included but no details IMPACTS Total area of reservoir 80 sq km Mekong river and tributaries 20 sq km 25% Cultivated land 60 sq km 75% Mixed bamboo and secondary forest? sq km % (but this will increase with move 35 km downstream) 35. Total area of agricultural land inundated (ha) o irrigated area inundated (ha) o rainfed agriculture (ha) o slash and burn (ha) o Main crop types 36. Total Area of forest (ha) o types of forest cover inundated mixed bamboo and secondary forest 37. Number of communities, households and people to be resettled o Communities 10 Villages o households 800 o people 4,000 persons 38. Infrastructure inundated in reservoir o Paved roads (km) o Government buildings, o Hospitals, o Schools, o Temples etc. 39. Tourism and cultural sites lying in the inundation zone o Caves, waterfalls, historic sites o Cultural sites 38 I C E M
 4.5.")
39 4.5.6 COSTS 40. Estimated cost of the dam (Million $) 41. Estimated environmental and social costs (million $) MAPS AND IMAGES Google earth Image (new revised site) (Yellow line marks the Thai/Lao border) 39 I C E M


40 Google earth image showing new site 35 km downstream of original site and 80 km downstream of PakLay dam site Location of proposed Sanakham dam site 40 I C E M


41 Mekong river upstream of Sanakham dam site and looking south (downstream) Mekong river near proposed Sanakham dam site 41 I C E M
 and Laos 42 I C")
42 Mekong river 10 km downstream of Sanakham dam site, after border with Thailand (on left) and Laos 42 I C E M
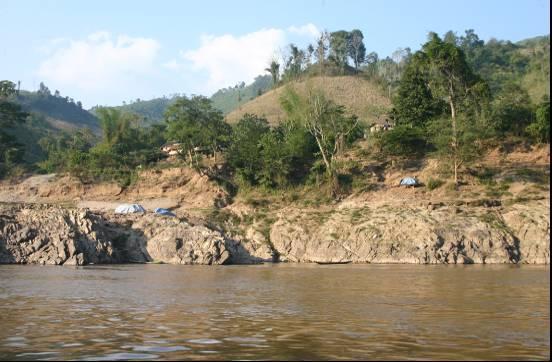
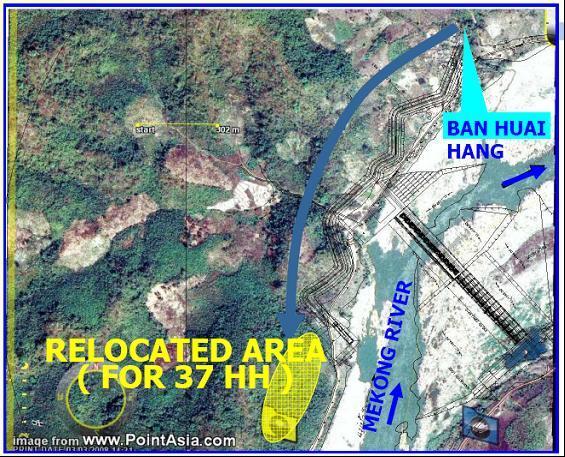
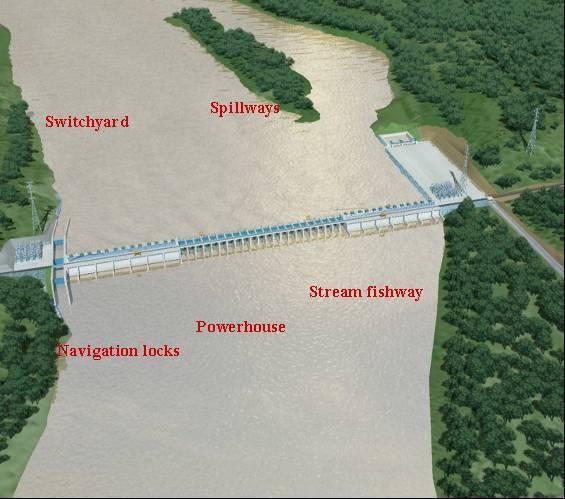
43 4.6 PAK CHOM Source: presentation on Pak Chom made by Panya Consultants on behalf of Ministry of Energy March MRC Database OVERVIEW OF PROJECT 1. Name of Dam Pak Chom HPP 2. Location of preferred site option 1,651 km upstream of delta o Latitude 18 12'12.00"N o Longitude 102 3'0.00"E Located at KM 1651 from the mouth of the Mekong River and adjacent to Ban Huai Khop, Loei Province, Thailand and to Ban Huai Hang, Sangthong District, Vientiane Capital, Lao PDR 3. Dam statistics o Height, o Length, o Type of dam construction 55 m 1,200 m Concrete gravity 4. Please provide dam lay out if available N/A 5. Rated head (metres) 22 m 6. Plant discharge (cu.m/sec) 5, Number of Units 13 x 83 MW 8. Installed capacity (MW) 1,079 MW 9. Firm and secondary energy generated annually (gigawatt hours) Mean - 5,318 GWh/yr Firm 5, Mode of operation o continuous generation or peak load Continuous o if peak load, hours of operation per day 11. Environmental flow discharges, Q (cu.m/sec) Mean annual Q 4,385 Max observed flow 33,526 (100 yr) 12. Spillway design o open flow o gated spillway, o dimensions 14 gates 20 m wide x 25 m high 13. Max spillway design discharge and return period used 33,526 (100 yr) 14. Estimated sediment load per year (million cu.m/year) 43 I C E M
44 15. Mechanisms proposed for clearing sediment, how often might these be used? Sand flushing gates 16. Dimensions of bottom outlets, 17. Design discharge for bottom outlet (cu.m/sec) 18. Sediment flushing outlets - dimensions and design discharge PURPOSE 19. Proposed market for electricity, national (%) export (%) 10% Lao 90% Thailand 20. Multipurpose uses considered (if any) Navigation, 6 x Flood mitigation projects, with protecting dykes, regulating gates and pumping stations 21. Details of irrigation, if being considered (Cu.m/s or area irrigated) 11 pumped irrigation projects with total are of 2,944 ha and irrigated area of 2,706 ha. ( 1 project in Lao PDR (217 ha irrigated, 10 projects in Thailand) RESERVOIR 22. Full Supply level of reservoir (masl) 192 masl 23. Low Supply level of reservoir (masl) 190 masl 24. Area inundated at FSL (sq. km) sq km 25. Active volume of the reservoir (million.cu.m) MCM 26. Dead storage volume of reservoir (million.cu.m) 27. Draw down (m) 2 m 28. Expected daily fluctuations in level of reservoir (m) up to 2 m 29. Length of reservoir (km) >80 km CONSTRUCTION Area of construction site 30. Duration of construction 31. Access roads required length (km) 44 I C E M
45 32. Transmission line required length (km) To Thailand 185 km to Udon substation 33. Expected size of construction workforce, o skill types required o policy for local employment 34. Dimensions of navigation locks (if any) 2 lock capacity 500 tonnes 200 m long x 20 m wide x 3.2 m deep 35. Type and dimensions of fish passes (if any) included but no details see diagram IMPACTS Total area of reservoir sq km Mekong river and tributaries 67.5 sq km 92% River bank area 6.04 sq km 8% in Thailand 2.78 sq km 46% in Lao PDR 3.26 sq km 54% 36. Total area of agricultural land inundated (ha) o irrigated area inundated (ha) o rainfed agriculture (ha) o slash and burn (ha) o Main crop types Thailand 128 ha Lao PDR 88.5 ha 37. Total Area of forest (ha) o types of forest cover inundated 38. Number of communities, households and people to be resettled o Communities 2 villages (1 Lao, 1 Thai) o households 107 households o people c 535 persons 39. Infrastructure inundated in reservoir o Paved roads (km) o o Government buildings, o Hospitals, o Schools, o Temples etc. 1.1 km road and 4 bridges in Thailand 1.6 km road and 1 bridge in Lao PDR 1 school 1 Temple 40. Tourism and cultural sites lying in the inundation zone o Caves, waterfalls, historic sites o Cultural sites COSTS 41. Estimated cost of the dam (Million $) 1,764 Million $ 45 I C E M

46 42. Estimated environmental and social costs (million $) 20 million $ MAPS AND IMAGES Google earth Image 46 I C E M


47 47 I C E M

48 48 I C E M


49 Landscapes in the proposed Pak Chom reservoir area 49 I C E M
50 4.7 BAN KOUM Source: presentation on Ban Koum made by Macro Consultants on behalf of Ministry of Energy March 2008 MRC database figures shown in red where different OVERVIEW OF PROJECT 1. Name of Dam Ban Koum HPP 2. Location of preferred site option km upstream of delta o Latitude 15 25'6.00"N o Longitude '12.00"E 3. Dam statistics o Height, o Length, o Type of dam construction 53 m 780 m Concrete gravity 4. Please provide dam lay out if available see below 5. Rated head (metres) 18.6 m 6. Plant discharge (cu.m/sec) 11, Number of Units 26 x 72 MW 8. Installed capacity (MW) 1,872 MW 9. Firm and secondary energy generated annually (gigawatt hours) Mean - 8,434 GWh/yr Firm 8,012 GWh/yr 10. Mode of operation o continuous generation or peak load Continuous o if peak load, hours of operation per day 11. Environmental flow discharges, Q (cu.m/sec) Mean annual Q 9,149 Max observed flow 60, Spillway design o open flow o gated spillway, o dimensions masl 20 m wide x 25.5 m high 13. Max spillway design discharge and return period used 60,972 (100 yrs) 14. Estimated sediment load per year (million cu.m/year) n/a 15. Mechanisms proposed for clearing sediment, how often might these be used? Sand flushing gates 50 I C E M
51 16. Dimensions of bottom outlets, 17. Design discharge for bottom outlet (cu.m/sec) 18. Sediment flushing outlets - dimensions and design discharge PURPOSE 19. Proposed market for electricity, national (%) export (%) 10% Laos, 90% Thailand 20. Multipurpose uses considered (if any) Navigation Irrigation 21. Details of irrigation, if being considered (Cu.m/s or area irrigated) 22 pumped irrigation projects 8 in Lao PDR, 14 in Thailand Total area = 11,006 ha of which 7,870 ha will be irrigated RESERVOIR 22. Full Supply level of reservoir (masl) 115 masl 23. Low Supply level of reservoir (masl) 115 masl 24. Area inundated at FSL (sq. km) sq km ( sq km) 25. Active volume of the reservoir (million.cu.m) 2,110 MCM 26. Dead storage volume of reservoir (million.cu.m) 27. Draw down (m) 0 m 28. Expected daily fluctuations in level of reservoir (m)? 29. Length of reservoir (km) CONSTRUCTION Area of construction site 30. Duration of construction 31. Access roads required length (km) 32. Transmission line required length (km) 434 km to Chaiyaphum substation in Thailand 33. Expected size of construction workforce, 51 I C E M
52 o skill types required o policy for local employment 34. Dimensions of navigation locks (if any) 2 lock capacity 500 tonnes 200 m long x 20 m wide x 3.2 m deep 35. Type and dimensions of fish passes (if any) see design below IMPACTS Total area of reservoir sq km In channel sq km Above banks sq km of which in Thailand, and in Laos 36. Total area of agricultural land inundated (ha) 144 ha in Thailand, ha in Laos o irrigated area inundated (ha) o rainfed agriculture (ha) o slash and burn (ha) o Main crop types 37. Total Area of forest (ha) o types of forest cover inundated 38. Number of communities, households and people to be resettled o Communities 1 villages in Thailand, 3 villages in Laos o households 29 in Thailand, 158 in Laos o people c. 935 persons 39. Infrastructure inundated in reservoir o Paved roads (km) o Government buildings, o Hospitals, o Schools, o Temples etc. 40. Tourism and cultural sites lying in the inundation zone o Caves, waterfalls, historic sites o Cultural sites COSTS 41. Estimated cost of the dam (Million $) 3,000 million $ 42. Estimated environmental and social costs (million $) 35 million USD 52 I C E M


53 4.7.7 MAPS AND IMAGES Google earth Image 53 I C E M

54 54 I C E M

55 55 I C E M

56 Villages alongside Ban Koum reservoir 56 I C E M
57 57 I C E M
58 4.8 LAT SUA Source: Lat Sua Feasibility study, TEAM Consulting for Charoen Energy and Water Asia Co.Ltd MRC database figures shown in red where different OVERVIEW OF PROJECT 1. Name of Dam Lat Sua HPP 2. Location of preferred site option km km upstream of delta o Latitude 'N 15 1'31.38"N o Longitude 'E '6.23"E Feasibility study recommends Site 2 at km 3. Dam statistics a. Height, 27 m b. Length, 1,300 m c. Type of dam construction Concrete gravity 4. Please provide dam lay out if available N/A 5. Rated head (metres) 10.6 m (max) 3.0 m (min) 6. Plant discharge (cu.m/sec) 20 x 500 = Max flow 10,000 cu.m/sec 7. Number of Units 20 x 34.3 MW 8. Installed capacity (MW) 686 MW 9. Firm and secondary energy generated annually (gigawatt hrs) Primary 1,524 GWh/yr Secondary 318 GWh/yr Excess energy 826 GWh/yr 10. Mode of operation o continuous generation or peak load o if peak load, hours of operation per day o Primary energy over 16 hrs per day, o secondary energy for 2hrs per day on 6 days and 8 hrs on Sundays, o excess energy on 6hrs per day on 6 days 11. Environmental flow discharges, Q (cu.m/sec) Mean annual Q 5,559 (97.5 masl) Max observed flow 89,590 (104 masl) 12. Spillway design o open flow o gated spillway, 24 gates - Elevation 70 masl o dimensions 20 m wide x 25 m high 13. Max spillway design discharge and return period used 89,590 cu.m/sec (Tr=10,000 yrs) 58 I C E M
59 14. Estimated sediment load per year (million cu.m/year) 15. Mechanisms proposed for clearing sediment, how often might these be used? Sand flushing gates 16. Dimensions of bottom outlets, 17. Design discharge for bottom outlet (cu.m/sec) 18. Sediment flushing outlets - dimensions and design discharge PURPOSE 19. Proposed market for electricity, national (%) export (%) to which country? 10% Laos 90% Thailand 20. Multipurpose uses considered (if any) Navigation Irrigation 21. Details of irrigation, if being considered (Cu.m/s or area irrigated) Area proposed for irrigation on right bank = 730,000 ha 3 crops per year Feasibility study underway RESERVOIR Headpond type capable of being lowered to pass floods and bedload 22. Full Supply level of reservoir (masl) 97.5 masl 23. Low Supply level of reservoir (masl) 24. Minimum Downstream water level masl 25. Area inundated at FSL (sq. km) 26. Active volume of the reservoir (million.cu.m) 27. Dead storage volume of reservoir (million.cu.m) 28. Draw down (m) 2m 29. Expected daily fluctuations in level of reservoir (m) 2m 30. Length of reservoir (km) CONSTRUCTION 59 I C E M
60 Area of construction site 31. Duration of construction 8yrs First generation by 2015, assuming construction starts in Access roads required length (km) 33. Transmission line required length (km) To Thailand route not determined yet 34. Expected size of construction workforce, o skill types required o policy for local employment 35. Dimensions of navigation locks (if any) 1 lock capacity 500 tonnes 195 m long x 12 m wide x 3.2 m deep 36. Type and dimensions of fish passes (if any) 800 m long x 10 m wide x 3 m deep at slope of 5%. 4 fish entrances 10 m wide requires 1 5% of competing flow IMPACTS Total area of reservoir 87 sq km Mekong river and tributaries 70 sq km 80% Cultivated land 13 sq km 15% Mixed bamboo and secondary forest 4 sq km 5% 37. Total area of agricultural land inundated (ha) 1,325 ha o irrigated area inundated (ha) 332 ha o rainfed agriculture (ha) o slash and burn (ha) o Main crop types 38. Total Area of forest (ha) o types of forest cover inundated mixed bamboo and secondary forest 39. Number of communities, households and people to be resettled o Communities o households o people note for site 1 with 100 masl FSL 9 villages in Thailand, 2 villages in Lao were considered affected because they lay at or above 100 masl level and were likely to experience flooding. For site 2 with 97.5 masl FSL no villages are implicated, although flood protection measures will be taken for villages near Pakse at 98.5 masl (which is equivalent to flood magnitude of 15,000 cu.m/sec 40. Infrastructure inundated in reservoir o Paved roads (km) o Government buildings, 60 I C E M
 43. Estimated environmental and social costs (million $) 4.8.")
61 o Hospitals, o Schools, o Temples etc. 41. Tourism and cultural sites lying in the inundation zone o Caves, waterfalls, historic sites o Cultural sites COSTS 42. Estimated cost of the dam (Million $) 43. Estimated environmental and social costs (million $) MAPS AND IMAGES Google earth Image 61 I C E M


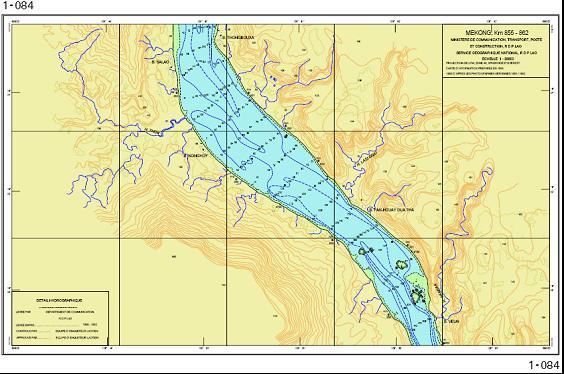
62 Hydrographic maps from Pakse to below dam site at km 62 I C E M

63 Dam site 63 I C E M
64 4.9 DON SAHONG Source: Don Sahong EIA (2007), Mega First Corporation, MRC Database OVERVIEW OF PROJECT 3. Name of Dam Don Sahong HPP 4. Location of preferred site option 722 km upstream of delta Original revised o Latitude 'N 13 56'37.88"N o Longitude 'E '22.59"E Note that according to Ministry of Mines and Energy, location has been moved to bottom end of Don Sahong channel 44. Dam statistics o Height, 10.6 m with two walls of 8.2/8.3 m extending into main channel at top end of Hou Sahong o Length, 720 m with walls along Hou Sahong 1,820 m and 2,730 m o Type of dam construction Rolled Concrete dam and walls 45. Please provide dam lay out if available 46. Rated head (metres) 17 m 47. Plant discharge (cu.m/sec) 2,400 cu.m/sec 48. Number of Units 4 x 60 MW 49. Installed capacity (MW) 240 MW 50. Firm and secondary energy generated annually (gigawatt hours) Mean - 2,375 GWh/yr Firm 1,988 GWh/yr 51. Mode of operation o continuous generation or peak load Continuous o if peak load, hours of operation per day 52. Environmental flow discharges, Q (cu.m/sec) for whole Mekong at Khone Phapheng Falls Mean annual Q 10,310 Min observed flow 1,068 Max observed flow 42, Spillway design No spillway o open flow o gated spillway, o dimensions 54. Max spillway design discharge and return period used 55. Estimated sediment load per year (million cu.m/year) 64 I C E M
65 56. Mechanisms proposed for clearing sediment, how often might these be used? Sand flushing gates 57. Dimensions of bottom outlets, 58. Design discharge for bottom outlet (cu.m/sec) 59. Sediment flushing outlets - dimensions and design discharge PURPOSE 60. Proposed market for electricity, national (%) 10% export (%) to which country? 90% Thailand 61. Multipurpose uses considered (if any) None 62. Details of irrigation, if being considered (Cu.m/s or area irrigated) None RESERVOIR Headpond type capable of being lowered to pass floods and bedload 63. Full Supply level of reservoir (masl) Low Supply level of reservoir (masl) Area inundated at FSL 290 ha 66. Active volume of the reservoir (million.cu.m) 115 MCM 67. Dead storage volume of reservoir (million.cu.m) 68. Draw down (m) 2.5 m 69. Expected daily fluctuations in level of reservoir (m) 70. Length of reservoir (km) 5 km CONSTRUCTION Area of construction site Embankments 12.8 ha 4.5 ha 71. Duration of construction 72. Access roads required length (km) 5.7 km on Don Sahong Barge depots 65 I C E M
66 73. Transmission line required length (km) km for 230 kva line to Ban Hat substation 74. Expected size of construction workforce, o skill types required o policy for local employment 75. Dimensions of navigation locks (if any) No navigation facility 76. Type and dimensions of fish passes (if any) Modifications to side channels and small fish pass to be constructed and trialed during construction IMPACTS Total area affected Total area of reservoir Mekong river and tributaries Island area flooded at 75 masl ha ha 92.6 ha 94.8 ha (right bank) ha (left bank) 77. Total area of agricultural land inundated (ha) 30.4 ha o irrigated area inundated (ha) o rainfed agriculture (ha) o slash and burn (ha) o Main crop types 78. Total Area of forest (ha) o types of forest cover inundated 79. Number of communities, households and people to be resettled o Communities o households 14 o people Infrastructure inundated in reservoir o Paved roads (km) o Government buildings, o Hospitals, o Schools, o Temples etc. 3 villages on 2 islands, 1 village on mainland 81. Tourism and cultural sites lying in the inundation zone o Caves, waterfalls, historic sites Near Khone Phapheng Falls possible impact upon flow of water over main falls o Cultural sites COSTS 82. Estimated cost of the dam (Million $) 66 I C E M
 4.9.")

67 83. Estimated environmental and social costs (million $) MAPS AND IMAGES Google earth Image Don Sahong dam site 67 I C E M


68 Dam site looking downstream Hou Sahong looking upstream from dam site 68 I C E M


69 Hou Sahong drilling rig for dam survey Top end of Hou Sahong 69 I C E M

70 Hou Xang Peuk channel to be modified for improving fish passage 70 I C E M
71 4.10 THAKHO HPP Source: Thakho IEE, prepared for CNR August OVERVIEW OF PROJECT 1. Name of Dam Thakho Diversion HPP 2. Location of preferred site option 722 km upstream of delta Intake Power house o Latitude 13 57'50.9"N 13 57'6.6"N o Longitude '15.3"E '20.2"E 3. Dam statistics No dam o Height, o Length, o Type of dam construction 4. Please provide dam lay out if available Intake structure located 300 m upstream of Khone Phapheng Falls 12 sluices 7.5 m wide total width 100m Headrace channel 1,700 m x 70 m width Power house located 500 m below Khone Phapheng Falls 5. Rated head (metres) 15.5 m 6. Plant discharge (cu.m/sec) 380 cu.m/sec 7. Number of Units 2 x 25 MW 8. Installed capacity (MW) 50 MW 9. Firm and secondary energy generated annually (gigawatt hours) Mean GWh/yr 10. Mode of operation o continuous generation or peak load o if peak load, hours of operation per day Continuous 11. Environmental flow discharges, Q (cu.m/sec) for whole Mekong at Khone Phapheng Falls Mean annual Q 10,310 Min observed flow 1,068 Max observed flow 42, Spillway design No spillway o open flow o gated spillway, 71 I C E M
72 o dimensions 13. Max spillway design discharge and return period used 14. Estimated sediment load per year (million cu.m/year) Not applicable 15. Mechanisms proposed for clearing sediment, how often might these be used? 16. Dimensions of bottom outlets, No bottom outlets 17. Design discharge for bottom outlet (cu.m/sec) 18. Sediment flushing outlets - dimensions and design discharge PURPOSE 19. Proposed market for electricity, national (%) 100% export (%) to which country? 0% 20. Multipurpose uses considered (if any) possible irrigation and water supply from channel under consideration 21. Details of irrigation, if being considered (Cu.m/s or area irrigated) RESERVOIR No Reservoir envisaged 22. Full Supply level of reservoir (masl) 71.7 masl (normal Mekong level at intake) 23. Low Supply level of reservoir (masl) 68.7 masl (min.operating level of Mekong 24. Area inundated at FSL (sq. km) 30 ha of land affected by intake, headrace channel, and power house out of 1,500 ha in the immediate locality 25. Active volume of the reservoir (million.cu.m) n/a 26. Dead storage volume of reservoir (million.cu.m) n/a 27. Draw down (m) n/a 28. Expected daily fluctuations in level of reservoir (m) n/a 29. Length of reservoir (km) n/a CONSTRUCTION 72 I C E M
73 Area of construction site 30. Duration of construction 31. Access roads required length (km) 2km Access road from Route Transmission line required length (km) 155 kva - 2 km to road then along road 20 km to Ban Hat sub-station 33. Expected size of construction workforce, o skill types required o policy for local employment 34. Dimensions of navigation locks (if any) No Navigation 35. Type and dimensions of fish passes (if any) Not required IMPACTS Total area of reservoir Total land area affected Cultivated land Secondary forest No reservoir 30.3 ha 13.5 ha 16.4 ha 36. Total area of agricultural land inundated (ha) 13.5 ha o irrigated area inundated (ha) o rainfed agriculture (ha) o slash and burn (ha) o Main crop types 37. Total Area of forest (ha) 16.4 ha o types of forest cover inundated secondary forest, dry dipterocarp and mixed deciduous 38. Number of communities, households and people to be resettled o Communities 0 o households 0 o people Infrastructure inundated in reservoir o Paved roads (km) o Government buildings, o Hospitals, o Schools, o Temples etc. 40. Tourism and cultural sites lying in the inundation zone o Caves, waterfalls, historic sites Water is diverted around Khone 73 I C E M
 $ 109 Million 42. Estimated environmental and social costs (million $) c. 2% of total investment costs 4.10.7 MAPS AND IMAGES Google earth Image with layout 74 I C E M")
74 o Cultural sites Phapheng Falls. Minimum dry season (c. 800 cu.m/sec) flows ensured over falls under operational rules COSTS 41. Estimated cost of the dam (Million $) $ 109 Million 42. Estimated environmental and social costs (million $) c. 2% of total investment costs MAPS AND IMAGES Google earth Image with layout 74 I C E M


75 View of Intake site looking downstream towards Khone Phapheng Falls Khone Phapheng Falls Location of Tailrace looking out to main channel of Mekong 75 I C E M

76 76 I C E M
77 4.11 STUNG TRENG Source: MRC database Note: very little detailed information is available on the Stung Treng HPP because there has been no feedback from Russian developers on the feasibility study OVERVIEW OF PROJECT 3. Name of Dam Stung Treng HPP 4. Location of preferred site option about 8 km upstream of Stung Treng o Latitude 13 34'31.13"N o Longitude '0.41"E (NB: location given in MRC database is incorrect) 43. Dam statistics o Height, 22 m o Length, 10,844 m o Type of dam construction Gravity, earth fill 44. Please provide dam lay out if available N/A 45. Rated head (metres) 15.2 m 46. Plant discharge (cu.m/sec) 18, Number of Units 10 x 98 MW 48. Installed capacity (MW) 978 MW Peaking capability 591 MW 49. Firm and secondary energy generated annually (gigawatt hours) Mean - 4,870 GWh/yr Firm 2,937 GWh/yr 50. Mode of operation o continuous generation or peak load Continuous o if peak load, hours of operation per day 51. Environmental flow discharges, Q (cu.m/sec) Nominal flow 8,000 Mean annual Q 13,714 Max flood 79, Spillway design N/a o open flow o gated spillway, o dimensions 53. Max spillway design discharge and return period used 73,500 cu.m/sec 77 I C E M
78 54. Estimated sediment load per year (million cu.m/year) N/a 55. Mechanisms proposed for clearing sediment, how often might these be used? 56. Dimensions of bottom outlets, N/a 57. Design discharge for bottom outlet (cu.m/sec) 58. Sediment flushing outlets - dimensions and design discharge PURPOSE 59. Proposed market for electricity, national (%) 10% export (%) to which country? 90% Vietnam 60. Multipurpose uses considered (if any) Navigation Irrigation Flood control 61. Details of irrigation, if being considered (Cu.m/s or area irrigated) N/a RESERVOIR 62. Full Supply level of reservoir (masl) 55 masl 63. Low Supply level of reservoir (masl) 50 masl 64. Area inundated at FSL (sq. km) 211 sq km 65. Active volume of the reservoir (million.cu.m) 70 MCM 66. Dead storage volume of reservoir (million.cu.m) 67. Draw down (m) 5 m 68. Expected daily fluctuations in level of reservoir (m) 2 m 69. Length of reservoir (km) 50 km CONSTRUCTION Area of construction site 70. Duration of construction 71. Access roads required length (km) 72. Transmission line required length (km) To Vietnam route not determined yet 78 I C E M
79 73. Expected size of construction workforce, o skill types required o policy for local employment 74. Dimensions of navigation locks (if any) N/a 75. Type and dimensions of fish passes (if any) N/a IMPACTS Total area of reservoir 211 sq km 76. Total area of agricultural land inundated (ha) N/a o irrigated area inundated (ha) o rainfed agriculture (ha) o slash and burn (ha) o Main crop types 77. Total Area of forest (ha) o types of forest cover inundated riverine forest 78. Number of communities, households and people to be resettled o Communities 21 villages o households 2,059 households o people 10,617 persons Note these figures are taken from estimates of people living in the Stung Treng Ramsar site 79. Infrastructure inundated in reservoir o Paved roads (km) o Government buildings, o Hospitals, o Schools, o Temples etc. 80. Tourism and cultural sites lying in the inundation zone o Caves, waterfalls, historic sites The whole reservoir area lies within the Stung Treng Ramsar site It has high biodiversity and high tourism potential o Cultural sites COSTS 81. Estimated cost of the dam (Million $) N/a 82. Estimated environmental and social costs (million $) 79 I C E M

80 MAPS AND IMAGES Google earth Image 80 I C E M

81 Map of the Stung Treng Ramsar Site 81 I C E M
82 Reservoir areas of Sambor and Stung Treng HPPs 82 I C E M
83 4.12 SAMBOR Source: Sambor Prefeasibility study by China Southern Grid Co Ltd. Cambodia MRC database figures shown in red where different OVERVIEW OF PROJECT 5. Name of Dam SAMBOR, Cambodia 6. Location of preferred site option o Latitude Dam site II 12 o 47 N ( N) o Longitude 105 o 57 E ( E) (Taken from Google earth picture of location from Chinese developers) 83. Dam statistics o Height, 56 m (35m) o Length, 18,002 m (30,664 m) o Type of dam construction Concrete gravity dam and earth rock fill dam 84. Please provide dam lay out if available 85. Rated head (metres) 16.5 ( m max and min) (32.9) 86. Plant discharge (cu.m/sec) x 40 = 17,668 (19,163) 87. Number of Units Installed capacity (MW) 65MW x 40 = 2,600 (3,300) 89. Firm and secondary energy generated annually (gigawatt hours) o Average annual energy 11,740 Gw.h (14,870) 90. Mode of operation o continuous generation or peak load Continuous? o if peak load, hours of operation per day Annual average 4515 hours = hrs.day 91. Environmental flow discharges (cu.m/sec) Continuous 92. Spillway design o open flow o gated spillway, 93. Max spillway design discharge and return period used (149,300 cu.m/sec) o Peak inflow (161,000 cu.m/sec) 94. Estimated sediment load per year (million cu.m/year) 95. Mechanisms proposed for clearing sediment, how often might these be used? 83 I C E M
84 96. Dimensions of bottom outlets, 97. Design discharge for bottom outlet (cu.m/sec) o Sediment flushing outlets o dimensions and design discharge 37 release sluices 15m x 20 m elevation, 159 cu.m/sec = 5,883 cu.m/sec PURPOSE 98. Proposed market for electricity, 7.1 national (%) 30% 8.1 export (%) to which country? 70% to Vietnam 99. Multipurpose uses considered (if any) Power, flood control and Navigation 100. Details of irrigation, if being considered (Cu.m/s or area irrigated) RESERVOIR 101. Full Supply level of reservoir (masl) 40 (40) 102. Low Supply level of reservoir (masl) 39 (38) 103. Area inundated at FSL (sq. km) Active volume of the reservoir (million.cu.m) 465 (2,000) 105. Storage Coefficient 0.108% 106. Dead storage volume of reservoir (million.cu.m) 3, Draw down (m) 1 m 108. Expected daily fluctuations in level of reservoir (m) small daily regulation, generating all the time, 109. Length of reservoir (km) CONSTRUCTION 110. Duration of construction 87 months 111. Access roads required length (km) 112. Transmission line required length (km) 3 x 260 km, 500 kv to HCMC 113. Expected size of construction workforce, Av 2700, max 3000 o skill types required o policy for local employment 84 I C E M
85 114. Dimensions of navigation locks (if any) 100 tonnes 481 m long, 8m wide from 40masl 16 masl 115. Type and dimensions of fish passes (if any) 3,397.8 m o Dolphin breeding farm included IMPACTS 116. Total area of agricultural land inundated (ha) 3,369 ha o irrigated area inundated (ha) o rainfed agriculture (ha) o slash and burn (ha) o Main crop types 117. Total Area of forest (ha) o types of forest cover inundated 13,143 ha 118. Number of communities, households and people to be resettled o communities o households o people 19,034 (5,120) 119. Infrastructure inundated in reservoir o House area o Paved roads (km) o Government buildings, o Hospitals, o Schools, o Temples etc. 24,351 sq m 120. Tourism and cultural sites lying in the inundation zone o Caves, waterfalls, historic sites o Cultural sites COSTS 121. Estimated cost of the dam (Million $) 4,947 M$ o Transmission line M$ 122. Estimated environmental and social costs (million $) 85 I C E M o Social including resettlement M$ but note that this was based on 10,000 people for resettlement, so will probably be double this o Environmental M$ o Cost/KW 1,685 $/KW o Cost/kwh $/KWh


86 o Online tariff cents/kwh o IRR 13.0% o Loan agreement 25 years MAPS AND FIGURES Dam location on Google Earth 86 I C E M

87 Reservoir areas of Sambor and Stung Treng HPPs 87 I C E M