FINAL DRAINAGE REPORT FALLBROOK FILING NO. 3 Thornton, CO
|
|
|
- Bethany Webb
- 5 years ago
- Views:
Transcription
1 FINAL DRAINAGE REPORT FALLBROOK FILING NO. 3 Thornton, CO May 6, 2016 JN: Prepared for: Carlson Associates CalAtlantic Homes PO Box S. Syracuse Way, Suite 200 Eastlake, CO Greenwood Village, CO P: P: Prepared by: Jansen Strawn Consulting Engineers 45 W. 2nd Avenue Denver, CO P: F: Thomas C. Jansen, PE No Principal solutions. partnerships. success. t f West 2nd Avenue, Denver, Colorado
2 Fallbrook Filing No. 3 February 15, 2016 Page 2 CERTIFICATION I hereby affirm that this report and plan for the Fallbrook Filing No. 3 Subdivision was prepared by me, or under my direct supervision, for the owners thereof, in accordance with the provisions of the City of Thornton Standards and Specifications for the Design and Construction of Public and Private Improvements for the Responsible Parties thereof. I understand that the City of Thornton does not and will not assume liability for drainage facilities designed by others. Thomas C. Jansen, PE State of Colorado Registration No For and on behalf of Jansen Strawn Consulting Engineers, Inc. Date t f West 2 nd Avenue, Denver, Colorado
3 Fallbrook Filing No. 3 February 15, 2016 Page 3 T A B L E O F C O N T E N T S I. GENERAL LOCATION AND DESCRIPTION... 4 II. DRAINAGE BASINS AND SUB BASINS... 5 III. DRAINAGE FACILITY DESIGN... 6 IV. STORMWATER MANAGEMENT FACILITY DESIGN... 8 V. CONCLUSION VI. REFERENCES A P P E N D I C E S APPENDIX A Basin Hydrology % Impervious Calculations C Values Calculations SF2 & SF3 Rational Method Calculations APPENDIX B Hydraulics Detention Pond Analysis Street Capacity Calculations Inlet Calculations Storm Sewer Design APPENDIX C Reference Materials Effective FEMA Map Panels NRCS Soil Information APPENDIX D Maps Historic Basin Map Developed Basin Map t f West 2 nd Avenue, Denver, Colorado

4 Fallbrook Filing No. 3 February 15, 2016 Page 4 I. GENERAL LOCATION AND DESCRIPTION The purpose of this report is to define and analyze developed runoff quantities and conveyance through the Fallbrook Filing No. 3 development. Runoff from this proposed development will be directed to a stormwater detention pond which will be located on the western portion of the site. A. Site Location The project site is located in the north half of Section 24, Township 1 North, Range 68 West of the Sixth Principal Meridian, County of Adams, Colorado. Portions of the site are bounded by Colorado Boulevard to east and E. 140 th Avenue to the south. Adjacent developments to the site include Fallbrook Subdivision, Filing No. 1 to the west, Cherrywood Park Subdivision, Filing No. 1 to the south, and the Thornton Fire Department Station 5 to the southeast. See the below vicinity map for reference. t f West 2 nd Avenue, Denver, Colorado
5 Fallbrook Filing No. 3 February 15, 2016 Page 5 There are no major drainageways/floodplains, wetlands or irrigation ditches located on the site, although Signal Ditch (irrigation ditch) does pass by just outside the property boundary to the northwest. B. Description of Property The Fallbrook Filing No. 3 was platted as Tract K of Fallbrook Filing No. 1 for 140 th and Colorado, LLC. II. DRAINAGE BASINS AND SUB BASINS A. Major Drainage Basins The project site lies within the Big Dry Creek watershed and is also located within the study area of an Outfall Systems Plan (OSP) titled Outfall Systems Planning North Area Tributaries Big Dry Creek (ADCO) prepared by Wright Water Engineers, Inc. This OSP was previously utilized during the design of the adjacent Fallbrook Subdivision, Filing No. 1 (MMcEngineering, Inc.) and a storm sewer stub was designed and installed as a tie in connection point for the detention pond outlet structure from this current development. As mentioned previously, there are no FEMA floodplains on the site. According to the Flood Insurance Rate Map 08001C0304H, the entire site is within Zone X, which is an area that is determined to be outside of the 500 year floodplain. Refer to Appendix C for the appropriate Flood Insurance Rate Map panel. The USCS Soil Survey indicates that the site is underlain by soils which are part of the hydrologic soil group C. Hydrologic soil group C soils are identified as soils having a slow infiltration rate when thoroughly wetted and consisting mostly of soils with a layer that impedes downward movement of water or soils with moderately fine to fine texture. Refer to Appendix C for an excerpt from the NRCS Soils Report for the site. B. Sub Basin Description The site, which lies within the Big Dry Creek watershed, will drain to the proposed detention pond located on the western portion of the site. The outlet structure for the proposed t f West 2 nd Avenue, Denver, Colorado
6 Fallbrook Filing No. 3 February 15, 2016 Page 6 detention basin will tie into a pre existing storm sewer stub which was designed in anticipation of this proposed development. III. DRAINAGE FACILITY DESIGN A. Regulations Stormwater conveyance and detention facilities for this project were designed in conformance with the City of Thornton Standards and Specifications and the Urban Drainage Flood Control District (UDFCD) Urban Storm Drainage Criteria Manual (UDSCM), Volumes 1, 2, and 3. B. Drainage Studies, Outfall Systems Plans, Site Constraints As previously mentioned, the project site lies within the Big Dry Creek watershed and is also located within the study area of an Outfall Systems Plan (OSP) titled Outfall Systems Planning North Area Tributaries Big Dry Creek (ADCO) prepared by Wright Water Engineers, Inc. This OSP was previously utilized during the design of the adjacent Fallbrook Subdivision, Filing No. 1 (MMcEngineering, Inc.) and a storm sewer stub was designed and installed as a tie in connection point for the detention pond outlet structure from this current development. C. Hydrology The minor and major storm frequencies for design are the 5 year and 100 year storm events, respectively. The one hour point rainfall for the 5 year event is 1.38 inches and 2.69 inches for the 100 year event. The peak discharge for sizing the onsite storm sewer and for the street capacity calculations was calculated using the following Rational Method formula: Q=CIA Where: Q = peak discharge (cfs) C = runoff coefficient I = rainfall intensity (inches/hour) A = drainage area (acres) t f West 2 nd Avenue, Denver, Colorado
7 Fallbrook Filing No. 3 February 15, 2016 Page 7 See Appendix A for Rational Method flow calculations. The UDFCD SF 3 form was used to determine peak flows at respective design points. D. Hydraulics Street and alleys for the proposed development have been designed in accordance with City of Thornton Standards. Street and alley capacity calculations for the proposed development are provided in Appendix B of this report. Inlets have been designed throughout the site to capture runoff from the streets before maximum allowable street and alley capacities are exceeded and at sump locations. Inlet calculations have been prepared for the site using the Urban Drainage and Flood Control District UD Inlet_V2.03.xls spreadsheet. Inlet capture calculations are provided in Appendix B of this report. Proposed storm sewers have been designed in accordance with the City of Thornton Standards. Hydraflow Storm Sewers extension for Autodesk AutoCAD Civil 3D was utilized to perform hydraulic computations on the proposed storm sewer, including the calculation of hydraulic grade lines. Hydraflow Storm Sewers output for the proposed storm sewer, including profiles with hydraulic grade lines, is included in Appendix B. Riprap for the pipe outlet into the proposed detention pond was sized and designed in accordance with UDFCD USDCM Volume 1, Section 7 (Major Drainage) criteria. E. Water Quality Enhancement Because the full spectrum detention method is being used for this project, the water quality capture volume (WQCV) is included as part of the Excess Urban Runoff Volume (EURV). F. Detention As required by the City of Thornton, the stormwater detention pond was designed using the full spectrum detention method which is detailed in the UDFCD UDSCM. This method includes providing storage for the EURV and 100 year detention volume. An outlet structure was designed to release the EURV over a period of 72 hours and to release the 100 year detention volume at a rate of 1 cfs/acre. As discussed with the City of Thornton, an emergency spillway capable of discharging the 100 year peak flow (with 1 foot of freeboard) was designed for the detention pond. t f West 2 nd Avenue, Denver, Colorado
8 Fallbrook Filing No. 3 February 15, 2016 Page 8 IV. STORMWATER MANAGEMENT FACILITY DESIGN A. General Concept Generally speaking, stormwater runoff from the residential areas will sheet flow to nearby streets or alleys. The runoff will then be captured by storm sewer inlets and conveyed to the detention pond. B. Specific Details The Fallbrook Filing No. 3 development consists of the construction of multi family residential homes on 56 lots. The site is approximately acres. The residential density for the site is computed based on the area of the site that will be developed for residential purposes, which excludes streets, sidewalks, and open space. Each lot was estimated to have an imperviousness of approximately 60%. C values were then obtained using UDFCD USDCM based on that imperviousness percentage. Proposed drainage basins will generally follow historic drainage patterns. Basin A1 drains to an existing inlet located in Colorado Boulevard (at DP 1). Previously, this inlet discharged runoff as overland flow through the site. In the developed condition, this inlet will be connected to the proposed storm sewer network which conveys stormwater to the proposed detention pond. Basin A2 drains to a proposed CDOT Type R inlet (sump) located in Street B (at DP 2) which conveys stormwater to the proposed detention pond. Should this inlet become clogged, the overflow path will be through Tract F to Street A. Basin A3 drains to a proposed Denver No. 16 valley inlet (sump) located in Alley D (at DP 3) which conveys stormwater to the proposed detention pond. Should this inlet become clogged, the overflow path will be through Tract F to Street A. Basin A4 1 drains to a proposed CDOT Type R inlet (sump) located in Street A (at DP 4 1) which conveys stormwater to the proposed detention pond. Should this inlet become clogged, the overflow path will be through Tract H and into the pond. Basin A4 2 drains to a proposed CDOT Type R inlet (sump) located in Street A (at DP 4 2) which conveys stormwater to the proposed detention pond. Should this inlet become t f West 2 nd Avenue, Denver, Colorado
9 Fallbrook Filing No. 3 February 15, 2016 Page 9 clogged, the overflow path will be through the open space/park area to the south and into the pond. Basin A5 drains to a proposed CDOT Type R inlet (sump) located in Street B (at DP 5) which conveys stormwater to the proposed detention pond. Should this inlet become clogged, the overflow path will be through Tract F to Street A. Basin A6 1 drains to a proposed CDOT Type 13 valley inlet (on grade) located in Alley D (at DP 6 1) which conveys stormwater to the proposed detention pond. Basin A6 2 drains to a proposed CDOT Type R inlet (on grade) located in Street C (at DP 6 2) which conveys stormwater to the proposed detention pond. Basin A7 1 drains to a proposed CDOT Type 13 valley inlet (on grade) located in Alley T (at DP 7 1) which conveys stormwater to the proposed detention pond. Basin A7 2 drains to a proposed CDOT Type R inlet (on grade) located in Street C (at DP 7 2) which conveys stormwater to the proposed detention pond. Basin A8 drains to a proposed CDOT Type R inlet (partial sump due to speed table) located in Street A (at DP 8 3) which conveys stormwater to the proposed detention pond. Should this inlet become clogged, the overflow path will be over the speed table to the inlet located at DP 4 2. Basin A9 drains to a proposed CDOT Type R inlet (partial sump due to speed table) located in Street A (at DP 9) which conveys stormwater to the proposed detention pond. Should this inlet become clogged, the overflow path will be over the speed table to the inlet located at DP Basin A10 1 drains to a proposed CDOT Type R inlet (sump) located in Street A (at DP 10 1) which conveys stormwater to the proposed detention pond. Should this inlet become clogged, the overflow path will be through Tract H and into the pond. Basin A10 2 drains to a proposed CDOT Type R inlet (sump) located in Street A (at DP 10 2) which conveys stormwater to the proposed detention pond. Should this inlet become clogged, the overflow path will be through the open space/park area to the south and into the pond. t f West 2 nd Avenue, Denver, Colorado
10 Fallbrook Filing No. 3 February 15, 2016 Page 10 Basin A11 drains overland directly into the proposed detention pond. Basins B1 and B2 are located along the perimeter of the north end of the project site and will leave the site undetained. The existing swale which runs along the property line (in Basin B1) will be improved so that it has sufficient capacity to carry the flow. The total undetained flow from Basins B1 and B2 will be less than the historic peak discharge from the site. Calculations showing this can be found in Appendix A of this report. C. Full Spectrum Detention Onsite stormwater quality and detention for the proposed development will be provided using the Urban Drainage and Flood Control District (UDFCD) methods and calculations for full spectrum detention. Full spectrum detention includes providing a 72 hour release for the Excess Urban Runoff Volume (EURV) and providing detention and release controls to limit the 100 year discharge for the site. Required EURV and 100 year detention volumes and release rates have been determined for this site using the UD_Detention_2.2.xls spreadsheet from UDFCD, which utilizes Equation SO 13 from the Storage section of UDFCD USDCM Volume 2 to determine the required EURV. The proposed pond utilizes an orifice plate that has been sized in accordance with UDFCD criteria for hole spacing and hole size for the required EURV. This plate is affixed to the front of the outlet structure, behind a well screen trash rack. The outlet structure, which is covered with a grate, and passes through a restrictor plate that has been designed to restrict the outflow from the pond. The basin has been designed with an all weather maintenance access road that is 8 feet wide with a maximum longitudinal slope of 7 percent that consists of Class 6 road base material with filter fabric. The maintenance access is provided from Street A (and through the park) and will provide access to the front of the outlet structure in the bottom of the pond. The maintenance of the proposed detention pond will be the responsibility of the homeowners association or metropolitan district. Drainage easements have been dedicated by plat for the proposed pond. The proposed pond has been designed with a EURV storage of 1.12 acre feet and a total 100 year storage volume of 2.02 acre feet which includes the 0.46 acre feet of water quality t f West 2 nd Avenue, Denver, Colorado
11 Fallbrook Filing No. 3 February 15, 2016 Page 11 volume. The EURV water surface elevation is feet and the 100 year storage volume of the pond has a water surface elevation of feet (1.52 feet below top of berm). V. CONCLUSION This drainage report has been prepared in conformance with the City of Thornton Standards and Specifications, and the UDFCD Urban Storm Drainage Criteria Manual. The proposed drainage facilities have been designed to safely convey the runoff from design storm events to adequate outfall locations. VI. REFERENCES 1. City of Thornton Standards and Specifications, Section 400 Storm Drainage Design, Grading, and Water Quality Technical Criteria, City of Thornton, Revised October Urban Storm Drainage Criteria Manual, volumes 1, 2, and 3, Urban Drainage and Flood Control District, June 2001, with updates to December Natural Resources Conservation Center Web Soil Survey, United States Department of Agriculture, site visited July 16, Federal Emergency Management Agency Flood Insurance Rate Map, Community Panel Number 08001C0304H, Map Revised March 5, Outfall Systems Planning North Area Tributaries Big Dry Creek, Wright Water Engineers Inc., November t f West 2 nd Avenue, Denver, Colorado
12 APPENDIX A Basin Hydrology Time of Concentration C Values Calculations SF2 & SF3 Calculations t f West 2 nd Avenue, Denver, Colorado
13 Calculated By: JMP STANDARD FORM SF-2 Project: Fallbrook Date: 4/29/2016 TIME OF CONCENTRATION SUMMARY Job No.: Checked By: SUB-BASIN INITIAL/OVERLAND TRAVEL TIME t c CHECK FINAL DATA TIME (t i ) (t t ) (URBANIZED BASINS) t c DESIG: C 5 AREA LENGTH SLOPE t i LENGTH SLOPE VEL. t t COMP. TOT. LENGTH tc=(l/180)+10 Ac Ft % Min Ft Cv % FPS Min t c Ft Min Min (1) (2) (3) (4) (5) (6) (7) (8) (9) (10) (11) (12) (13) (14) A A A A A A A A A A A , , A A A A A B B REMARKS JANSEN STRAWN TOC 5/2/ _SF2 SF3 - DEVELOPED.xlsx
14 PROJECT: Fallbrook JOB NO.: CALC. BY: JMP DATE: 04/29/16 Impervious Percentages - from UDFCD Urban Storm Drainage Criteria Manual C-Values Based on Frequency (yrs) % Imp RESIDENTIAL 60% ASPHALT 100% CONCRETE 90% LANDSCAPE 0% SOIL TYPE: C or D PROPOSED COMPOSITE IMPERVIOUSNESS Areas (ac) Weighted Impervious and C Values Basin Area (ac) RESIDENTIAL ASPHALT CONCRETE LANDSCAPE Imp. C 2 C 5 C 10 C 100 A % A % A % A % A % A % A % A % A % A % A % A % A % A % A % A % Detained Areas Total % B % B % Undetained Areas Total % Drainage Study Total JANSEN STRAWN COMPOSITE C VALUES - PROP 5/2/ _SF2 SF3 - DEVELOPED.xlsx
15 Calculated By: JMP STANDARD FORM SF-3 Project: Fallbrook Date: 4/29/2016 STORM DRAINAGE SYSTEM DESIGN Job No.: Checked By: (RATIONAL METHOD PROCEDURE) Design Storm: 2-YR 2-yr, 1-hour rainfall= 0.97 BASIN DESIGN POINT AREA DESIGN AREA (AC) DIRECT RUNOFF TOTAL RUNOFF STREET RUNOFF COEFF t c (MIN) C * A (AC) I (IN/HR) Q (CFS) t c (MIN) S (C * A) (CA) I (IN/HR) Q (CFS) SLOPE (%) (2) (3) (4) (5) (6) (7) (8) (9) (10) (11) (12) (13) (14) (15) (16) (17) (18) (19) (20) (21) (22) A To existing inlet at DP 1 (on-grade) A To proposed inlet at DP 2 (sump) A To proposed inlet at DP 3 (sump) A To proposed inlet at DP 4-1 (sump) A To proposed inlet at DP 4-2 (sump) A To proposed inlet at DP 5 (sump) A To proposed inlet at DP 6-1 (on-grade) A To proposed inlet at DP 6-2 (on-grade) A To proposed inlet at DP 7-1 (on-grade) A To proposed inlet at DP 7-2 (on-grade) A To proposed inlet at DP 8 (partial sump) A To proposed inlet at DP 9 (partial sump) A To proposed inlet at DP 10-1 (sump) A To proposed inlet at DP 10-2 (sump) A To proposed detention pond at DP 11 A To proposed inlet at DP 9 STREET FLOW DESIGN FLOW (CFS) PIPE SLOPE (%) PIPE DIAM. (IN.) LENGTH (FT) VELOCITY (FPS) t t (MIN) REMARKS B1 B Undetained B2 B Undetained JANSEN STRAWN 2-YEAR 5/4/ _SF2 SF3 - DEVELOPED.xlsx
16 Calculated By: JMP STANDARD FORM SF-3 Project: Fallbrook Date: 4/29/2016 STORM DRAINAGE SYSTEM DESIGN Job No.: Checked By: (RATIONAL METHOD PROCEDURE) Design Storm: 5-YR 5-yr, 1-hour rainfall= 1.38 DIRECT RUNOFF TOTAL RUNOFF STREET PIPE BASIN DESIGN POINT AREA DESIGN AREA (AC) RUNOFF COEFF t c (MIN) C * A (AC) I (IN/HR) Q (CFS) t c (MIN) S (C * A) (CA) I (IN/HR) Q (CFS) SLOPE (%) STREET FLOW DESIGN FLOW (CFS) SLOPE (%) PIPE DIAM. (IN.) LENGTH (FT) VELOCITY (FPS) t t (MIN) REMARKS (2) (3) (4) (5) (6) (7) (8) (9) (10) (11) (12) (13) (14) (15) (16) (17) (18) (19) (20) (21) (22) A To existing inlet at DP 1 (on-grade) A To proposed inlet at DP 2 (sump) A To proposed inlet at DP 3 (sump) A To proposed inlet at DP 4-1 (sump) A To proposed inlet at DP 4-2 (sump) A To proposed inlet at DP 5 (sump) A To proposed inlet at DP 6-1 (on-grade) A To proposed inlet at DP 6-2 (on-grade) A To proposed inlet at DP 7-1 (on-grade) A To proposed inlet at DP 7-2 (on-grade) A To proposed inlet at DP 8 (partial sump) A To proposed inlet at DP 9 (partial sump) A To proposed inlet at DP 10-1 (sump) A To proposed inlet at DP 10-2 (sump) A To proposed detention pond at DP 11 A To proposed inlet at DP 9 B1 B Undetained B2 B Undetained JANSEN STRAWN 5-YEAR 5/4/ _SF2 SF3 - DEVELOPED.xlsx
17 Calculated By: JMP STANDARD FORM SF-3 Project: Fallbrook Date: 4/29/2016 STORM DRAINAGE SYSTEM DESIGN Job No.: Checked By: (RATIONAL METHOD PROCEDURE) Design Storm: 100-YR 100-yr, 1-hour rainfall= 2.69 BASIN DESIGN POINT AREA DESIGN AREA (AC) DIRECT RUNOFF TOTAL RUNOFF STREET RUNOFF COEFF t c (MIN) C * A (AC) I (IN/HR) Q (CFS) t c (MIN) S (C * A) (CA) I (IN/HR) Q (CFS) SLOPE (%) (2) (3) (4) (5) (6) (7) (8) (9) (10) (11) (12) (13) (14) (15) (16) (17) (18) (19) (20) (21) (22) A To existing inlet at DP 1 (on-grade) A To proposed inlet at DP 2 (sump) A To proposed inlet at DP 3 (sump) A To proposed inlet at DP 4-1 (sump) A To proposed inlet at DP 4-2 (sump) A To proposed inlet at DP 5 (sump) A To proposed inlet at DP 6-1 (on-grade) A To proposed inlet at DP 6-2 (on-grade) A To proposed inlet at DP 7-1 (on-grade) A To proposed inlet at DP 7-2 (on-grade) A To proposed inlet at DP 8 (partial sump) A To proposed inlet at DP 9 (partial sump) A To proposed inlet at DP 10-1 (sump) A To proposed inlet at DP 10-2 (sump) A To proposed detention pond at DP 11 A To proposed inlet at DP 9 STREET FLOW DESIGN FLOW (CFS) PIPE SLOPE (%) PIPE DIAM. (IN.) LENGTH (FT) VELOCITY (FPS) t t (MIN) REMARKS B1 B Undetained B2 B Undetained JANSEN STRAWN 100-YEAR 5/4/ _SF2 SF3 - DEVELOPED.xlsx
18 Inlet at: Receiving bypass flow from inlet at: 5 yr flow bypassed 100 yr flow bypassed DP 6 2 DP DP 4 1 DP DP 7 2 DP DP 4 2 DP 7 2 & DP 10 2 DP
19 APPENDIX B Hydraulics Detention Pond Analysis Street Capacity Calculations Inlet Calculations Storm Sewer Design t f West 2 nd Avenue, Denver, Colorado
20 DETENTION VOLUME BY THE FULL SPECTRUM METHOD Project: Fallbrook 3 Basin ID: Total Site Area of Watershed (acres) Subwatershed Imperviousness Level of Minimizing Directly Connected Impervious Area (MDCIA) Effective Imperviousness 1 Hydrologic Soil Type Type A Type B Type C or D % % Percentage of Area Area (acres) 0.0% % % 21.6 * User input data shown in blue. Excess Urban Runoff Volume year Detention Volume Including WQCV Recommended Horton's Equation Parameters for CUHP Infiltration (inches per hour) Decay Initial--f i Final--fo Coefficient Detention Volumes 2,5 Maximum Allowable (watershed inches) (acre-feet) Release Rate, cfs Design Oulet to Empty EURV in 72 Hours yr Vol Type A Soil Runoff Voume - Inches yr Vol Type B, C & D Soils EURV Type A Soil EURV Type B Soil EURV Type C/D Soil 100-yr Storage Volume 0.50 EURV Storage Volume Percent Total Imperviousness Notes: 1) Effective imperviousness is based on Figure ND-1 of the Urban Storm Drainage Criteria Manual (USDCM). 2) Results shown reflect runoff reduction from Level 1 or 2 MDCIA and are plotted at the watershed's total imperviousness value; the impact of MDCIA is reflected by the results being below the curves. 3) Maximum allowable release rates for 100-year event are based on Table SO-1. Outlet for the Excess Urban Runoff Volume (EURV) to be designed to empty out the EURV in 72 hours. Outlet design is similar to one for the WQCV outlet of an extended detention basin (i.e., perforated plate with a micro-pool) and extends to top of EURV water surface elevation. 4) EURV approximates the difference between developed and pre-developed runoff volume. 5) 100-yr detention volume includes EURV. No need to add more volume for WQCV or EURV UD-Detention_v xls 8/11/2015, 5:32 PM
21 PROJECT : Fallbrook 3 DATE : 4/28/2016 PROJECT NO. : BY : DFA Pond - EURV / Detention Calculations Required Volume Tributary Area (ac) % Impervious % WQCV = 0.46 ac-ft ( WQCV = 1.2*A*(0.91i i i)/12 ) WQCV = 20,146 cu-ft EURV = 1.12 ac-ft ( EURV = 1.1*(1.1381*i )/12*A, INCLUDES WQCV ) EURV = 48,987 cu-ft 100-yr Detention = 2.04 ac-ft ( V 100 = (1.78*I-0.002*I )/900 * A ) 100-yr Detention = 88,826 cu-ft Total Required Volume = 2.04 ac-ft (V100) = 88,826 cu-ft Max Allowable Release Rate Q 100 = cfs Provided Volume Contour Elevation Ft 2 (A1A2) 1/2 ) D Total Volume (ft 3 ) Total Volume (ac-ft) 1/3 (A1 + A ,414 4,653 4, ,255 16,536 21, ,716 24,936 46, ,685 29,188 75, ,019 15,922 91, WSEL Depth (ft) WQCV = EURV = yr = JANSEN STRAWN CONSULTING ENGINEERS 45 West 2nd Ave. - Denver, CO p: f:
22 PROJECT : Fallbrook 3 DATE : 2/9/2016 PROJECT NO. : BY : JMP Pond - Grate Capacity Calculations A. Verify grate can pass the allowable 100 year storm release: Q 100 = cfs Determine the area necessary to pass the required flow through grate: A = Q / (C*(2GH) 1/2 ) Q: cfs C: 0.65 G: 32.2 ft/s 2 H: 1.33 ft A open = 3.40 ft 2 (Required) Try: CDOT Close Mesh Grate Grate size: (L*W) 3.00 X 3.50 ft Custom outlet structure Area of grate = Ft 2 Area of grate open to flow = 70% Area** 3.68 Ft 2 > 3.40 Ft 2 Grate can pass the required flow ** 50% reduction of the open area of the inlet has been applied for a clogging factor JANSEN STRAWN CONSULTING ENGINEERS 45 West 2nd Ave. Denver, CO p: f:
23 PROJECT : Fallbrook 3 DATE : 2/9/2016 PROJECT NO. : BY : JMP Pond Year Outlet Box Control 100 yr WSEL = " INV OUT = Try Orifice Release: Orifice Equation => Q=Cd*A*(2*g*h) 0.5 Q 100 = cfs Cd = 0.82 D = in (orifice Diameter) D = 1.35 ft (orifice Diameter) A = 1.44 g = h = 4.48 Q Release = cfs USE: in orifice JANSEN STRAWN CONSULTING ENGINEERS 45 West 2nd Ave. Denver, CO p: f:
24 STAGE-DISCHARGE SIZING OF THE WATER QUALITY CAPTURE VOLUME (WQCV) OUTLET Project: Fallbrook Basin ID: Total Site WQCV Design Volume (Input): Catchment Imperviousness, Ia = 53.0 percent Catchment Area, A = acres Diameter of holes, D = inches Depth at WQCV outlet above lowest perforation, H = 3 feet Number of holes per row, N = 1 Vertical distance between rows, h = 4.00 inches OR Number of rows, NL = 8.00 Orifice discharge coefficient, Co = 0.60 Height of slot, H = inches Slope of Basin Trickle Channel, S = ft / ft Width of slot, W = inches Time to Drain the Pond = 72 hours Watershed Design Information (Input): 2.67 Percent Soil Type A = 0 % Percent Soil Type B = 0 % Percent Soil Type C/D = 100 % Outlet Design Information (Output): Excess Urban Runoff Volume (From 'Full-Spectrum Sheet') watershed inches X N/A 0.00 Excess Urban Runoff Volume (From 'Full-Spectrum Sheet') acre-feet Outlet area per row, Ao = 1.30 square inches Total opening area at each row based on user-input above, Ao = 1.56 square inches Total opening area at each row based on user-input above, Ao = square feet 3 Central Elevations of Rows of Holes in feet Row 1 Row 2 Row 3 Row 4 Row 5 Row 6 Row 7 Row 8 Row 9 Row 10 Row 11 Row 12 Row 13 Row 14 Row 15 Row 16 Row 17 Row 18 Row 19 Row 20 Row 21 Row 22 Row 23 Row Flow Collection Capacity for Each Row of Holes in cfs #N/A #N/A #N/A #N/A #N/A #N/A #N/A #N/A #N/A #N/A #N/A #N/A #N/A #N/A #N/A #N/A #N/A #N/A #N/A #N/A #N/A #N/A #N/A #N/A #N/A #N/A #N/A #N/A #N/A #N/A #N/A #N/A #N/A #N/A #N/A #N/A #N/A #N/A #N/A #N/A #N/A #N/A #N/A #N/A #N/A #N/A #N/A #N/A #N/A #N/A #N/A #N/A #N/A #N/A #N/A #N/A #N/A #N/A #N/A #N/A #N/A #N/A #N/A #N/A #N/A #N/A #N/A #N/A #N/A #N/A #N/A #N/A #N/A #N/A #N/A #N/A #N/A #N/A #N/A #N/A #N/A #N/A #N/A #N/A #N/A #N/A #N/A #N/A #N/A #N/A #N/A #N/A #N/A #N/A #N/A #N/A #N/A #N/A #N/A #N/A #N/A #N/A #N/A #N/A #N/A #N/A #N/A #N/A #N/A #N/A #N/A #N/A #N/A #N/A #N/A #N/A #N/A #N/A #N/A #N/A #N/A #N/A #N/A #N/A #N/A #N/A #N/A #N/A #N/A #N/A #N/A #N/A #N/A #N/A #N/A #N/A #N/A #N/A #N/A #N/A #N/A #N/A #N/A #N/A #N/A #N/A #N/A #N/A #N/A #N/A #N/A #N/A #N/A #N/A #N/A #N/A #N/A #N/A #N/A #N/A #N/A #N/A #N/A #N/A #N/A #N/A #N/A #N/A #N/A #N/A #N/A #N/A #N/A #N/A #N/A #N/A #N/A #N/A #N/A #N/A #N/A #N/A #N/A #N/A #N/A #N/A #N/A #N/A #N/A #N/A #N/A #N/A #N/A #N/A #N/A #N/A #N/A #N/A #N/A #N/A #N/A #N/A #N/A #N/A #N/A #N/A #N/A #N/A #N/A #N/A #N/A #N/A #N/A #N/A #N/A #N/A #N/A #N/A #N/A #N/A #N/A #N/A #N/A #N/A #N/A #N/A #N/A #N/A #N/A #N/A #N/A #N/A #N/A #N/A #N/A #N/A #N/A #N/A #N/A #N/A #N/A #N/A #N/A #N/A #N/A #N/A #N/A #N/A #N/A #N/A #N/A #N/A #N/A #N/A #N/A #N/A #N/A #N/A #N/A #N/A #N/A #N/A #N/A #N/A #N/A #N/A #N/A #N/A #N/A #N/A #N/A #N/A #N/A #N/A #N/A #N/A #N/A #N/A #N/A #N/A #N/A #N/A #N/A #N/A #N/A #N/A #N/A #N/A #N/A #N/A #N/A #N/A #N/A #N/A #N/A #N/A #N/A #N/A #N/A #N/A #N/A #N/A #N/A #N/A #N/A #N/A Override Area Row 1 Override Area Row 2 Override Area Row 3 Override Area Row 4 Override Area Row 5 Override Area Row 6 Override Area Row 7 Override Area Row 8 Override Area Row 9 Override Area Row 10 Override Area Row 11 Override Area Row 12 Override Area Row 13 Override Area Row 14 Override Area Row 15 Override Area Row 16 Override Area Row 17 Override Area Row 18 Override Area Row 19 Override Area Row 20 Override Area Row 21 Override Area Row 22 Override Area Row 23 Override Area Row 24 UD-Detention_v xls, WQCV 2/12/2016, 8:09 AM
25 STAGE-DISCHARGE SIZING OF THE WATER QUALITY CAPTURE VOLUME (WQCV) OUTLET Worksheet Protected Project: Fallbrook Basin ID: Total Site STAGE-DISCHARGE CURVE FOR THE WQCV OUTLET STRUCTURE Stage (feet, elev.) Discharge (cfs) UD-Detention_v xls, WQCV 2/12/2016, 8:09 AM
26 PROJECT: Fallbrook JOB NO.: CALC. BY: JMP DATE: 12/8/2015 = FORMULA CELLS pipe outlet DP Q(100) pipe size or curb opening (FT) Velocity Qfull Q/Qfull or A/Afull d/d (1) design depth (d) Pd - riprap design parameter Riprap Type riprap size (D50) (2) minimum depth (inches) width (ft) length (ft) cutoff wall depth (FT) DP L Note: All riprap calculations determined from Urban Drainage and Flood Control District Drainage Criteria Manual Volume 2 (1) - determined from Figure HS-20a (2) - determined from Figure HS-20c - Min. 12-inch riprap will be utilized
27 DRAINAGE CRITERIA MANUAL (V. 2) HYDRAULIC STRUCTURES Figure HS-20a Low Tailwater Riprap Basins for Storm Sewer Pipe Outlets Discharge and Flow Area Relationships for Circular and Rectangular Pipes (Ratios for Flow Based on Manning s n Varying With Depth) (Stevens and Urbonas 1996) Rev Urban Drainage & Flood Control District HS-81
28 Channel Report Hydraflow Express Extension for Autodesk AutoCAD Civil 3D by Autodesk, Inc. Monday, May FALLBROOK FILING 3 EMERGANCY OVERFLOW Trapezoidal Bottom Width (ft) = Side Slopes (z:1) = 4.00, 4.00 Total Depth (ft) = 1.50 Invert Elev (ft) = Slope (%) = 2.00 N-Value = Calculations Compute by: Known Q Known Q (cfs) = Highlighted Depth (ft) = 0.43 Q (cfs) = Area (sqft) = Velocity (ft/s) = 3.37 Wetted Perim (ft) = Crit Depth, Yc (ft) = 0.41 Top Width (ft) = EGL (ft) = 0.61 Overflow Analysis Notes: The emergency overflow was evaluated using a total flow of cfs. This number was derived by adding the 100 year peak flow rate from pipe Line 1 (67.7 cfs, Refer to Storm Drain Calculations) to the direct runoff rate at Design Point 11 (13.3 cfs, Refer to Form SF-3). Then the peak flow was multiplied by 2.0. Elev (ft) Section Depth (ft) Reach (ft)
29 DESIGN PEAK FLOW FOR ONE-HALF OF STREET OR GRASS-LINED CHANNEL BY THE RATIONAL METHOD Worksheet Protected Project: Inlet ID: Fallbrook DP-1 Show Details Design Flow: ONLY if already determined through other methods: Minor Storm Major Storm (local peak flow for 1/2 of street OR grass-lined channel): *Q Known = cfs * If you enter values in Row 14, skip the rest of this sheet and proceed to sheet Q-Allow or Area Inlet. Geographic Information: (Enter data in the blue cells): Subcatchment Area = Acres Percent Imperviousness = % NRCS Soil Type = Site Type: Flows Developed For: A, B, C, or D <--- FILL IN THIS SECTION OR FILL IN THE SECTIONS BELOW. <--- Site is Urban Street Inlets Slope (ft/ft) Length (ft) Site is Non-Urban Area Inlets in a Median Overland Flow = Channel Flow = Rainfall Information: Intensity I (inch/hr) = C 1 * P 1 / ( C 2 + T c ) ^ C 3 Minor Storm Major Storm Design Storm Return Period, T r = years Return Period One-Hour Precipitation, P 1 = inches C 1 = C 2 = C 3 = User-Defined Storm Runoff Coefficient (leave this blank to accept a calculated value), C = User-Defined 5-yr. Runoff Coefficient (leave this blank to accept a calculated value), C 5 = Bypass (Carry-Over) Flow from upstream Subcatchments, Q b = cfs Total Design Peak Flow, Q = cfs Street & Inlet Capacities - DP 1 (Type R).xlsm, Q-Peak 5/4/2016, 3:07 PM
30 Project: Inlet ID: ALLOWABLE CAPACITY FOR ONE-HALF OF STREET (Minor & Major Storm) (Based on Regulated Criteria for Maximum Allowable Flow Depth and Spread) Fallbrook DP-1 Gutter Geometry (Enter data in the blue cells) Maximum Allowable Width for Spread Behind Curb T BACK = 20.0 ft Side Slope Behind Curb (leave blank for no conveyance credit behind curb) S BACK = ft/ft Manning's Roughness Behind Curb (typically between and 0.020) n BACK = Height of Curb at Gutter Flow Line H CURB = 6.00 inches Distance from Curb Face to Street Crown T CROWN = 30.0 ft Gutter Width W = 2.00 ft Street Transverse Slope S X = ft/ft Gutter Cross Slope (typically 2 inches over 24 inches or ft/ft) S W = ft/ft Street Longitudinal Slope - Enter 0 for sump condition S O = ft/ft Manning's Roughness for Street Section (typically between and 0.020) n STREET = Minor Storm Major Storm Max. Allowable Spread for Minor & Major Storm T MAX = ft Max. Allowable Depth at Gutter Flowline for Minor & Major Storm d MAX = inches Allow Flow Depth at Street Crown (leave blank for no) check = yes Maximum Capacity for 1/2 Street based On Allowable Spread Minor Storm Major Storm Water Depth without Gutter Depression (Eq. ST-2) y = inches Vertical Depth between Gutter Lip and Gutter Flowline (usually 2") d C = inches Gutter Depression (d C - (W * S x * 12)) a = inches Water Depth at Gutter Flowline d = inches Allowable Spread for Discharge outside the Gutter Section W (T - W) T X = ft Gutter Flow to Design Flow Ratio by FHWA HEC-22 method (Eq. ST-7) E O = Discharge outside the Gutter Section W, carried in Section T X Q X = cfs Discharge within the Gutter Section W (Q T - Q X ) Q W = cfs Discharge Behind the Curb (e.g., sidewalk, driveways, & lawns) Q BACK = cfs Maximum Flow Based On Allowable Spread Q T = cfs Flow Velocity within the Gutter Section V = fps V*d Product: Flow Velocity times Gutter Flowline Depth V*d = Maximum Capacity for 1/2 Street based on Allowable Depth Minor Storm Major Storm Theoretical Water Spread T TH = ft Theoretical Spread for Discharge outside the Gutter Section W (T - W) T X TH = ft Gutter Flow to Design Flow Ratio by FHWA HEC-22 method (Eq. ST-7) E O = Theoretical Discharge outside the Gutter Section W, carried in Section T X TH Q X TH = cfs Actual Discharge outside the Gutter Section W, (limited by distance T CROWN ) Q X = cfs Discharge within the Gutter Section W (Q d - Q X ) Q W = cfs Discharge Behind the Curb (e.g., sidewalk, driveways, & lawns) Q BACK = cfs Total Discharge for Major & Minor Storm (Pre-Safety Factor) Q = cfs Average Flow Velocity Within the Gutter Section V = fps V*d Product: Flow Velocity Times Gutter Flowline Depth V*d = Slope-Based Depth Safety Reduction Factor for Major & Minor (d > 6") Storm R = Max Flow Based on Allowable Depth (Safety Factor Applied) Q d = cfs Resultant Flow Depth at Gutter Flowline (Safety Factor Applied) d = inches Resultant Flow Depth at Street Crown (Safety Factor Applied) d CROWN = inches MINOR STORM Allowable Capacity is based on Depth Criterion Minor Storm Major Storm MAJOR STORM Allowable Capacity is based on Spread Criterion Q allow = cfs Minor storm max. allowable capacity GOOD - greater than flow given on sheet 'Q-Peak' Major storm max. allowable capacity GOOD - greater than flow given on sheet 'Q-Peak' Street & Inlet Capacities - DP 1 (Type R).xlsm, Q-Allow 5/4/2016, 3:07 PM
31 RELEVANT TO COLORADO BLVD. 100 YEAR WSEL ANALYSIS INLET ON A CONTINUOUS GRADE Project: Inlet ID: Fallbrook DP-1 Design Information (Input) MINOR MAJOR Type of Inlet Type = CDOT Type R Curb Opening Local Depression (additional to continuous gutter depression 'a' from 'Q-Allow') a LOCAL = inches Total Number of Units in the Inlet (Grate or Curb Opening) No = 1 1 Length of a Single Unit Inlet (Grate or Curb Opening) L o = ft Width of a Unit Grate (cannot be greater than W from Q-Allow) W o = N/A N/A ft Clogging Factor for a Single Unit Grate (typical min. value = 0.5) C f-g = N/A N/A Clogging Factor for a Single Unit Curb Opening (typical min. value = 0.1) C f-c = Street Hydraulics: OK - Q < maximum allowable from sheet 'Q-Allow' MINOR MAJOR Design Discharge for Half of Street (from Sheet Q-Peak ) Q o = cfs Water Spread Width T = ft Water Depth at Flowline (outside of local depression) d = inches Water Depth at Street Crown (or at T MAX) d CROWN = inches Ratio of Gutter Flow to Design Flow E o = Discharge outside the Gutter Section W, carried in Section T x Q x = cfs Discharge within the Gutter Section W Q w = cfs Discharge Behind the Curb Face Q BACK = cfs Flow Area within the Gutter Section W A W = sq ft Velocity within the Gutter Section W V W = fps Water Depth for Design Condition d LOCAL = inches Grate Analysis (Calculated) MINOR MAJOR Total Length of Inlet Grate Opening L = N/A N/A ft Ratio of Grate Flow to Design Flow E o-grate = N/A N/A Under No-Clogging Condition MINOR MAJOR Minimum Velocity Where Grate Splash-Over Begins V o = N/A N/A fps Interception Rate of Frontal Flow R f = N/A N/A Interception Rate of Side Flow R x = N/A N/A Interception Capacity Q i = N/A N/A cfs Under Clogging Condition MINOR MAJOR Clogging Coefficient for Multiple-unit Grate Inlet GrateCoef = N/A N/A Clogging Factor for Multiple-unit Grate Inlet GrateClog = N/A N/A Effective (unclogged) Length of Multiple-unit Grate Inlet L e = N/A N/A ft Minimum Velocity Where Grate Splash-Over Begins V o = N/A N/A fps Interception Rate of Frontal Flow R f = N/A N/A Interception Rate of Side Flow R x = N/A N/A Actual Interception Capacity Q a = N/A N/A cfs Carry-Over Flow = Q o-q a (to be applied to curb opening or next d/s inlet) Q b = N/A N/A cfs Curb or Slotted Inlet Opening Analysis (Calculated) MINOR MAJOR Equivalent Slope S e (based on grate carry-over) S e = ft/ft Required Length L T to Have 100% Interception L T = ft Under No-Clogging Condition MINOR MAJOR Effective Length of Curb Opening or Slotted Inlet (minimum of L, L T) L = ft Interception Capacity Q i = cfs Under Clogging Condition MINOR MAJOR Clogging Coefficient CurbCoef = Clogging Factor for Multiple-unit Curb Opening or Slotted Inlet CurbClog = Effective (Unclogged) Length L e = ft Actual Interception Capacity Q a = cfs Carry-Over Flow = Q b(grate)-q a Q b = cfs Summary MINOR MAJOR Total Inlet Interception Capacity Q = cfs Total Inlet Carry-Over Flow (flow bypassing inlet) Q b = cfs Capture Percentage = Q a/q o = C% = % Street & Inlet Capacities - DP 1 (Type R).xlsm, Inlet On Grade 5/4/2016, 3:34 PM
32 For a depiction of the drainage area analyzed, refer to Sheet DR01.
33
34 DESIGN PEAK FLOW FOR ONE-HALF OF STREET OR GRASS-LINED CHANNEL BY THE RATIONAL METHOD Worksheet Protected Project: Inlet ID: Fallbrook DP-2 Show Details Design Flow: ONLY if already determined through other methods: Minor Storm Major Storm (local peak flow for 1/2 of street OR grass-lined channel): *Q Known = cfs * If you enter values in Row 14, skip the rest of this sheet and proceed to sheet Q-Allow or Area Inlet. Geographic Information: (Enter data in the blue cells): Site Type: Flows Developed For: Subcatchment Area = Acres Percent Imperviousness = % NRCS Soil Type = A, B, C, or D <--- FILL IN THIS SECTION OR FILL IN THE SECTIONS BELOW. <--- Site is Urban Street Inlets Slope (ft/ft) Length (ft) Site is Non-Urban Area Inlets in a Median Overland Flow = Channel Flow = Rainfall Information: Intensity I (inch/hr) = C 1 * P 1 / ( C 2 + T c ) ^ C 3 Minor Storm Major Storm Design Storm Return Period, T r = Return Period One-Hour Precipitation, P 1 = C 1 = C 2 = C 3 = User-Defined Storm Runoff Coefficient (leave this blank to accept a calculated value), C = User-Defined 5-yr. Runoff Coefficient (leave this blank to accept a calculated value), C 5 = Bypass (Carry-Over) Flow from upstream Subcatchments, Q b = cfs years inches Total Design Peak Flow, Q = cfs Street & Inlet Capacities - DP 2 (Type R).xlsm, Q-Peak 8/11/2015, 4:58 PM
35 Project: Inlet ID: ALLOWABLE CAPACITY FOR ONE-HALF OF STREET (Minor & Major Storm) (Based on Regulated Criteria for Maximum Allowable Flow Depth and Spread) Fallbrook DP-2 Gutter Geometry (Enter data in the blue cells) Maximum Allowable Width for Spread Behind Curb T BACK = 12.5 ft Side Slope Behind Curb (leave blank for no conveyance credit behind curb) S BACK = ft/ft Manning's Roughness Behind Curb (typically between and 0.020) n BACK = Height of Curb at Gutter Flow Line H CURB = 6.00 inches Distance from Curb Face to Street Crown T CROWN = 17.0 ft Gutter Width W = 2.00 ft Street Transverse Slope S X = ft/ft Gutter Cross Slope (typically 2 inches over 24 inches or ft/ft) S W = ft/ft Street Longitudinal Slope - Enter 0 for sump condition S O = ft/ft Manning's Roughness for Street Section (typically between and 0.020) n STREET = Minor Storm Major Storm Max. Allowable Spread for Minor & Major Storm T MAX = ft Max. Allowable Depth at Gutter Flowline for Minor & Major Storm d MAX = inches Allow Flow Depth at Street Crown (leave blank for no) check = yes Maximum Capacity for 1/2 Street based On Allowable Spread Minor Storm Major Storm Water Depth without Gutter Depression (Eq. ST-2) y = inches Vertical Depth between Gutter Lip and Gutter Flowline (usually 2") d C = inches Gutter Depression (d C - (W * S x * 12)) a = inches Water Depth at Gutter Flowline d = inches Allowable Spread for Discharge outside the Gutter Section W (T - W) T X = ft Gutter Flow to Design Flow Ratio by FHWA HEC-22 method (Eq. ST-7) E O = Discharge outside the Gutter Section W, carried in Section T X Q X = cfs Discharge within the Gutter Section W (Q T - Q X ) Q W = cfs Discharge Behind the Curb (e.g., sidewalk, driveways, & lawns) Q BACK = cfs Maximum Flow Based On Allowable Spread Q T = SUMP SUMP cfs Flow Velocity within the Gutter Section V = fps V*d Product: Flow Velocity times Gutter Flowline Depth V*d = Maximum Capacity for 1/2 Street based on Allowable Depth Minor Storm Major Storm Theoretical Water Spread T TH = ft Theoretical Spread for Discharge outside the Gutter Section W (T - W) T X TH = ft Gutter Flow to Design Flow Ratio by FHWA HEC-22 method (Eq. ST-7) E O = Theoretical Discharge outside the Gutter Section W, carried in Section T X TH Q X TH = cfs Actual Discharge outside the Gutter Section W, (limited by distance T CROWN ) Q X = cfs Discharge within the Gutter Section W (Q d - Q X ) Q W = cfs Discharge Behind the Curb (e.g., sidewalk, driveways, & lawns) Q BACK = cfs Total Discharge for Major & Minor Storm (Pre-Safety Factor) Q = cfs Average Flow Velocity Within the Gutter Section V = fps V*d Product: Flow Velocity Times Gutter Flowline Depth V*d = Slope-Based Depth Safety Reduction Factor for Major & Minor (d > 6") Storm R = SUMP SUMP Max Flow Based on Allowable Depth (Safety Factor Applied) Q d = SUMP SUMP cfs Resultant Flow Depth at Gutter Flowline (Safety Factor Applied) d = inches Resultant Flow Depth at Street Crown (Safety Factor Applied) d CROWN = inches MINOR STORM Allowable Capacity is based on Depth Criterion Minor Storm Major Storm MAJOR STORM Allowable Capacity is based on Depth Criterion Q allow = SUMP SUMP cfs Minor storm max. allowable capacity GOOD - greater than flow given on sheet 'Q-Peak' Major storm max. allowable capacity GOOD - greater than flow given on sheet 'Q-Peak' Street & Inlet Capacities - DP 2 (Type R).xlsm, Q-Allow 8/11/2015, 4:58 PM
36 INLET IN A SUMP OR SAG LOCATION Project = Inlet ID = Fallbrook DP-2 H-Curb W W P H-Vert Lo (C) Wo Lo (G) Design Information (Input) MINOR MAJOR Type of Inlet Inlet Type = CDOT Type R Curb Opening Local Depression (additional to continuous gutter depression 'a' from 'Q-Allow') a local = inches Number of Unit Inlets (Grate or Curb Opening) No = 1 1 Water Depth at Flowline (outside of local depression) Ponding Depth = inches Grate Information MINOR MAJOR Override Depths Length of a Unit Grate L o (G) = N/A N/A feet Width of a Unit Grate W o = N/A N/A feet Area Opening Ratio for a Grate (typical values ) A ratio = N/A N/A Clogging Factor for a Single Grate (typical value ) C f (G) = N/A N/A Grate Weir Coefficient (typical value ) C w (G) = N/A N/A Grate Orifice Coefficient (typical value ) C o (G) = N/A N/A Curb Opening Information MINOR MAJOR Length of a Unit Curb Opening L o (C) = feet Height of Vertical Curb Opening in Inches H vert = inches Height of Curb Orifice Throat in Inches H throat = inches Angle of Throat (see USDCM Figure ST-5) Theta = degrees Side Width for Depression Pan (typically the gutter width of 2 feet) W p = feet Clogging Factor for a Single Curb Opening (typical value 0.10) C f (C) = Curb Opening Weir Coefficient (typical value ) C w (C) = Curb Opening Orifice Coefficient (typical value ) C o (C) = MINOR MAJOR Total Inlet Interception Capacity (assumes clogged condition) Q a = cfs Inlet Capacity IS GOOD for Minor and Major Storms (>Q PEAK) Q PEAK REQUIRED = cfs Street & Inlet Capacities - DP 2 (Type R).xlsm, Inlet In Sump 8/11/2015, 4:58 PM
37 DESIGN PEAK FLOW FOR ONE-HALF OF STREET OR GRASS-LINED CHANNEL BY THE RATIONAL METHOD Worksheet Protected Project: Inlet ID: Fallbrook DP 3 Show Details Design Flow: ONLY if already determined through other methods: Minor Storm Major Storm (local peak flow for 1/2 of street OR grass-lined channel): *Q Known = cfs * If you enter values in Row 14, skip the rest of this sheet and proceed to sheet Q-Allow or Area Inlet. Geographic Information: (Enter data in the blue cells): Subcatchment Area = Acres Percent Imperviousness = % NRCS Soil Type = Site Type: Flows Developed For: A, B, C, or D <--- FILL IN THIS SECTION OR FILL IN THE SECTIONS BELOW. <--- Site is Urban Street Inlets Slope (ft/ft) Length (ft) Site is Non-Urban Area Inlets in a Median Overland Flow = Channel Flow = Rainfall Information: Intensity I (inch/hr) = C 1 * P 1 / ( C 2 + T c ) ^ C 3 Minor Storm Major Storm Design Storm Return Period, T r = years Return Period One-Hour Precipitation, P 1 = inches C 1 = C 2 = C 3 = User-Defined Storm Runoff Coefficient (leave this blank to accept a calculated value), C = User-Defined 5-yr. Runoff Coefficient (leave this blank to accept a calculated value), C 5 = Bypass (Carry-Over) Flow from upstream Subcatchments, Q b = cfs Total Design Peak Flow, Q = cfs Street & Inlet Capacities - DP 3 (13 Valley).xlsm, Q-Peak 12/8/2015, 3:14 PM
38 INLET IN A SUMP OR SAG LOCATION Project = Inlet ID = Fallbrook DP 3 H-Curb W W P H-Vert Lo (C) Wo Lo (G) Design Information (Input) MINOR MAJOR Type of Inlet Inlet Type = CDOT/Denver 13 Valley Grate Local Depression (additional to continuous gutter depression 'a' from 'Q-Allow') a local = inches Number of Unit Inlets (Grate or Curb Opening) No = 2 2 Water Depth at Flowline (outside of local depression) Ponding Depth = inches Grate Information MINOR MAJOR Override Depths Length of a Unit Grate L o (G) = feet Width of a Unit Grate W o = feet Area Opening Ratio for a Grate (typical values ) A ratio = Clogging Factor for a Single Grate (typical value ) C f (G) = Grate Weir Coefficient (typical value ) C w (G) = Grate Orifice Coefficient (typical value ) C o (G) = Curb Opening Information MINOR MAJOR Length of a Unit Curb Opening L o (C) = N/A N/A feet Height of Vertical Curb Opening in Inches H vert = N/A N/A inches Height of Curb Orifice Throat in Inches H throat = N/A N/A inches Angle of Throat (see USDCM Figure ST-5) Theta = N/A N/A degrees Side Width for Depression Pan (typically the gutter width of 2 feet) W p = N/A N/A feet Clogging Factor for a Single Curb Opening (typical value 0.10) C f (C) = N/A N/A Curb Opening Weir Coefficient (typical value ) C w (C) = N/A N/A Curb Opening Orifice Coefficient (typical value ) C o (C) = N/A N/A MINOR MAJOR Total Inlet Interception Capacity (assumes clogged condition) Q a = cfs Inlet Capacity IS GOOD for Minor and Major Storms (>Q PEAK) Q PEAK REQUIRED = cfs Street & Inlet Capacities - DP 3 (13 Valley).xlsm, Inlet In Sump 12/8/2015, 3:13 PM
39 DESIGN PEAK FLOW FOR ONE-HALF OF STREET OR GRASS-LINED CHANNEL BY THE RATIONAL METHOD Worksheet Protected Project: Inlet ID: Fallbrook DP 4-1 Show Details Design Flow: ONLY if already determined through other methods: Minor Storm Major Storm (local peak flow for 1/2 of street OR grass-lined channel): *Q Known = cfs * If you enter values in Row 14, skip the rest of this sheet and proceed to sheet Q-Allow or Area Inlet. Geographic Information: (Enter data in the blue cells): Subcatchment Area = Acres Percent Imperviousness = % NRCS Soil Type = Site Type: Flows Developed For: A, B, C, or D <--- FILL IN THIS SECTION OR FILL IN THE SECTIONS BELOW. <--- Site is Urban Street Inlets Slope (ft/ft) Length (ft) Site is Non-Urban Area Inlets in a Median Overland Flow = Channel Flow = Rainfall Information: Intensity I (inch/hr) = C 1 * P 1 / ( C 2 + T c ) ^ C 3 Minor Storm Major Storm Design Storm Return Period, T r = years Return Period One-Hour Precipitation, P 1 = inches C 1 = C 2 = C 3 = User-Defined Storm Runoff Coefficient (leave this blank to accept a calculated value), C = User-Defined 5-yr. Runoff Coefficient (leave this blank to accept a calculated value), C 5 = Bypass (Carry-Over) Flow from upstream Subcatchments, Q b = cfs Total Design Peak Flow, Q = cfs Street & Inlet Capacities - DP 4-1 (Type R).xlsm, Q-Peak 12/8/2015, 12:51 PM
40 Project: Inlet ID: ALLOWABLE CAPACITY FOR ONE-HALF OF STREET (Minor & Major Storm) (Based on Regulated Criteria for Maximum Allowable Flow Depth and Spread) Fallbrook DP 4-1 Gutter Geometry (Enter data in the blue cells) Maximum Allowable Width for Spread Behind Curb T BACK = 12.5 ft Side Slope Behind Curb (leave blank for no conveyance credit behind curb) S BACK = ft/ft Manning's Roughness Behind Curb (typically between and 0.020) n BACK = Height of Curb at Gutter Flow Line H CURB = 6.00 inches Distance from Curb Face to Street Crown T CROWN = 17.0 ft Gutter Width W = 2.00 ft Street Transverse Slope S X = ft/ft Gutter Cross Slope (typically 2 inches over 24 inches or ft/ft) S W = ft/ft Street Longitudinal Slope - Enter 0 for sump condition S O = ft/ft Manning's Roughness for Street Section (typically between and 0.020) n STREET = Minor Storm Major Storm Max. Allowable Spread for Minor & Major Storm T MAX = ft Max. Allowable Depth at Gutter Flowline for Minor & Major Storm d MAX = inches Allow Flow Depth at Street Crown (leave blank for no) check = yes Maximum Capacity for 1/2 Street based On Allowable Spread Minor Storm Major Storm Water Depth without Gutter Depression (Eq. ST-2) y = inches Vertical Depth between Gutter Lip and Gutter Flowline (usually 2") d C = inches Gutter Depression (d C - (W * S x * 12)) a = inches Water Depth at Gutter Flowline d = inches Allowable Spread for Discharge outside the Gutter Section W (T - W) T X = ft Gutter Flow to Design Flow Ratio by FHWA HEC-22 method (Eq. ST-7) E O = Discharge outside the Gutter Section W, carried in Section T X Q X = cfs Discharge within the Gutter Section W (Q T - Q X ) Q W = cfs Discharge Behind the Curb (e.g., sidewalk, driveways, & lawns) Q BACK = cfs Maximum Flow Based On Allowable Spread Q T = SUMP SUMP cfs Flow Velocity within the Gutter Section V = fps V*d Product: Flow Velocity times Gutter Flowline Depth V*d = Maximum Capacity for 1/2 Street based on Allowable Depth Minor Storm Major Storm Theoretical Water Spread T TH = ft Theoretical Spread for Discharge outside the Gutter Section W (T - W) T X TH = ft Gutter Flow to Design Flow Ratio by FHWA HEC-22 method (Eq. ST-7) E O = Theoretical Discharge outside the Gutter Section W, carried in Section T X TH Q X TH = cfs Actual Discharge outside the Gutter Section W, (limited by distance T CROWN ) Q X = cfs Discharge within the Gutter Section W (Q d - Q X ) Q W = cfs Discharge Behind the Curb (e.g., sidewalk, driveways, & lawns) Q BACK = cfs Total Discharge for Major & Minor Storm (Pre-Safety Factor) Q = cfs Average Flow Velocity Within the Gutter Section V = fps V*d Product: Flow Velocity Times Gutter Flowline Depth V*d = Slope-Based Depth Safety Reduction Factor for Major & Minor (d > 6") Storm R = SUMP SUMP Max Flow Based on Allowable Depth (Safety Factor Applied) Q d = SUMP SUMP cfs Resultant Flow Depth at Gutter Flowline (Safety Factor Applied) d = inches Resultant Flow Depth at Street Crown (Safety Factor Applied) d CROWN = inches MINOR STORM Allowable Capacity is based on Depth Criterion Minor Storm Major Storm MAJOR STORM Allowable Capacity is based on Depth Criterion Q allow = SUMP SUMP cfs Minor storm max. allowable capacity GOOD - greater than flow given on sheet 'Q-Peak' Major storm max. allowable capacity GOOD - greater than flow given on sheet 'Q-Peak' Street & Inlet Capacities - DP 4-1 (Type R).xlsm, Q-Allow 12/8/2015, 1:57 PM
41 INLET IN A SUMP OR SAG LOCATION Project = Inlet ID = Fallbrook DP 4-1 H-Curb W W P H-Vert Lo (C) Wo Lo (G) Design Information (Input) MINOR MAJOR Type of Inlet Inlet Type = CDOT Type R Curb Opening Local Depression (additional to continuous gutter depression 'a' from 'Q-Allow') a local = inches Number of Unit Inlets (Grate or Curb Opening) No = 1 1 Water Depth at Flowline (outside of local depression) Ponding Depth = inches Grate Information MINOR MAJOR Override Depths Length of a Unit Grate L o (G) = N/A N/A feet Width of a Unit Grate W o = N/A N/A feet Area Opening Ratio for a Grate (typical values ) A ratio = N/A N/A Clogging Factor for a Single Grate (typical value ) C f (G) = N/A N/A Grate Weir Coefficient (typical value ) C w (G) = N/A N/A Grate Orifice Coefficient (typical value ) C o (G) = N/A N/A Curb Opening Information MINOR MAJOR Length of a Unit Curb Opening L o (C) = feet Height of Vertical Curb Opening in Inches H vert = inches Height of Curb Orifice Throat in Inches H throat = inches Angle of Throat (see USDCM Figure ST-5) Theta = degrees Side Width for Depression Pan (typically the gutter width of 2 feet) W p = feet Clogging Factor for a Single Curb Opening (typical value 0.10) C f (C) = Curb Opening Weir Coefficient (typical value ) C w (C) = Curb Opening Orifice Coefficient (typical value ) C o (C) = MINOR MAJOR Total Inlet Interception Capacity (assumes clogged condition) Q a = cfs Inlet Capacity IS GOOD for Minor and Major Storms (>Q PEAK) Q PEAK REQUIRED = cfs Street & Inlet Capacities - DP 4-1 (Type R).xlsm, Inlet In Sump 12/8/2015, 1:58 PM
42 DESIGN PEAK FLOW FOR ONE-HALF OF STREET OR GRASS-LINED CHANNEL BY THE RATIONAL METHOD Worksheet Protected Project: Inlet ID: Fallbrook DP 4-2 Show Details Design Flow: ONLY if already determined through other methods: Minor Storm Major Storm (local peak flow for 1/2 of street OR grass-lined channel): *Q Known = cfs * If you enter values in Row 14, skip the rest of this sheet and proceed to sheet Q-Allow or Area Inlet. Geographic Information: (Enter data in the blue cells): Subcatchment Area = Acres Percent Imperviousness = % NRCS Soil Type = Site Type: Flows Developed For: A, B, C, or D <--- FILL IN THIS SECTION OR FILL IN THE SECTIONS BELOW. <--- Site is Urban Street Inlets Slope (ft/ft) Length (ft) Site is Non-Urban Area Inlets in a Median Overland Flow = Channel Flow = Rainfall Information: Intensity I (inch/hr) = C 1 * P 1 / ( C 2 + T c ) ^ C 3 Minor Storm Major Storm Design Storm Return Period, T r = years Return Period One-Hour Precipitation, P 1 = inches C 1 = C 2 = C 3 = User-Defined Storm Runoff Coefficient (leave this blank to accept a calculated value), C = User-Defined 5-yr. Runoff Coefficient (leave this blank to accept a calculated value), C 5 = Bypass (Carry-Over) Flow from upstream Subcatchments, Q b = cfs Total Design Peak Flow, Q = cfs Street & Inlet Capacities - DP 4-2 (Type R).xlsm, Q-Peak 2/11/2016, 9:27 AM
43 Project: Inlet ID: ALLOWABLE CAPACITY FOR ONE-HALF OF STREET (Minor & Major Storm) (Based on Regulated Criteria for Maximum Allowable Flow Depth and Spread) Fallbrook DP 4-2 Gutter Geometry (Enter data in the blue cells) Maximum Allowable Width for Spread Behind Curb T BACK = 12.5 ft Side Slope Behind Curb (leave blank for no conveyance credit behind curb) S BACK = ft/ft Manning's Roughness Behind Curb (typically between and 0.020) n BACK = Height of Curb at Gutter Flow Line H CURB = 6.00 inches Distance from Curb Face to Street Crown T CROWN = 17.0 ft Gutter Width W = 2.00 ft Street Transverse Slope S X = ft/ft Gutter Cross Slope (typically 2 inches over 24 inches or ft/ft) S W = ft/ft Street Longitudinal Slope - Enter 0 for sump condition S O = ft/ft Manning's Roughness for Street Section (typically between and 0.020) n STREET = Minor Storm Major Storm Max. Allowable Spread for Minor & Major Storm T MAX = ft Max. Allowable Depth at Gutter Flowline for Minor & Major Storm d MAX = inches Allow Flow Depth at Street Crown (leave blank for no) check = yes Maximum Capacity for 1/2 Street based On Allowable Spread Minor Storm Major Storm Water Depth without Gutter Depression (Eq. ST-2) y = inches Vertical Depth between Gutter Lip and Gutter Flowline (usually 2") d C = inches Gutter Depression (d C - (W * S x * 12)) a = inches Water Depth at Gutter Flowline d = inches Allowable Spread for Discharge outside the Gutter Section W (T - W) T X = ft Gutter Flow to Design Flow Ratio by FHWA HEC-22 method (Eq. ST-7) E O = Discharge outside the Gutter Section W, carried in Section T X Q X = cfs Discharge within the Gutter Section W (Q T - Q X ) Q W = cfs Discharge Behind the Curb (e.g., sidewalk, driveways, & lawns) Q BACK = cfs Maximum Flow Based On Allowable Spread Q T = SUMP SUMP cfs Flow Velocity within the Gutter Section V = fps V*d Product: Flow Velocity times Gutter Flowline Depth V*d = Maximum Capacity for 1/2 Street based on Allowable Depth Minor Storm Major Storm Theoretical Water Spread T TH = ft Theoretical Spread for Discharge outside the Gutter Section W (T - W) T X TH = ft Gutter Flow to Design Flow Ratio by FHWA HEC-22 method (Eq. ST-7) E O = Theoretical Discharge outside the Gutter Section W, carried in Section T X TH Q X TH = cfs Actual Discharge outside the Gutter Section W, (limited by distance T CROWN ) Q X = cfs Discharge within the Gutter Section W (Q d - Q X ) Q W = cfs Discharge Behind the Curb (e.g., sidewalk, driveways, & lawns) Q BACK = cfs Total Discharge for Major & Minor Storm (Pre-Safety Factor) Q = cfs Average Flow Velocity Within the Gutter Section V = fps V*d Product: Flow Velocity Times Gutter Flowline Depth V*d = Slope-Based Depth Safety Reduction Factor for Major & Minor (d > 6") Storm R = SUMP SUMP Max Flow Based on Allowable Depth (Safety Factor Applied) Q d = SUMP SUMP cfs Resultant Flow Depth at Gutter Flowline (Safety Factor Applied) d = inches Resultant Flow Depth at Street Crown (Safety Factor Applied) d CROWN = inches MINOR STORM Allowable Capacity is based on Depth Criterion Minor Storm Major Storm MAJOR STORM Allowable Capacity is based on Depth Criterion Q allow = SUMP SUMP cfs Minor storm max. allowable capacity GOOD - greater than flow given on sheet 'Q-Peak' Major storm max. allowable capacity GOOD - greater than flow given on sheet 'Q-Peak' Street & Inlet Capacities - DP 4-2 (Type R).xlsm, Q-Allow 12/8/2015, 3:21 PM
44 INLET IN A SUMP OR SAG LOCATION Project = Inlet ID = Fallbrook DP 4-2 H-Curb W W P H-Vert Lo (C) Wo Lo (G) Design Information (Input) MINOR MAJOR Type of Inlet Inlet Type = CDOT Type R Curb Opening Local Depression (additional to continuous gutter depression 'a' from 'Q-Allow') a local = inches Number of Unit Inlets (Grate or Curb Opening) No = 2 2 Water Depth at Flowline (outside of local depression) Ponding Depth = inches Grate Information MINOR MAJOR Override Depths Length of a Unit Grate L o (G) = N/A N/A feet Width of a Unit Grate W o = N/A N/A feet Area Opening Ratio for a Grate (typical values ) A ratio = N/A N/A Clogging Factor for a Single Grate (typical value ) C f (G) = N/A N/A Grate Weir Coefficient (typical value ) C w (G) = N/A N/A Grate Orifice Coefficient (typical value ) C o (G) = N/A N/A Curb Opening Information MINOR MAJOR Length of a Unit Curb Opening L o (C) = feet Height of Vertical Curb Opening in Inches H vert = inches Height of Curb Orifice Throat in Inches H throat = inches Angle of Throat (see USDCM Figure ST-5) Theta = degrees Side Width for Depression Pan (typically the gutter width of 2 feet) W p = feet Clogging Factor for a Single Curb Opening (typical value 0.10) C f (C) = Curb Opening Weir Coefficient (typical value ) C w (C) = Curb Opening Orifice Coefficient (typical value ) C o (C) = MINOR MAJOR Total Inlet Interception Capacity (assumes clogged condition) Q a = cfs Inlet Capacity IS GOOD for Minor and Major Storms (>Q PEAK) Q PEAK REQUIRED = cfs Street & Inlet Capacities - DP 4-2 (Type R).xlsm, Inlet In Sump 2/11/2016, 9:28 AM
45 DESIGN PEAK FLOW FOR ONE-HALF OF STREET OR GRASS-LINED CHANNEL BY THE RATIONAL METHOD Worksheet Protected Project: Inlet ID: Fallbrook DP-5 Show Details Design Flow: ONLY if already determined through other methods: Minor Storm Major Storm (local peak flow for 1/2 of street OR grass-lined channel): *Q Known = cfs * If you enter values in Row 14, skip the rest of this sheet and proceed to sheet Q-Allow or Area Inlet. Geographic Information: (Enter data in the blue cells): Site Type: Flows Developed For: Subcatchment Area = Acres Percent Imperviousness = % NRCS Soil Type = A, B, C, or D <--- FILL IN THIS SECTION OR FILL IN THE SECTIONS BELOW. <--- Site is Urban Street Inlets Slope (ft/ft) Length (ft) Site is Non-Urban Area Inlets in a Median Overland Flow = Channel Flow = Rainfall Information: Intensity I (inch/hr) = C 1 * P 1 / ( C 2 + T c ) ^ C 3 Minor Storm Major Storm Design Storm Return Period, T r = Return Period One-Hour Precipitation, P 1 = C 1 = C 2 = C 3 = User-Defined Storm Runoff Coefficient (leave this blank to accept a calculated value), C = User-Defined 5-yr. Runoff Coefficient (leave this blank to accept a calculated value), C 5 = Bypass (Carry-Over) Flow from upstream Subcatchments, Q b = cfs years inches Total Design Peak Flow, Q = cfs Street & Inlet Capacities - DP 5 (Type R).xlsm, Q-Peak 8/11/2015, 5:01 PM
46 Project: Inlet ID: ALLOWABLE CAPACITY FOR ONE-HALF OF STREET (Minor & Major Storm) (Based on Regulated Criteria for Maximum Allowable Flow Depth and Spread) Fallbrook DP-5 Gutter Geometry (Enter data in the blue cells) Maximum Allowable Width for Spread Behind Curb T BACK = 12.5 ft Side Slope Behind Curb (leave blank for no conveyance credit behind curb) S BACK = ft/ft Manning's Roughness Behind Curb (typically between and 0.020) n BACK = Height of Curb at Gutter Flow Line H CURB = 6.00 inches Distance from Curb Face to Street Crown T CROWN = 17.0 ft Gutter Width W = 2.00 ft Street Transverse Slope S X = ft/ft Gutter Cross Slope (typically 2 inches over 24 inches or ft/ft) S W = ft/ft Street Longitudinal Slope - Enter 0 for sump condition S O = ft/ft Manning's Roughness for Street Section (typically between and 0.020) n STREET = Minor Storm Major Storm Max. Allowable Spread for Minor & Major Storm T MAX = ft Max. Allowable Depth at Gutter Flowline for Minor & Major Storm d MAX = inches Allow Flow Depth at Street Crown (leave blank for no) check = yes Maximum Capacity for 1/2 Street based On Allowable Spread Minor Storm Major Storm Water Depth without Gutter Depression (Eq. ST-2) y = inches Vertical Depth between Gutter Lip and Gutter Flowline (usually 2") d C = inches Gutter Depression (d C - (W * S x * 12)) a = inches Water Depth at Gutter Flowline d = inches Allowable Spread for Discharge outside the Gutter Section W (T - W) T X = ft Gutter Flow to Design Flow Ratio by FHWA HEC-22 method (Eq. ST-7) E O = Discharge outside the Gutter Section W, carried in Section T X Q X = cfs Discharge within the Gutter Section W (Q T - Q X ) Q W = cfs Discharge Behind the Curb (e.g., sidewalk, driveways, & lawns) Q BACK = cfs Maximum Flow Based On Allowable Spread Q T = SUMP SUMP cfs Flow Velocity within the Gutter Section V = fps V*d Product: Flow Velocity times Gutter Flowline Depth V*d = Maximum Capacity for 1/2 Street based on Allowable Depth Minor Storm Major Storm Theoretical Water Spread T TH = ft Theoretical Spread for Discharge outside the Gutter Section W (T - W) T X TH = ft Gutter Flow to Design Flow Ratio by FHWA HEC-22 method (Eq. ST-7) E O = Theoretical Discharge outside the Gutter Section W, carried in Section T X TH Q X TH = cfs Actual Discharge outside the Gutter Section W, (limited by distance T CROWN ) Q X = cfs Discharge within the Gutter Section W (Q d - Q X ) Q W = cfs Discharge Behind the Curb (e.g., sidewalk, driveways, & lawns) Q BACK = cfs Total Discharge for Major & Minor Storm (Pre-Safety Factor) Q = cfs Average Flow Velocity Within the Gutter Section V = fps V*d Product: Flow Velocity Times Gutter Flowline Depth V*d = Slope-Based Depth Safety Reduction Factor for Major & Minor (d > 6") Storm R = SUMP SUMP Max Flow Based on Allowable Depth (Safety Factor Applied) Q d = SUMP SUMP cfs Resultant Flow Depth at Gutter Flowline (Safety Factor Applied) d = inches Resultant Flow Depth at Street Crown (Safety Factor Applied) d CROWN = inches MINOR STORM Allowable Capacity is based on Depth Criterion Minor Storm Major Storm MAJOR STORM Allowable Capacity is based on Depth Criterion Q allow = SUMP SUMP cfs Minor storm max. allowable capacity GOOD - greater than flow given on sheet 'Q-Peak' Major storm max. allowable capacity GOOD - greater than flow given on sheet 'Q-Peak' Street & Inlet Capacities - DP 5 (Type R).xlsm, Q-Allow 8/11/2015, 5:01 PM
47 INLET IN A SUMP OR SAG LOCATION Project = Inlet ID = Fallbrook DP-5 H-Curb W W P H-Vert Lo (C) Wo Lo (G) Design Information (Input) MINOR MAJOR Type of Inlet Inlet Type = CDOT Type R Curb Opening Local Depression (additional to continuous gutter depression 'a' from 'Q-Allow') a local = inches Number of Unit Inlets (Grate or Curb Opening) No = 1 1 Water Depth at Flowline (outside of local depression) Ponding Depth = inches Grate Information MINOR MAJOR Override Depths Length of a Unit Grate L o (G) = N/A N/A feet Width of a Unit Grate W o = N/A N/A feet Area Opening Ratio for a Grate (typical values ) A ratio = N/A N/A Clogging Factor for a Single Grate (typical value ) C f (G) = N/A N/A Grate Weir Coefficient (typical value ) C w (G) = N/A N/A Grate Orifice Coefficient (typical value ) C o (G) = N/A N/A Curb Opening Information MINOR MAJOR Length of a Unit Curb Opening L o (C) = feet Height of Vertical Curb Opening in Inches H vert = inches Height of Curb Orifice Throat in Inches H throat = inches Angle of Throat (see USDCM Figure ST-5) Theta = degrees Side Width for Depression Pan (typically the gutter width of 2 feet) W p = feet Clogging Factor for a Single Curb Opening (typical value 0.10) C f (C) = Curb Opening Weir Coefficient (typical value ) C w (C) = Curb Opening Orifice Coefficient (typical value ) C o (C) = MINOR MAJOR Total Inlet Interception Capacity (assumes clogged condition) Q a = cfs Inlet Capacity IS GOOD for Minor and Major Storms (>Q PEAK) Q PEAK REQUIRED = cfs Street & Inlet Capacities - DP 5 (Type R).xlsm, Inlet In Sump 8/11/2015, 5:01 PM
48 DESIGN PEAK FLOW FOR ONE-HALF OF STREET OR GRASS-LINED CHANNEL BY THE RATIONAL METHOD Worksheet Protected Project: Inlet ID: Fallbrook DP 6-1 Show Details Design Flow: ONLY if already determined through other methods: Minor Storm Major Storm (local peak flow for 1/2 of street OR grass-lined channel): *Q Known = cfs * If you enter values in Row 14, skip the rest of this sheet and proceed to sheet Q-Allow or Area Inlet. Geographic Information: (Enter data in the blue cells): Subcatchment Area = Acres Percent Imperviousness = % NRCS Soil Type = Site Type: Flows Developed For: A, B, C, or D <--- FILL IN THIS SECTION OR FILL IN THE SECTIONS BELOW. <--- Site is Urban Street Inlets Slope (ft/ft) Length (ft) Site is Non-Urban Area Inlets in a Median Overland Flow = Channel Flow = Rainfall Information: Intensity I (inch/hr) = C 1 * P 1 / ( C 2 + T c ) ^ C 3 Minor Storm Major Storm Design Storm Return Period, T r = years Return Period One-Hour Precipitation, P 1 = inches C 1 = C 2 = C 3 = User-Defined Storm Runoff Coefficient (leave this blank to accept a calculated value), C = User-Defined 5-yr. Runoff Coefficient (leave this blank to accept a calculated value), C 5 = Bypass (Carry-Over) Flow from upstream Subcatchments, Q b = cfs Total Design Peak Flow, Q = cfs Street & Inlet Capacities - DP 6-1 (13 Valley).xlsm, Q-Peak 12/8/2015, 12:55 PM
49 INLET ON A CONTINUOUS GRADE Project: Inlet ID: Fallbrook DP 6-1 Design Information (Input) MINOR MAJOR Type of Inlet Type = CDOT/Denver 13 Valley Grate Local Depression (additional to continuous gutter depression 'a' from 'Q-Allow') a LOCAL = inches Total Number of Units in the Inlet (Grate or Curb Opening) No = 1 1 Length of a Single Unit Inlet (Grate or Curb Opening) L o = ft Width of a Unit Grate (cannot be greater than W from Q-Allow) W o = ft Clogging Factor for a Single Unit Grate (typical min. value = 0.5) C f-g = Clogging Factor for a Single Unit Curb Opening (typical min. value = 0.1) C f-c = N/A N/A Street Hydraulics: OK - Q < maximum allowable from sheet 'Q-Allow' MINOR MAJOR Total Inlet Interception Capacity Q = cfs Total Inlet Carry-Over Flow (flow bypassing inlet) Q b = cfs Capture Percentage = Q a/q o = C% = % Street & Inlet Capacities - DP 6-1 (13 Valley).xlsm, Inlet On Grade 12/8/2015, 12:56 PM
50 DESIGN PEAK FLOW FOR ONE-HALF OF STREET OR GRASS-LINED CHANNEL BY THE RATIONAL METHOD Worksheet Protected Project: Inlet ID: Fallbrook DP 6-2 Show Details Design Flow: ONLY if already determined through other methods: Minor Storm Major Storm (local peak flow for 1/2 of street OR grass-lined channel): *Q Known = cfs * If you enter values in Row 14, skip the rest of this sheet and proceed to sheet Q-Allow or Area Inlet. Geographic Information: (Enter data in the blue cells): Subcatchment Area = Acres Percent Imperviousness = % NRCS Soil Type = Site Type: Flows Developed For: A, B, C, or D <--- FILL IN THIS SECTION OR FILL IN THE SECTIONS BELOW. <--- Site is Urban Street Inlets Slope (ft/ft) Length (ft) Site is Non-Urban Area Inlets in a Median Overland Flow = Channel Flow = Rainfall Information: Intensity I (inch/hr) = C 1 * P 1 / ( C 2 + T c ) ^ C 3 Minor Storm Major Storm Design Storm Return Period, T r = years Return Period One-Hour Precipitation, P 1 = inches C 1 = C 2 = C 3 = User-Defined Storm Runoff Coefficient (leave this blank to accept a calculated value), C = User-Defined 5-yr. Runoff Coefficient (leave this blank to accept a calculated value), C 5 = Bypass (Carry-Over) Flow from upstream Subcatchments, Q b = cfs Total Design Peak Flow, Q = cfs Street & Inlet Capacities - DP 6-2 (Type R).xlsm, Q-Peak 12/8/2015, 12:53 PM
51 Project: Inlet ID: ALLOWABLE CAPACITY FOR ONE-HALF OF STREET (Minor & Major Storm) (Based on Regulated Criteria for Maximum Allowable Flow Depth and Spread) Fallbrook DP 6-2 Gutter Geometry (Enter data in the blue cells) Maximum Allowable Width for Spread Behind Curb T BACK = 14.0 ft Side Slope Behind Curb (leave blank for no conveyance credit behind curb) S BACK = ft/ft Manning's Roughness Behind Curb (typically between and 0.020) n BACK = Height of Curb at Gutter Flow Line H CURB = 6.00 inches Distance from Curb Face to Street Crown T CROWN = 19.0 ft Gutter Width W = 2.00 ft Street Transverse Slope S X = ft/ft Gutter Cross Slope (typically 2 inches over 24 inches or ft/ft) S W = ft/ft Street Longitudinal Slope - Enter 0 for sump condition S O = ft/ft Manning's Roughness for Street Section (typically between and 0.020) n STREET = Minor Storm Major Storm Max. Allowable Spread for Minor & Major Storm T MAX = ft Max. Allowable Depth at Gutter Flowline for Minor & Major Storm d MAX = inches Allow Flow Depth at Street Crown (leave blank for no) check = yes MINOR STORM Allowable Capacity is based on Depth Criterion Minor Storm Major Storm MAJOR STORM Allowable Capacity is based on Depth Criterion Q allow = cfs Minor storm max. allowable capacity GOOD - greater than flow given on sheet 'Q-Peak' Major storm max. allowable capacity GOOD - greater than flow given on sheet 'Q-Peak' Street & Inlet Capacities - DP 6-2 (Type R).xlsm, Q-Allow 12/8/2015, 12:53 PM
52 INLET ON A CONTINUOUS GRADE Project: Inlet ID: Fallbrook DP 6-2 Design Information (Input) MINOR MAJOR Type of Inlet Type = CDOT Type R Curb Opening Local Depression (additional to continuous gutter depression 'a' from 'Q-Allow') a LOCAL = inches Total Number of Units in the Inlet (Grate or Curb Opening) No = 1 1 Length of a Single Unit Inlet (Grate or Curb Opening) L o = ft Width of a Unit Grate (cannot be greater than W from Q-Allow) W o = N/A N/A ft Clogging Factor for a Single Unit Grate (typical min. value = 0.5) C f-g = N/A N/A Clogging Factor for a Single Unit Curb Opening (typical min. value = 0.1) C f-c = Street Hydraulics: OK - Q < maximum allowable from sheet 'Q-Allow' MINOR MAJOR Total Inlet Interception Capacity Q = cfs Total Inlet Carry-Over Flow (flow bypassing inlet) Q b = cfs Capture Percentage = Q a/q o = C% = % Street & Inlet Capacities - DP 6-2 (Type R).xlsm, Inlet On Grade 12/8/2015, 12:54 PM
53 DESIGN PEAK FLOW FOR ONE-HALF OF STREET OR GRASS-LINED CHANNEL BY THE RATIONAL METHOD Worksheet Protected Project: Inlet ID: Fallbrook DP 7-1 Show Details Design Flow: ONLY if already determined through other methods: Minor Storm Major Storm (local peak flow for 1/2 of street OR grass-lined channel): *Q Known = cfs * If you enter values in Row 14, skip the rest of this sheet and proceed to sheet Q-Allow or Area Inlet. Geographic Information: (Enter data in the blue cells): Subcatchment Area = Acres Percent Imperviousness = % NRCS Soil Type = Site Type: Flows Developed For: A, B, C, or D <--- FILL IN THIS SECTION OR FILL IN THE SECTIONS BELOW. <--- Site is Urban Street Inlets Slope (ft/ft) Length (ft) Site is Non-Urban Area Inlets in a Median Overland Flow = Channel Flow = Rainfall Information: Intensity I (inch/hr) = C 1 * P 1 / ( C 2 + T c ) ^ C 3 Minor Storm Major Storm Design Storm Return Period, T r = years Return Period One-Hour Precipitation, P 1 = inches C 1 = C 2 = C 3 = User-Defined Storm Runoff Coefficient (leave this blank to accept a calculated value), C = User-Defined 5-yr. Runoff Coefficient (leave this blank to accept a calculated value), C 5 = Bypass (Carry-Over) Flow from upstream Subcatchments, Q b = cfs Total Design Peak Flow, Q = cfs Street & Inlet Capacities - DP 7-1 (13 Valley).xlsm, Q-Peak 12/10/2015, 8:19 AM
54 INLET ON A CONTINUOUS GRADE Project: Inlet ID: Fallbrook DP 7-1 Design Information (Input) MINOR MAJOR Type of Inlet Type = CDOT/Denver 13 Valley Grate Local Depression (additional to continuous gutter depression 'a' from 'Q-Allow') a LOCAL = inches Total Number of Units in the Inlet (Grate or Curb Opening) No = 3 3 Length of a Single Unit Inlet (Grate or Curb Opening) L o = ft Width of a Unit Grate (cannot be greater than W from Q-Allow) W o = ft Clogging Factor for a Single Unit Grate (typical min. value = 0.5) C f-g = Clogging Factor for a Single Unit Curb Opening (typical min. value = 0.1) C f-c = N/A N/A Street Hydraulics: OK - Q < maximum allowable from sheet 'Q-Allow' MINOR MAJOR Total Inlet Interception Capacity Q = cfs Total Inlet Carry-Over Flow (flow bypassing inlet) Q b = cfs Capture Percentage = Q a/q o = C% = % Street & Inlet Capacities - DP 7-1 (13 Valley).xlsm, Inlet On Grade 12/10/2015, 8:21 AM
55 DESIGN PEAK FLOW FOR ONE-HALF OF STREET OR GRASS-LINED CHANNEL BY THE RATIONAL METHOD Worksheet Protected Project: Inlet ID: Fallbrook DP 7-2 Show Details Design Flow: ONLY if already determined through other methods: Minor Storm Major Storm (local peak flow for 1/2 of street OR grass-lined channel): *Q Known = cfs * If you enter values in Row 14, skip the rest of this sheet and proceed to sheet Q-Allow or Area Inlet. Geographic Information: (Enter data in the blue cells): Subcatchment Area = Acres Percent Imperviousness = % NRCS Soil Type = Site Type: Flows Developed For: A, B, C, or D <--- FILL IN THIS SECTION OR FILL IN THE SECTIONS BELOW. <--- Site is Urban Street Inlets Slope (ft/ft) Length (ft) Site is Non-Urban Area Inlets in a Median Overland Flow = Channel Flow = Rainfall Information: Intensity I (inch/hr) = C 1 * P 1 / ( C 2 + T c ) ^ C 3 Minor Storm Major Storm Design Storm Return Period, T r = years Return Period One-Hour Precipitation, P 1 = inches C 1 = C 2 = C 3 = User-Defined Storm Runoff Coefficient (leave this blank to accept a calculated value), C = User-Defined 5-yr. Runoff Coefficient (leave this blank to accept a calculated value), C 5 = Bypass (Carry-Over) Flow from upstream Subcatchments, Q b = cfs Total Design Peak Flow, Q = cfs Street & Inlet Capacities - DP 7-2 (Type R).xlsm, Q-Peak 12/8/2015, 3:18 PM
56 Project: Inlet ID: ALLOWABLE CAPACITY FOR ONE-HALF OF STREET (Minor & Major Storm) (Based on Regulated Criteria for Maximum Allowable Flow Depth and Spread) Fallbrook DP 7-2 Gutter Geometry (Enter data in the blue cells) Maximum Allowable Width for Spread Behind Curb T BACK = 15.0 ft Side Slope Behind Curb (leave blank for no conveyance credit behind curb) S BACK = ft/ft Manning's Roughness Behind Curb (typically between and 0.020) n BACK = Height of Curb at Gutter Flow Line H CURB = 6.00 inches Distance from Curb Face to Street Crown T CROWN = 19.0 ft Gutter Width W = 2.00 ft Street Transverse Slope S X = ft/ft Gutter Cross Slope (typically 2 inches over 24 inches or ft/ft) S W = ft/ft Street Longitudinal Slope - Enter 0 for sump condition S O = ft/ft Manning's Roughness for Street Section (typically between and 0.020) n STREET = Minor Storm Major Storm Max. Allowable Spread for Minor & Major Storm T MAX = ft Max. Allowable Depth at Gutter Flowline for Minor & Major Storm d MAX = inches Allow Flow Depth at Street Crown (leave blank for no) check = yes MINOR STORM Allowable Capacity is based on Depth Criterion Minor Storm Major Storm MAJOR STORM Allowable Capacity is based on Depth Criterion Q allow = cfs Minor storm max. allowable capacity GOOD - greater than flow given on sheet 'Q-Peak' Major storm max. allowable capacity GOOD - greater than flow given on sheet 'Q-Peak' Street & Inlet Capacities - DP 7-2 (Type R).xlsm, Q-Allow 12/8/2015, 3:17 PM
57 RELEVANT COLORADO BLVD. 100 YEAR WSEL ANALYSIS INLET ON A CONTINUOUS GRADE Project: Inlet ID: Fallbrook DP 7-2 Design Information (Input) MINOR MAJOR Type of Inlet Type = CDOT Type R Curb Opening Local Depression (additional to continuous gutter depression 'a' from 'Q-Allow') a LOCAL = inches Total Number of Units in the Inlet (Grate or Curb Opening) No = 3 3 Length of a Single Unit Inlet (Grate or Curb Opening) L o = ft Width of a Unit Grate (cannot be greater than W from Q-Allow) W o = N/A N/A ft Clogging Factor for a Single Unit Grate (typical min. value = 0.5) C f-g = N/A N/A Clogging Factor for a Single Unit Curb Opening (typical min. value = 0.1) C f-c = Street Hydraulics: OK - Q < maximum allowable from sheet 'Q-Allow' MINOR MAJOR Design Discharge for Half of Street (from Sheet Q-Peak ) Q o = cfs Water Spread Width T = ft Water Depth at Flowline (outside of local depression) d = inches Water Depth at Street Crown (or at T MAX) d CROWN = inches Ratio of Gutter Flow to Design Flow E o = Discharge outside the Gutter Section W, carried in Section T x Q x = cfs Discharge within the Gutter Section W Q w = cfs Discharge Behind the Curb Face Q BACK = cfs Flow Area within the Gutter Section W A W = sq ft Velocity within the Gutter Section W V W = fps Water Depth for Design Condition d LOCAL = inches Grate Analysis (Calculated) MINOR MAJOR Total Length of Inlet Grate Opening L = N/A N/A ft Ratio of Grate Flow to Design Flow E o-grate = N/A N/A Under No-Clogging Condition MINOR MAJOR Minimum Velocity Where Grate Splash-Over Begins V o = N/A N/A fps Interception Rate of Frontal Flow R f = N/A N/A Interception Rate of Side Flow R x = N/A N/A Interception Capacity Q i = N/A N/A cfs Under Clogging Condition MINOR MAJOR Clogging Coefficient for Multiple-unit Grate Inlet GrateCoef = N/A N/A Clogging Factor for Multiple-unit Grate Inlet GrateClog = N/A N/A Effective (unclogged) Length of Multiple-unit Grate Inlet L e = N/A N/A ft Minimum Velocity Where Grate Splash-Over Begins V o = N/A N/A fps Interception Rate of Frontal Flow R f = N/A N/A Interception Rate of Side Flow R x = N/A N/A Actual Interception Capacity Q a = N/A N/A cfs Carry-Over Flow = Q o-q a (to be applied to curb opening or next d/s inlet) Q b = N/A N/A cfs Curb or Slotted Inlet Opening Analysis (Calculated) MINOR MAJOR Equivalent Slope S e (based on grate carry-over) S e = ft/ft Required Length L T to Have 100% Interception L T = ft Under No-Clogging Condition MINOR MAJOR Effective Length of Curb Opening or Slotted Inlet (minimum of L, L T) L = ft Interception Capacity Q i = cfs Under Clogging Condition MINOR MAJOR Clogging Coefficient CurbCoef = Clogging Factor for Multiple-unit Curb Opening or Slotted Inlet CurbClog = Effective (Unclogged) Length L e = ft Actual Interception Capacity Q a = cfs Carry-Over Flow = Q b(grate)-q a Q b = cfs Summary MINOR MAJOR Total Inlet Interception Capacity Q = cfs Total Inlet Carry-Over Flow (flow bypassing inlet) Q b = cfs Capture Percentage = Q a/q o = C% = % Street & Inlet Capacities - DP 7-2 (Type R).xlsm, Inlet On Grade 5/4/2016, 4:05 PM
58 DESIGN PEAK FLOW FOR ONE-HALF OF STREET OR GRASS-LINED CHANNEL BY THE RATIONAL METHOD Worksheet Protected Project: Inlet ID: Fallbrook DP 8 Show Details Design Flow: ONLY if already determined through other methods: Minor Storm Major Storm (local peak flow for 1/2 of street OR grass-lined channel): *Q Known = cfs * If you enter values in Row 14, skip the rest of this sheet and proceed to sheet Q-Allow or Area Inlet. Geographic Information: (Enter data in the blue cells): Subcatchment Area = Acres Percent Imperviousness = % NRCS Soil Type = Site Type: Flows Developed For: A, B, C, or D <--- FILL IN THIS SECTION OR FILL IN THE SECTIONS BELOW. <--- Site is Urban Street Inlets Slope (ft/ft) Length (ft) Site is Non-Urban Area Inlets in a Median Overland Flow = Channel Flow = Rainfall Information: Intensity I (inch/hr) = C 1 * P 1 / ( C 2 + T c ) ^ C 3 Minor Storm Major Storm Design Storm Return Period, T r = years Return Period One-Hour Precipitation, P 1 = inches C 1 = C 2 = C 3 = User-Defined Storm Runoff Coefficient (leave this blank to accept a calculated value), C = User-Defined 5-yr. Runoff Coefficient (leave this blank to accept a calculated value), C 5 = Bypass (Carry-Over) Flow from upstream Subcatchments, Q b = cfs Total Design Peak Flow, Q = cfs Street & Inlet Capacities - DP 8 (Type R).xlsm, Q-Peak 2/11/2016, 9:03 AM
59 Project: Inlet ID: ALLOWABLE CAPACITY FOR ONE-HALF OF STREET (Minor & Major Storm) (Based on Regulated Criteria for Maximum Allowable Flow Depth and Spread) Fallbrook DP 8 Gutter Geometry (Enter data in the blue cells) Maximum Allowable Width for Spread Behind Curb T BACK = 12.5 ft Side Slope Behind Curb (leave blank for no conveyance credit behind curb) S BACK = ft/ft Manning's Roughness Behind Curb (typically between and 0.020) n BACK = Height of Curb at Gutter Flow Line H CURB = 6.00 inches Distance from Curb Face to Street Crown T CROWN = 17.0 ft Gutter Width W = 2.00 ft Street Transverse Slope S X = ft/ft Gutter Cross Slope (typically 2 inches over 24 inches or ft/ft) S W = ft/ft Street Longitudinal Slope - Enter 0 for sump condition S O = ft/ft Manning's Roughness for Street Section (typically between and 0.020) n STREET = Minor Storm Major Storm Max. Allowable Spread for Minor & Major Storm T MAX = ft Max. Allowable Depth at Gutter Flowline for Minor & Major Storm d MAX = inches Allow Flow Depth at Street Crown (leave blank for no) check = yes MINOR STORM Allowable Capacity is based on Depth Criterion Minor Storm Major Storm MAJOR STORM Allowable Capacity is based on Depth Criterion Q allow = SUMP SUMP cfs Minor storm max. allowable capacity GOOD - greater than flow given on sheet 'Q-Peak' Major storm max. allowable capacity GOOD - greater than flow given on sheet 'Q-Peak' Street & Inlet Capacities - DP 8 (Type R).xlsm, Q-Allow 12/8/2015, 3:19 PM
60 INLET IN A SUMP OR SAG LOCATION Project = Inlet ID = Fallbrook DP 8 H-Curb W W P H-Vert Lo (C) Wo Lo (G) Design Information (Input) MINOR MAJOR Type of Inlet Inlet Type = CDOT Type R Curb Opening Local Depression (additional to continuous gutter depression 'a' from 'Q-Allow') a local = inches Number of Unit Inlets (Grate or Curb Opening) No = 3 3 Water Depth at Flowline (outside of local depression) Ponding Depth = inches Grate Information MINOR MAJOR Override Depths Length of a Unit Grate L o (G) = N/A N/A feet Width of a Unit Grate W o = N/A N/A feet Area Opening Ratio for a Grate (typical values ) A ratio = N/A N/A Clogging Factor for a Single Grate (typical value ) C f (G) = N/A N/A Grate Weir Coefficient (typical value ) C w (G) = N/A N/A Grate Orifice Coefficient (typical value ) C o (G) = N/A N/A Curb Opening Information MINOR MAJOR Length of a Unit Curb Opening L o (C) = feet Height of Vertical Curb Opening in Inches H vert = inches Height of Curb Orifice Throat in Inches H throat = inches Angle of Throat (see USDCM Figure ST-5) Theta = degrees Side Width for Depression Pan (typically the gutter width of 2 feet) W p = feet Clogging Factor for a Single Curb Opening (typical value 0.10) C f (C) = Curb Opening Weir Coefficient (typical value ) C w (C) = Curb Opening Orifice Coefficient (typical value ) C o (C) = MINOR MAJOR Total Inlet Interception Capacity (assumes clogged condition) Q a = cfs WARNING: Inlet Capacity less than Q Peak for MAJOR Storm Q PEAK REQUIRED = cfs Street & Inlet Capacities - DP 8 (Type R).xlsm, Inlet In Sump 2/11/2016, 9:04 AM
61 DESIGN PEAK FLOW FOR ONE-HALF OF STREET OR GRASS-LINED CHANNEL BY THE RATIONAL METHOD Worksheet Protected Project: Inlet ID: Fallbrook DP 9 Show Details Design Flow: ONLY if already determined through other methods: Minor Storm Major Storm (local peak flow for 1/2 of street OR grass-lined channel): *Q Known = cfs * If you enter values in Row 14, skip the rest of this sheet and proceed to sheet Q-Allow or Area Inlet. Geographic Information: (Enter data in the blue cells): Subcatchment Area = Acres Percent Imperviousness = % NRCS Soil Type = Site Type: Flows Developed For: A, B, C, or D <--- FILL IN THIS SECTION OR FILL IN THE SECTIONS BELOW. <--- Site is Urban Street Inlets Slope (ft/ft) Length (ft) Site is Non-Urban Area Inlets in a Median Overland Flow = Channel Flow = Rainfall Information: Intensity I (inch/hr) = C 1 * P 1 / ( C 2 + T c ) ^ C 3 Minor Storm Major Storm Design Storm Return Period, T r = years Return Period One-Hour Precipitation, P 1 = inches C 1 = C 2 = C 3 = User-Defined Storm Runoff Coefficient (leave this blank to accept a calculated value), C = User-Defined 5-yr. Runoff Coefficient (leave this blank to accept a calculated value), C 5 = Bypass (Carry-Over) Flow from upstream Subcatchments, Q b = cfs Total Design Peak Flow, Q = cfs Street & Inlet Capacities - DP 9 (Type R).xlsm, Q-Peak 2/11/2016, 9:14 AM
62 Project: Inlet ID: ALLOWABLE CAPACITY FOR ONE-HALF OF STREET (Minor & Major Storm) (Based on Regulated Criteria for Maximum Allowable Flow Depth and Spread) Fallbrook DP 9 Gutter Geometry (Enter data in the blue cells) Maximum Allowable Width for Spread Behind Curb T BACK = 12.5 ft Side Slope Behind Curb (leave blank for no conveyance credit behind curb) S BACK = ft/ft Manning's Roughness Behind Curb (typically between and 0.020) n BACK = Height of Curb at Gutter Flow Line H CURB = 6.00 inches Distance from Curb Face to Street Crown T CROWN = 19.0 ft Gutter Width W = 2.00 ft Street Transverse Slope S X = ft/ft Gutter Cross Slope (typically 2 inches over 24 inches or ft/ft) S W = ft/ft Street Longitudinal Slope - Enter 0 for sump condition S O = ft/ft Manning's Roughness for Street Section (typically between and 0.020) n STREET = Minor Storm Major Storm Max. Allowable Spread for Minor & Major Storm T MAX = ft Max. Allowable Depth at Gutter Flowline for Minor & Major Storm d MAX = inches Allow Flow Depth at Street Crown (leave blank for no) check = yes MINOR STORM Allowable Capacity is based on Depth Criterion Minor Storm Major Storm MAJOR STORM Allowable Capacity is based on Depth Criterion Q allow = SUMP SUMP cfs Minor storm max. allowable capacity GOOD - greater than flow given on sheet 'Q-Peak' Major storm max. allowable capacity GOOD - greater than flow given on sheet 'Q-Peak' Street & Inlet Capacities - DP 9 (Type R).xlsm, Q-Allow 8/11/2015, 5:11 PM
63 INLET IN A SUMP OR SAG LOCATION Project = Inlet ID = Fallbrook DP 9 H-Curb W W P H-Vert Lo (C) Wo Lo (G) Design Information (Input) MINOR MAJOR Type of Inlet Inlet Type = CDOT Type R Curb Opening Local Depression (additional to continuous gutter depression 'a' from 'Q-Allow') a local = inches Number of Unit Inlets (Grate or Curb Opening) No = 1 1 Water Depth at Flowline (outside of local depression) Ponding Depth = inches Grate Information MINOR MAJOR Override Depths Length of a Unit Grate L o (G) = N/A N/A feet Width of a Unit Grate W o = N/A N/A feet Area Opening Ratio for a Grate (typical values ) A ratio = N/A N/A Clogging Factor for a Single Grate (typical value ) C f (G) = N/A N/A Grate Weir Coefficient (typical value ) C w (G) = N/A N/A Grate Orifice Coefficient (typical value ) C o (G) = N/A N/A Curb Opening Information MINOR MAJOR Length of a Unit Curb Opening L o (C) = feet Height of Vertical Curb Opening in Inches H vert = inches Height of Curb Orifice Throat in Inches H throat = inches Angle of Throat (see USDCM Figure ST-5) Theta = degrees Side Width for Depression Pan (typically the gutter width of 2 feet) W p = feet Clogging Factor for a Single Curb Opening (typical value 0.10) C f (C) = Curb Opening Weir Coefficient (typical value ) C w (C) = Curb Opening Orifice Coefficient (typical value ) C o (C) = MINOR MAJOR Total Inlet Interception Capacity (assumes clogged condition) Q a = cfs Inlet Capacity IS GOOD for Minor and Major Storms (>Q PEAK) Q PEAK REQUIRED = cfs Street & Inlet Capacities - DP 9 (Type R).xlsm, Inlet In Sump 2/11/2016, 9:16 AM
64 DESIGN PEAK FLOW FOR ONE-HALF OF STREET OR GRASS-LINED CHANNEL BY THE RATIONAL METHOD Worksheet Protected Project: Inlet ID: Fallbrook DP 10-1 Show Details Design Flow: ONLY if already determined through other methods: Minor Storm Major Storm (local peak flow for 1/2 of street OR grass-lined channel): *Q Known = cfs * If you enter values in Row 14, skip the rest of this sheet and proceed to sheet Q-Allow or Area Inlet. Geographic Information: (Enter data in the blue cells): Subcatchment Area = Acres Percent Imperviousness = % NRCS Soil Type = Site Type: Flows Developed For: A, B, C, or D <--- FILL IN THIS SECTION OR FILL IN THE SECTIONS BELOW. <--- Site is Urban Street Inlets Slope (ft/ft) Length (ft) Site is Non-Urban Area Inlets in a Median Overland Flow = Channel Flow = Rainfall Information: Intensity I (inch/hr) = C 1 * P 1 / ( C 2 + T c ) ^ C 3 Minor Storm Major Storm Design Storm Return Period, T r = years Return Period One-Hour Precipitation, P 1 = inches C 1 = C 2 = C 3 = User-Defined Storm Runoff Coefficient (leave this blank to accept a calculated value), C = User-Defined 5-yr. Runoff Coefficient (leave this blank to accept a calculated value), C 5 = Bypass (Carry-Over) Flow from upstream Subcatchments, Q b = cfs Total Design Peak Flow, Q = cfs Street & Inlet Capacities - DP 10-1 (Type R).xlsm, Q-Peak 12/8/2015, 3:26 PM
65 Project: Inlet ID: ALLOWABLE CAPACITY FOR ONE-HALF OF STREET (Minor & Major Storm) (Based on Regulated Criteria for Maximum Allowable Flow Depth and Spread) Fallbrook DP 10-1 Gutter Geometry (Enter data in the blue cells) Maximum Allowable Width for Spread Behind Curb T BACK = 12.5 ft Side Slope Behind Curb (leave blank for no conveyance credit behind curb) S BACK = ft/ft Manning's Roughness Behind Curb (typically between and 0.020) n BACK = Height of Curb at Gutter Flow Line H CURB = 6.00 inches Distance from Curb Face to Street Crown T CROWN = 17.0 ft Gutter Width W = 2.00 ft Street Transverse Slope S X = ft/ft Gutter Cross Slope (typically 2 inches over 24 inches or ft/ft) S W = ft/ft Street Longitudinal Slope - Enter 0 for sump condition S O = ft/ft Manning's Roughness for Street Section (typically between and 0.020) n STREET = Minor Storm Major Storm Max. Allowable Spread for Minor & Major Storm T MAX = ft Max. Allowable Depth at Gutter Flowline for Minor & Major Storm d MAX = inches Allow Flow Depth at Street Crown (leave blank for no) check = yes Maximum Capacity for 1/2 Street based On Allowable Spread Minor Storm Major Storm Water Depth without Gutter Depression (Eq. ST-2) y = inches Vertical Depth between Gutter Lip and Gutter Flowline (usually 2") d C = inches Gutter Depression (d C - (W * S x * 12)) a = inches Water Depth at Gutter Flowline d = inches Allowable Spread for Discharge outside the Gutter Section W (T - W) T X = ft Gutter Flow to Design Flow Ratio by FHWA HEC-22 method (Eq. ST-7) E O = Discharge outside the Gutter Section W, carried in Section T X Q X = cfs Discharge within the Gutter Section W (Q T - Q X ) Q W = cfs Discharge Behind the Curb (e.g., sidewalk, driveways, & lawns) Q BACK = cfs Maximum Flow Based On Allowable Spread Q T = SUMP SUMP cfs Flow Velocity within the Gutter Section V = fps V*d Product: Flow Velocity times Gutter Flowline Depth V*d = Maximum Capacity for 1/2 Street based on Allowable Depth Minor Storm Major Storm Theoretical Water Spread T TH = ft Theoretical Spread for Discharge outside the Gutter Section W (T - W) T X TH = ft Gutter Flow to Design Flow Ratio by FHWA HEC-22 method (Eq. ST-7) E O = Theoretical Discharge outside the Gutter Section W, carried in Section T X TH Q X TH = cfs Actual Discharge outside the Gutter Section W, (limited by distance T CROWN ) Q X = cfs Discharge within the Gutter Section W (Q d - Q X ) Q W = cfs Discharge Behind the Curb (e.g., sidewalk, driveways, & lawns) Q BACK = cfs Total Discharge for Major & Minor Storm (Pre-Safety Factor) Q = cfs Average Flow Velocity Within the Gutter Section V = fps V*d Product: Flow Velocity Times Gutter Flowline Depth V*d = Slope-Based Depth Safety Reduction Factor for Major & Minor (d > 6") Storm R = SUMP SUMP Max Flow Based on Allowable Depth (Safety Factor Applied) Q d = SUMP SUMP cfs Resultant Flow Depth at Gutter Flowline (Safety Factor Applied) d = inches Resultant Flow Depth at Street Crown (Safety Factor Applied) d CROWN = inches MINOR STORM Allowable Capacity is based on Depth Criterion Minor Storm Major Storm MAJOR STORM Allowable Capacity is based on Depth Criterion Q allow = SUMP SUMP cfs Minor storm max. allowable capacity GOOD - greater than flow given on sheet 'Q-Peak' Major storm max. allowable capacity GOOD - greater than flow given on sheet 'Q-Peak' Street & Inlet Capacities - DP 10-1 (Type R).xlsm, Q-Allow 12/8/2015, 3:26 PM
66 INLET IN A SUMP OR SAG LOCATION Project = Inlet ID = Fallbrook DP 10-1 H-Curb W W P H-Vert Lo (C) Wo Lo (G) Design Information (Input) MINOR MAJOR Type of Inlet Inlet Type = CDOT Type R Curb Opening Local Depression (additional to continuous gutter depression 'a' from 'Q-Allow') a local = inches Number of Unit Inlets (Grate or Curb Opening) No = 1 1 Water Depth at Flowline (outside of local depression) Ponding Depth = inches Grate Information MINOR MAJOR Override Depths Length of a Unit Grate L o (G) = N/A N/A feet Width of a Unit Grate W o = N/A N/A feet Area Opening Ratio for a Grate (typical values ) A ratio = N/A N/A Clogging Factor for a Single Grate (typical value ) C f (G) = N/A N/A Grate Weir Coefficient (typical value ) C w (G) = N/A N/A Grate Orifice Coefficient (typical value ) C o (G) = N/A N/A Curb Opening Information MINOR MAJOR Length of a Unit Curb Opening L o (C) = feet Height of Vertical Curb Opening in Inches H vert = inches Height of Curb Orifice Throat in Inches H throat = inches Angle of Throat (see USDCM Figure ST-5) Theta = degrees Side Width for Depression Pan (typically the gutter width of 2 feet) W p = feet Clogging Factor for a Single Curb Opening (typical value 0.10) C f (C) = Curb Opening Weir Coefficient (typical value ) C w (C) = Curb Opening Orifice Coefficient (typical value ) C o (C) = MINOR MAJOR Total Inlet Interception Capacity (assumes clogged condition) Q a = cfs Inlet Capacity IS GOOD for Minor and Major Storms (>Q PEAK) Q PEAK REQUIRED = cfs Street & Inlet Capacities - DP 10-1 (Type R).xlsm, Inlet In Sump 12/8/2015, 3:26 PM
67 DESIGN PEAK FLOW FOR ONE-HALF OF STREET OR GRASS-LINED CHANNEL BY THE RATIONAL METHOD Worksheet Protected Project: Inlet ID: Fallbrook DP 10-2 Show Details Design Flow: ONLY if already determined through other methods: Minor Storm Major Storm (local peak flow for 1/2 of street OR grass-lined channel): *Q Known = cfs * If you enter values in Row 14, skip the rest of this sheet and proceed to sheet Q-Allow or Area Inlet. Geographic Information: (Enter data in the blue cells): Subcatchment Area = Acres Percent Imperviousness = % NRCS Soil Type = Site Type: Flows Developed For: A, B, C, or D <--- FILL IN THIS SECTION OR FILL IN THE SECTIONS BELOW. <--- Site is Urban Street Inlets Slope (ft/ft) Length (ft) Site is Non-Urban Area Inlets in a Median Overland Flow = Channel Flow = Rainfall Information: Intensity I (inch/hr) = C 1 * P 1 / ( C 2 + T c ) ^ C 3 Minor Storm Major Storm Design Storm Return Period, T r = years Return Period One-Hour Precipitation, P 1 = inches C 1 = C 2 = C 3 = User-Defined Storm Runoff Coefficient (leave this blank to accept a calculated value), C = User-Defined 5-yr. Runoff Coefficient (leave this blank to accept a calculated value), C 5 = Bypass (Carry-Over) Flow from upstream Subcatchments, Q b = cfs Total Design Peak Flow, Q = cfs Street & Inlet Capacities - DP 10-2 (Type R).xlsm, Q-Peak 2/11/2016, 9:30 AM
68 Project: Inlet ID: ALLOWABLE CAPACITY FOR ONE-HALF OF STREET (Minor & Major Storm) (Based on Regulated Criteria for Maximum Allowable Flow Depth and Spread) Fallbrook DP 10-2 Gutter Geometry (Enter data in the blue cells) Maximum Allowable Width for Spread Behind Curb T BACK = 12.5 ft Side Slope Behind Curb (leave blank for no conveyance credit behind curb) S BACK = ft/ft Manning's Roughness Behind Curb (typically between and 0.020) n BACK = Height of Curb at Gutter Flow Line H CURB = 6.00 inches Distance from Curb Face to Street Crown T CROWN = 17.0 ft Gutter Width W = 2.00 ft Street Transverse Slope S X = ft/ft Gutter Cross Slope (typically 2 inches over 24 inches or ft/ft) S W = ft/ft Street Longitudinal Slope - Enter 0 for sump condition S O = ft/ft Manning's Roughness for Street Section (typically between and 0.020) n STREET = Minor Storm Major Storm Max. Allowable Spread for Minor & Major Storm T MAX = ft Max. Allowable Depth at Gutter Flowline for Minor & Major Storm d MAX = inches Allow Flow Depth at Street Crown (leave blank for no) check = yes Maximum Capacity for 1/2 Street based On Allowable Spread Minor Storm Major Storm Water Depth without Gutter Depression (Eq. ST-2) y = inches Vertical Depth between Gutter Lip and Gutter Flowline (usually 2") d C = inches Gutter Depression (d C - (W * S x * 12)) a = inches Water Depth at Gutter Flowline d = inches Allowable Spread for Discharge outside the Gutter Section W (T - W) T X = ft Gutter Flow to Design Flow Ratio by FHWA HEC-22 method (Eq. ST-7) E O = Discharge outside the Gutter Section W, carried in Section T X Q X = cfs Discharge within the Gutter Section W (Q T - Q X ) Q W = cfs Discharge Behind the Curb (e.g., sidewalk, driveways, & lawns) Q BACK = cfs Maximum Flow Based On Allowable Spread Q T = SUMP SUMP cfs Flow Velocity within the Gutter Section V = fps V*d Product: Flow Velocity times Gutter Flowline Depth V*d = Maximum Capacity for 1/2 Street based on Allowable Depth Minor Storm Major Storm Theoretical Water Spread T TH = ft Theoretical Spread for Discharge outside the Gutter Section W (T - W) T X TH = ft Gutter Flow to Design Flow Ratio by FHWA HEC-22 method (Eq. ST-7) E O = Theoretical Discharge outside the Gutter Section W, carried in Section T X TH Q X TH = cfs Actual Discharge outside the Gutter Section W, (limited by distance T CROWN ) Q X = cfs Discharge within the Gutter Section W (Q d - Q X ) Q W = cfs Discharge Behind the Curb (e.g., sidewalk, driveways, & lawns) Q BACK = cfs Total Discharge for Major & Minor Storm (Pre-Safety Factor) Q = cfs Average Flow Velocity Within the Gutter Section V = fps V*d Product: Flow Velocity Times Gutter Flowline Depth V*d = Slope-Based Depth Safety Reduction Factor for Major & Minor (d > 6") Storm R = SUMP SUMP Max Flow Based on Allowable Depth (Safety Factor Applied) Q d = SUMP SUMP cfs Resultant Flow Depth at Gutter Flowline (Safety Factor Applied) d = inches Resultant Flow Depth at Street Crown (Safety Factor Applied) d CROWN = inches MINOR STORM Allowable Capacity is based on Depth Criterion Minor Storm Major Storm MAJOR STORM Allowable Capacity is based on Depth Criterion Q allow = SUMP SUMP cfs Minor storm max. allowable capacity GOOD - greater than flow given on sheet 'Q-Peak' Major storm max. allowable capacity GOOD - greater than flow given on sheet 'Q-Peak' Street & Inlet Capacities - DP 10-2 (Type R).xlsm, Q-Allow 12/8/2015, 3:30 PM
69 INLET IN A SUMP OR SAG LOCATION Project = Inlet ID = Fallbrook DP 10-2 H-Curb W W P H-Vert Lo (C) Wo Lo (G) Design Information (Input) MINOR MAJOR Type of Inlet Inlet Type = CDOT Type R Curb Opening Local Depression (additional to continuous gutter depression 'a' from 'Q-Allow') a local = inches Number of Unit Inlets (Grate or Curb Opening) No = 1 1 Water Depth at Flowline (outside of local depression) Ponding Depth = inches Grate Information MINOR MAJOR Override Depths Length of a Unit Grate L o (G) = N/A N/A feet Width of a Unit Grate W o = N/A N/A feet Area Opening Ratio for a Grate (typical values ) A ratio = N/A N/A Clogging Factor for a Single Grate (typical value ) C f (G) = N/A N/A Grate Weir Coefficient (typical value ) C w (G) = N/A N/A Grate Orifice Coefficient (typical value ) C o (G) = N/A N/A Curb Opening Information MINOR MAJOR Length of a Unit Curb Opening L o (C) = feet Height of Vertical Curb Opening in Inches H vert = inches Height of Curb Orifice Throat in Inches H throat = inches Angle of Throat (see USDCM Figure ST-5) Theta = degrees Side Width for Depression Pan (typically the gutter width of 2 feet) W p = feet Clogging Factor for a Single Curb Opening (typical value 0.10) C f (C) = Curb Opening Weir Coefficient (typical value ) C w (C) = Curb Opening Orifice Coefficient (typical value ) C o (C) = MINOR MAJOR Total Inlet Interception Capacity (assumes clogged condition) Q a = cfs Inlet Capacity IS GOOD for Minor and Major Storms (>Q PEAK) Q PEAK REQUIRED = cfs Street & Inlet Capacities - DP 10-2 (Type R).xlsm, Inlet In Sump 2/11/2016, 9:30 AM
70 Channel Report Hydraflow Express Extension for Autodesk AutoCAD Civil 3D by Autodesk, Inc. Wednesday, Dec Alley X User-defined Invert Elev (ft) = 0.67 Slope (%) = 1.88 N-Value = Composite Calculations Compute by: Q vs Depth No. Increments = 10 (Sta, El, n)-(sta, El, n)... ( 0.00, 1.00)-(8.00, 0.67, 0.016)-(16.00, 0.83, 0.016)-(16.00, 1.00, 0.016) Highlighted Depth (ft) = 0.33 Q (cfs) = Area (sqft) = 4.00 Velocity (ft/s) = 4.99 Wetted Perim (ft) = Crit Depth, Yc (ft) = 0.33 Top Width (ft) = EGL (ft) = 0.72 Elev (ft) Section Depth (ft) Sta (ft)
71 Channel Report Hydraflow Express Extension for Autodesk AutoCAD Civil 3D by Autodesk, Inc. Wednesday, Dec Alley U User-defined Invert Elev (ft) = 0.67 Slope (%) = 1.60 N-Value = Composite Calculations Compute by: Q vs Depth No. Increments = 10 (Sta, El, n)-(sta, El, n)... ( 0.00, 1.00)-(8.00, 0.67, 0.016)-(16.00, 0.83, 0.016)-(16.00, 1.00, 0.016) Highlighted Depth (ft) = 0.33 Q (cfs) = Area (sqft) = 4.00 Velocity (ft/s) = 4.60 Wetted Perim (ft) = Crit Depth, Yc (ft) = 0.33 Top Width (ft) = EGL (ft) = 0.66 Elev (ft) Section Depth (ft) Sta (ft)
72 Channel Report Hydraflow Express Extension for Autodesk AutoCAD Civil 3D by Autodesk, Inc. Wednesday, Dec Alley T User-defined Invert Elev (ft) = 0.67 Slope (%) = 2.06 N-Value = Composite Calculations Compute by: Q vs Depth No. Increments = 10 (Sta, El, n)-(sta, El, n)... ( 0.00, 1.00)-(8.00, 0.67, 0.016)-(16.00, 0.83, 0.016)-(16.00, 1.00, 0.016) Highlighted Depth (ft) = 0.33 Q (cfs) = Area (sqft) = 4.00 Velocity (ft/s) = 5.22 Wetted Perim (ft) = Crit Depth, Yc (ft) = 0.33 Top Width (ft) = EGL (ft) = 0.75 Elev (ft) Section Depth (ft) Sta (ft)
73 Channel Report Hydraflow Express Extension for Autodesk AutoCAD Civil 3D by Autodesk, Inc. Wednesday, Dec Alley L User-defined Invert Elev (ft) = 0.67 Slope (%) = 1.65 N-Value = Composite Calculations Compute by: Q vs Depth No. Increments = 10 (Sta, El, n)-(sta, El, n)... ( 0.00, 1.00)-(8.00, 0.67, 0.016)-(16.00, 0.83, 0.016)-(16.00, 1.00, 0.016) Highlighted Depth (ft) = 0.33 Q (cfs) = Area (sqft) = 4.00 Velocity (ft/s) = 4.68 Wetted Perim (ft) = Crit Depth, Yc (ft) = 0.33 Top Width (ft) = EGL (ft) = 0.67 Elev (ft) Section Depth (ft) Sta (ft)
74 Channel Report Hydraflow Express Extension for Autodesk AutoCAD Civil 3D by Autodesk, Inc. Wednesday, Dec Alley E User-defined Invert Elev (ft) = 0.67 Slope (%) = 1.00 N-Value = Composite Calculations Compute by: Q vs Depth No. Increments = 10 (Sta, El, n)-(sta, El, n)... ( 0.00, 1.00)-(8.00, 0.67, 0.016)-(16.00, 0.83, 0.016)-(16.00, 1.00, 0.016) Highlighted Depth (ft) = 0.33 Q (cfs) = Area (sqft) = 4.00 Velocity (ft/s) = 3.64 Wetted Perim (ft) = Crit Depth, Yc (ft) = 0.33 Top Width (ft) = EGL (ft) = 0.54 Elev (ft) Section Depth (ft) Sta (ft)
75 Channel Report Hydraflow Express Extension for Autodesk AutoCAD Civil 3D by Autodesk, Inc. Wednesday, Dec Alley D User-defined Invert Elev (ft) = 0.67 Slope (%) = 1.00 N-Value = Composite Calculations Compute by: Q vs Depth No. Increments = 10 (Sta, El, n)-(sta, El, n)... ( 0.00, 1.00)-(8.00, 0.67, 0.016)-(16.00, 0.83, 0.016)-(16.00, 1.00, 0.016) Highlighted Depth (ft) = 0.33 Q (cfs) = Area (sqft) = 4.00 Velocity (ft/s) = 3.64 Wetted Perim (ft) = Crit Depth, Yc (ft) = 0.33 Top Width (ft) = EGL (ft) = 0.54 Elev (ft) Section Depth (ft) Sta (ft)
76 Channel Report Hydraflow Express Extension for Autodesk AutoCAD Civil 3D by Autodesk, Inc. Monday, Feb Fallbrook 3 - North Swale Capacity Triangular Side Slopes (z:1) = 5.00, 5.00 Total Depth (ft) = 0.60 Invert Elev (ft) = 1.00 Slope (%) = 3.10 N-Value = Calculations Compute by: Known Q Known Q (cfs) = 3.90 Highlighted Depth (ft) = 0.52 Q (cfs) = Area (sqft) = 1.35 Velocity (ft/s) = 2.88 Wetted Perim (ft) = 5.30 Crit Depth, Yc (ft) = 0.52 Top Width (ft) = 5.20 EGL (ft) = 0.65 Elev (ft) Section Depth (ft) Reach (ft)
77
78
79
80
81
82
83
84
85
86
87
88
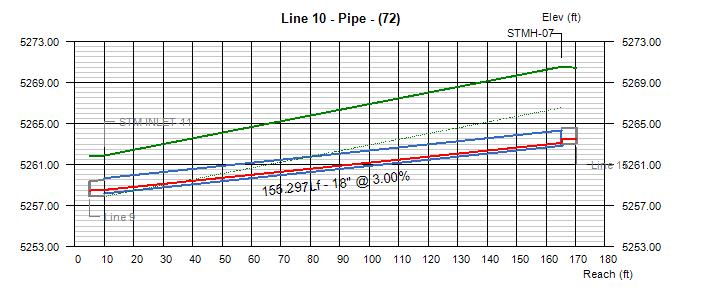
89
90
91
92
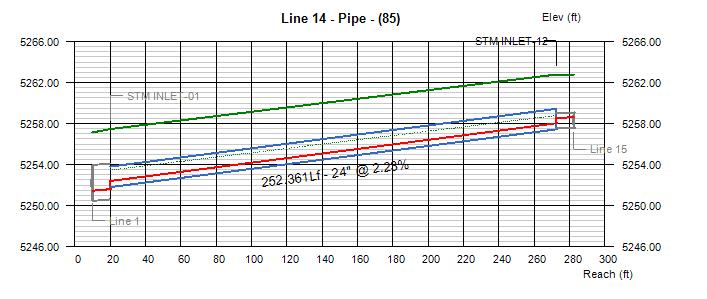

93

94
95
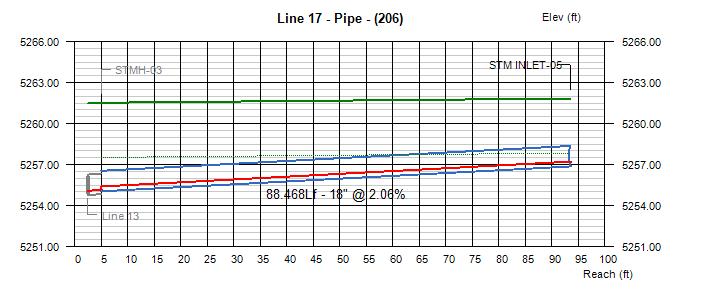
96
97
98
99

100
101
102
103
104
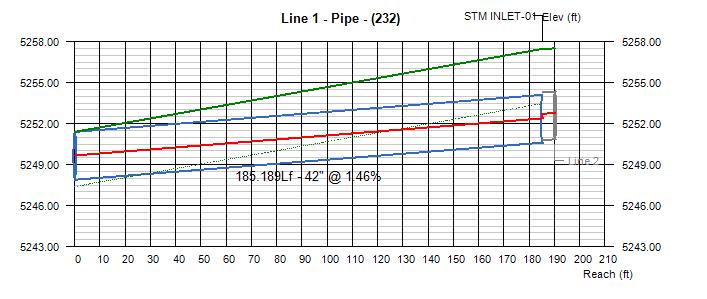
105
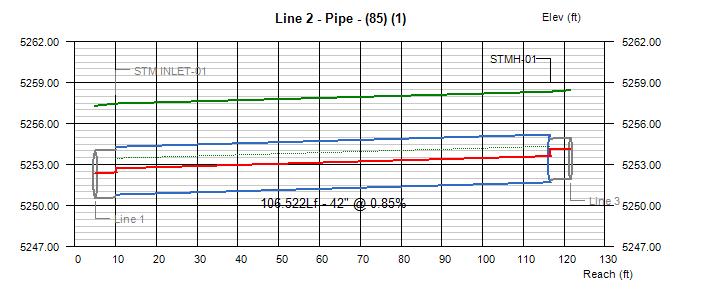
106
107
108
109
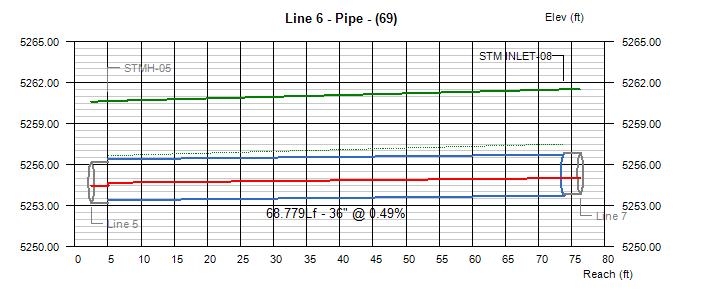
110
111
112
113
114
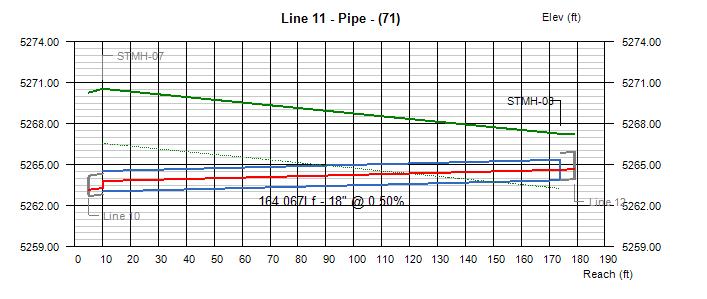
115

116
117
118
119
120
121
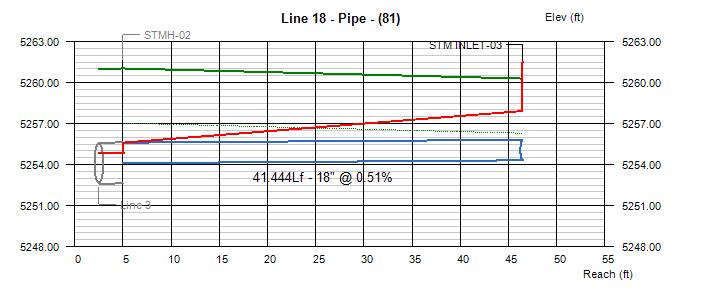
122
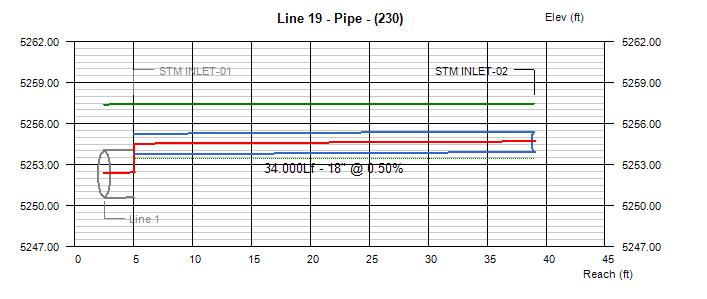
123
124
125
126
127
128 APPENDIX C Reference Materials Effective FEMA Map Panels NRCS Soil Information t f West 2 nd Avenue, Denver, Colorado
129

130 104 56' 38'' W Custom Soil Resource Report Map Hydrologic Soil Group ' 23'' W 39 57' 14'' N ' 14'' N ' 59'' N ' 59'' N ' 38'' W N Map Scale: 1:2,340 if printed on A portrait (8.5" x 11") sheet. Meters Feet Map projection: Web Mercator Corner coordinates: WGS84 Edge tics: UTM Zone 13N WGS ' 23'' W
131 Custom Soil Resource Report MAP LEGEND MAP INFORMATION Area of Interest (AOI) Area of Interest (AOI) Soils Soil Rating Polygons A A/D B B/D C C/D D Not rated or not available Soil Rating Lines A A/D B B/D C C/D D Not rated or not available Soil Rating Points A A/D B B/D C C/D D Not rated or not available Water Features Streams and Canals Transportation Rails Interstate Highways US Routes Major Roads Local Roads Background Aerial Photography The soil surveys that comprise your AOI were mapped at 1:20,000. Warning: Soil Map may not be valid at this scale. Enlargement of maps beyond the scale of mapping can cause misunderstanding of the detail of mapping and accuracy of soil line placement. The maps do not show the small areas of contrasting soils that could have been shown at a more detailed scale. Please rely on the bar scale on each map sheet for map measurements. Source of Map: Natural Resources Conservation Service Web Soil Survey URL: Coordinate System: Web Mercator (EPSG:3857) Maps from the Web Soil Survey are based on the Web Mercator projection, which preserves direction and shape but distorts distance and area. A projection that preserves area, such as the Albers equal-area conic projection, should be used if more accurate calculations of distance or area are required. This product is generated from the USDA-NRCS certified data as of the version date(s) listed below. Soil Survey Area: Adams County Area, Parts of Adams and Denver Counties, Colorado Survey Area Data: Version 11, Sep 23, 2014 Soil map units are labeled (as space allows) for map scales 1:50,000 or larger. Date(s) aerial images were photographed: 18, 2014 Mar 16, 2012 Sep The orthophoto or other base map on which the soil lines were compiled and digitized probably differs from the background imagery displayed on these maps. As a result, some minor shifting of map unit boundaries may be evident. 18
132 Custom Soil Resource Report Table Hydrologic Soil Group Hydrologic Soil Group Summary by Map Unit Adams County Area, Parts of Adams and Denver Counties, Colorado (CO001) Map unit symbol Map unit name Rating Acres in AOI Percent of AOI PlC Platner loam, 3 to 5 percent slopes C % UlD Ulm loam, 5 to 9 percent slopes C % Totals for Area of Interest % Rating Options Hydrologic Soil Group Aggregation Method: Dominant Condition Component Percent Cutoff: None Specified Tie-break Rule: Higher 19
133 APPENDIX D Maps Historic Basin Map Developed Basin Map t f West 2 nd Avenue, Denver, Colorado
134


135