Public Document - Trade Secret Data has Been Excised APPENDIX A NOISE ANALYSIS FOR THE PROPOSED BLAZING STAR 2 WIND FARM
|
|
|
- Percival Dean
- 5 years ago
- Views:
Transcription
1 APPENDIX A NOISE ANALYSIS FOR THE PROPOSED BLAZING STAR 2 WIND FARM


2 PRELIMINARY NOISE COMPLIANCE REPORT BLAZING STAR WIND FARM PREPARED FOR: BLAZING STAR WIND FARM 2, LLC 55 Railroad Row White River Junction, VT SUBMITTED BY: RSG IN COOPERATION WITH: MERJENT PROPRIETARY INFORMATION IN APPENDIX B EXCLUDED
3

4 BLAZING STAR WIND FARM 2 PREPARED FOR: BLAZING STAR WIND FARM 2, LLC CONTENTS 1.0 INTRODUCTION PROJECT DESCRIPTION SOUND LEVEL STANDARDS & GUIDELINES Local Standards State Standards WIND TURBINE ACOUSTICS SPECIAL CONSIDERATIONS Sources of Sound Generation by Wind Turbines Amplitude Modulation Meteorology Masking Infrasound and Low Frequency Sound Use of Sound Level Weighting Networks for Wind Turbine Sound SOUND LEVEL MONITORING PROCEDURES Equipment Data Processing Monitor Location Descriptions North Monitor South Monitor Northwest Monitor West Monitor Offsite C Monitor i
5 Offsite D Monitor SOUND LEVEL MONITORING RESULTS Results Summary Exclusion Periods Sound Levels Meteorology Monitoring Results for The North Monitor Monitoring Results for the South Monitor Monitoring Results for the Northwest Monitor Monitoring Results for the West Monitor Monitoring Results for the Offsite C Monitor Monitoring Results for the Offsite D Monitor SOUND PROPAGATION MODELING PROCEDURES SOUND PROPAGATION MODELING RESULTS Overall A-weighted Model Results Model Results Added to Background L CONCLUSIONS APPENDIX A: ACOUSTICS PRIMER APPENDIX B: SOURCE INFORMATION APPENDIX C: RECEIVER INFORMATION List of Figures FIGURE 1: BLAZING STAR WIND FARM AREA MAP... 3 FIGURE 2: AIRFLOW AROUND A ROTOR BLADE... 6 FIGURE 3: SCHEMATIC OF THE REFRACTION OF SOUND DUE TO VERTICAL WIND GRADIENT (WIND SHEAR)... 7 FIGURE 4: COMPARISON OF NORMALIZED FREQUENCY SPECTRA FROM THE WIND AND THE ACCIONA AW132 3 MW... 8 FIGURE 5: INFRASOUND FROM A WIND TURBINE AT 350 METERS (1,148 FEET) COMPARED WITH PERCEPTION THESHOLDS... 9 FIGURE 6: MONITORING LOCATION MAP FIGURE 7: PHOTOGRAPH OF THE NORTH MONITOR LOOKING NORTHWARD FIGURE 8: NORTH MONITOR LOCATION AERIAL VIEW FIGURE 9: PHOTOGRAPH OF THE SOUTH MONITOR LOOKING NORTHWARD FIGURE 10: SOUTH MONITOR LOCATION AERIAL VIEW FIGURE 11: PHOTOGRAPH OF THE NORTHWEST MONITOR LOOKING EASTWARD FIGURE 12: NORTHWEST MONITOR LOCATION AERIAL VIEW FIGURE 13: PHOTOGRAPH OF THE WEST MONITOR LOOKING NORTHWARD ii October 31, 2017
6 FIGURE 14: WEST MONITOR LOCATION AERIAL VIEW FIGURE 15: PHOTOGRAPH OF THE OFFSITE C MONITOR LOOKING EASTWARD FIGURE 16: OFFSITE C MONITOR LOCATION AERIAL VIEW FIGURE 17: PHOTOGRAPH OF THE OFFSITE A MONITOR LOOKING NORTHWARD FIGURE 18: OFFSITE D MONITOR LOCATION AERIAL VIEW FIGURE 19. PRE-CONSTRUCTION MONITORING RESULTS AT THE NORTH MONITOR FIGURE 20. PRECONSTRUCTION MONITORING RESULTS AT THE SOUTH MONITOR FIGURE 21: SOUTH MONITOR - 1/3 OCTAVE BAND AND OVERALL STATISTICAL SOUND LEVELS AT 9 M/S 85-METER (279-FOOT) HEIGHT WIND SPEED FIGURE 22. PRE-CONSTRUCTION MONITORING RESULTS FOR THE NORTHWEST MONITOR FIGURE 23. PRECONSTRUCTION RESULTS FOR THE WEST MONITOR FIGURE 24. PRE-CONSTRUCTION RESULTS FOR THE OFFSITE C MONITOR FIGURE 25: OFFSITE C - 1/3 OCTAVE BAND AND OVERALL STATISTICAL SOUND LEVELS AT 9 M/S 85-METER (279- FOOT) HEIGHT WIND SPEED FIGURE 26. PRECONSTRUCTION RESULTS FOR THE OFFSITE D MONITOR FIGURE 27: OFFSITE D - 1/3 OCTAVE BAND AND OVERALL STATISTICAL SOUND LEVELS AT 9 M/S 85-METER (279- FOOT) HEIGHT WIND SPEED FIGURE 28: ACCIONA AW MW SOUND PROPAGATION MODELING RESULTS FIGURE 29: GAMESA G MW SOUND PROPAGATION MODELING RESULTS FIGURE 30: GE LNTE SOUND PROPAGATION MODELING RESULTS FIGURE 31: VESTAS V110 STE 2.0 MW SOUND PROPAGATION MODELING RESULTS FIGURE 32: A SCALE OF SOUND PRESSURE LEVELS FOR TYPICAL SOUND SOURCES FIGURE 33: EXAMPLE OF DESCRIPTIVE TERMS OF SOUND MEASUREMENT OVER TIME FIGURE 34: SOURCE LOCATIONS NORTHERN HALF FIGURE 35: SOURCE LOCATIONS SOUTHERN HALF FIGURE 36: RECEIVER LOCATIONS SOUTHEASTERN AREA FIGURE 37: RECEIVER LOCATIONS NORTHEASTERN AREA FIGURE 38: RECEIVER LOCATIONS WESTERN AREA FIGURE 39: RECEIVER LOCATIONS LAKE SHAOKATAN AREA FIGURE 40: RECEIVER LOCATIONS LAKE HENDRICKS List of Tables TABLE 1: SOUND LEVEL LIMITS (DBA) FROM MN RULES TABLE 2: SOUND MONITOR SPECIFICATIONS BY SITE TABLE 3. SUMMARY OF EXCLUSION PERIODS AT EACH MONITOR TABLE 4. PRECONSTRUCTION MONITORING SUMMARY (A-WEIGHTED RESULTS) TABLE 5. PRECONSTRUCTION MONITORING SUMMARY (C-WEIGHTED RESULTS) TABLE 6. SUMMARY OF MEASURED 10-MINUTE 1.5-METER (5-FOOT) WIND SPEEDS TABLE 7: MODEL RESULTS SUMMARY TABLE 8: MODEL RESULTS (DBA) SUMMED WITH MONITORED BACKROUND SOUND LEVELS (L50, DBA) TABLE 9: SOUND PROPAGATION MODELING PARAMETERS iii
7 TABLE 10: TURBINE HUB HEIGHT AND 1/1 OCTAVE BAND MODELED TURBINE SPECTRA (DBZ UNLESS OTHERWISE INDICATED) TABLE 11: TURBINE SOUND POWER LEVEL & LOCATIONS - ACCIONA AW TABLE 12: TURBINE SOUND POWER LEVEL & LOCATIONS - GAMESA G TABLE 13: TURBINE SOUND POWER LEVEL & LOCATIONS GE LNTE TABLE 14: TURBINE SOUND POWER LEVEL & LOCATIONS - VESTAS V TABLE 15: DISCRETE RECEIVER RESULTS WITH AND WITHOUT BACKGROUND SOUND LEVELS - ACCIONA AW TABLE 16: DISCRETE RECEIVER RESULTS - WITH AND WITHOUT BACKGROUND SOUND LEVEL GE LNTE TABLE 17: DISCRETE RECEIVER RESULTS - WITH AND WITHOUT BACKGROUND SOUND LEVELS - GAMESA G TABLE 18: DISCRETE RECEIVER RESULTS - WITH AND WITHOUT BACKGROUND SOUND LEVELS - VESTAS V110 STE130 iv October 31, 2017
8 1.0 INTRODUCTION Blazing Star Wind Farm, LLC previously applied for and received a permit for phase one (Blazing Star) of a wind power generation facility in Lincoln County, Minnesota. Blazing Star Wind Farm 2, LLC is currently submitting a Site Permit Application (SPA) to the Minnesota Public Utilities Commission (PUC) to build a second phase (Blazing Star 2) adjacent to the already permitted facility. Blazing Star 2 will involve the construction of up to 100 wind turbines for a rating of up to 200 MW. The turbines would be installed in an area southwest, west, and northwest of Ivanhoe and east, southeast, and south of Hendricks. Most of the wind turbines would be west of US Route 75 except in the northeast and southeast corners of the project area. For the SPA, RSG has performed a preliminary noise compliance assessment of the project based on the preliminary turbine layout. Included in this report are: A description of the project; A discussion of sound level standards; A discussion of sound issues that are particular to wind farms; Background sound level monitoring procedure and results; Sound propagation modeling procedures and results; and Conclusions. Appendix A includes a primer on the science of sound, including descriptions of some of the acoustical terms used in this report. 1
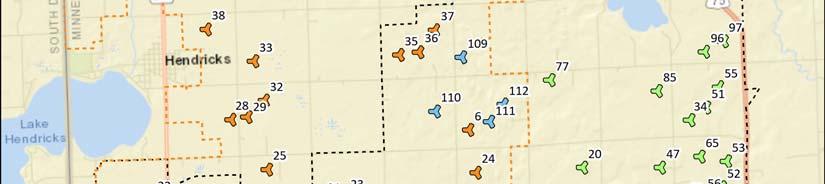
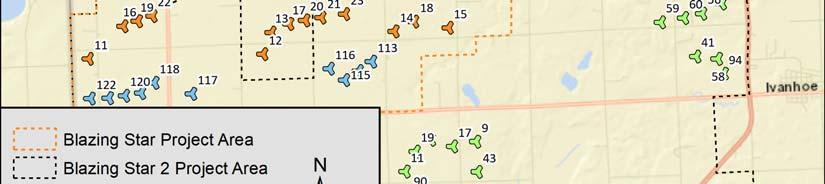
9 Blazing Star Wind Farm 2, LLC Blazing Star Wind Farm 2 Public Document - Trade Secret Data has Been Excised PRELIMINARY NOISE COMPLIANCE REPORT 2.0 PROJECT DESCRIPTION Blazing Star 2 will be located in Lincoln County, Minnesota. The project area is generally located to the northwest, west, and southwest of Ivanhoe and east, southeast, and south of Hendricks. The northern extent of the project area is near corner of US Route 75 and County Road 19. On the north and south ends of the project, the project area extends as far east as County Road 5, but in the middle, the project area remains west of US Route 75. Towards the south, the project extends as far west as the South Dakota state line. The project areas for Blazing Star and Blazing Star 2 overlap in the middle of the project area as shown in Figure 1. Also shown in Figure 1, are the proposed turbines for Blazing Star 2, shown in green, along with the approved turbines for Blazing Star, shown in orange. There are 15 turbines, shown in blue, that were previously approved as part of Blazing Star, but are also included in the SPA for Blazing Star 2. Blazing Star 2 is designed to include up to 100 turbines, with hub heights between 80 and 95 meters (262 and 312 feet). The area around the project is composed primarily of agricultural land uses (primarily corn, soybean, and dairy) with farm residences. Terrain in the area is mostly flat in the southern part of the project, with more rolling terrain in the northern part of the project. The City of Ivanhoe is located to the east of the project, and the closest proposed turbine location to the city is approximately 1.3 kilometers (4,300 feet) west of North Wallace Street. Land uses within the city are primarily residential and commercial. There is a school on the northwestern edge of the city on North Wallace Street. The City of Hendricks, to the west, is over a mile from any Blazing Star 2 turbines. 2 October 31, 2017


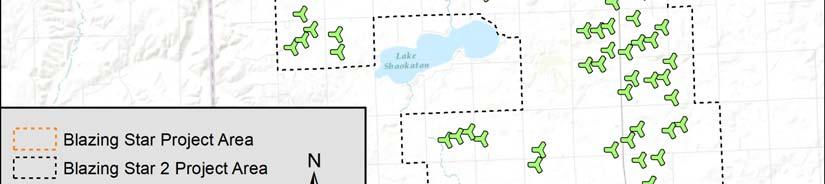
10 FIGURE 1: BLAZING STAR WIND FARM AREA MAP 3
11 Blazing Star Wind Farm 2, LLC Blazing Star Wind Farm 2 Public Document - Trade Secret Data has Been Excised PRELIMINARY NOISE COMPLIANCE REPORT 3.0 SOUND LEVEL STANDARDS & GUIDELINES 3.1 LOCAL STANDARDS Locally, Lincoln County Comprehensive Development Ordinance No. 40 regulates noise from wind power in Section 9, Subdivision 700: Noise regulated by Minnesota Pollution Control Agency under Chapter These rules establish the maximum night and daytime noise levels that effectively limit wind turbine noise to fifty (50) db (A) at farm residences. However, these standards may not be sufficient for the preservation of public health and welfare in relation to impulsive noises. Additional local limits relative to impulsive and pure tone noises may be appropriate. 3.2 STATE STANDARDS Minnesota Statute charges the Pollution Control Agency with adopting noise standards. These standards are set in Minnesota Rules Chapter 7030, for which a wind power project needs to demonstrate it will be in compliance with to receive a site permit from PUC. The Rule provides daytime and nighttime 1 sound level limits (Table 1) for a variety of land uses, which are grouped into three categories identified by a Noise Area Classification. The sensitive land uses around the Blazing Star 2 project area are primarily within Noise Area Classification 1 which includes residences including farm houses, and contain the most restrictive sound limits. TABLE 1: SOUND LEVEL LIMITS (dba) FROM MN RULES Noise Area Classification Daytime Nighttime L 50 L 10 L 50 L The Rule says that the limits are for the preservation of public health and welfare and that they are consistent with speech, sleep, annoyance, and hearing conservation requirements, but that they do not, by themselves, identify the limiting levels of impulsive noise 2 needed for the preservation of public health and welfare. 1 MN Rules define daytime as 7:00 a.m. to 10:00 p.m. and nighttime as 10:00 p.m. to 7:00 a.m. 2 Impulsive noise is defined in Minnesota Rules Chapter Typical, wind turbine sound at the distance of a residential receiver is not considered impulsive. 4 October 31, 2017
12 4.0 WIND TURBINE ACOUSTICS SPECIAL CONSIDERATIONS 4.1 SOURCES OF SOUND GENERATION BY WIND TURBINES Wind turbines generate two principle types of sound: aerodynamic, produced from the flow of air around the blades, and mechanical, produced from mechanical and electrical components within the nacelle. Aerodynamic sound is the primary source of sound associated with wind turbines. These acoustic emissions can be either tonal or broadband. Tonal sound occurs at discrete frequencies, whereas broadband sound is distributed with little peaking across the frequency spectrum. While unusual, tonal sound can also originate from unstable air flows over holes, slits, or blunt trailing edges on blades. The majority of audible aerodynamic sound from wind turbines is broadband at the middle frequencies, roughly between 200 Hz and 1,000 Hz. Wind turbines emit aerodynamic broadband sound as the rotating blades interact with atmospheric turbulence and as air flows along their surfaces. This produces a characteristic whooshing sound through several mechanisms (Figure 2): Inflow turbulence sound occurs when the rotor blades encounter atmospheric turbulence as they pass through the air. Uneven pressure on a rotor blade causes variations in the local angle of attack, which affects the lift and drag forces, causing aerodynamic loading fluctuations. This generates sound that varies across a wide range of frequencies but is most significant at frequencies below 500 Hz. Trailing edge sound is produced as boundary-layer turbulence as the air passes into the wake, or trailing edge, of the blade. This sound is distributed across a wide frequency range but is most notable at high frequencies between 700 Hz and 2 khz. Tip vortex sound occurs when tip turbulence interacts with the surface of the blade tip. While this is audible near the turbine, it tends to be a small component of the overall sound further away. Stall or separation sound occurs due to the interaction of turbulence with the blade surface. 5

13 Blazing Star Wind Farm 2, LLC Blazing Star Wind Farm 2 Public Document - Trade Secret Data has Been Excised PRELIMINARY NOISE COMPLIANCE REPORT Leading edge separation Tip vortex Trailing edge flow Inflow turbulence Wake wind Surface boundary layer FIGURE 2: AIRFLOW AROUND A ROTOR BLADE Mechanical sound from machinery inside the nacelle tends to be tonal in nature but can also have a broadband component. Potential sources of mechanical sound include the gearbox, generator, yaw drives, cooling fans, and auxiliary equipment. These components are housed within the nacelle, whose surfaces, if untreated, radiate the resulting sound. However modern wind turbines have nacelles that are designed to reduce the transmission of internal sound, and rarely is this a significant portion of the total wind turbine sound. 4.2 AMPLITUDE MODULATION Amplitude modulation (AM) is a fluctuation in sound level that occurs at the blade passage frequency. There is no consistent definition how much of a sound level fluctuation is necessary for blade swish to be considered AM. Fluctuations in individual 1/3 octave bands are typically greater. Fluctuations in individual 1/3 octave bands can sometimes synchronize and desynchronize over periods, leading to increases and decreases in magnitude of the A- weighted fluctuations. Similarly, in wind farms with multiple turbines, fluctuations can synchronize and desynchronize, leading to variations in amplitude modulation depth. 3 Most amplitude modulation is in the mid-frequencies and most overall A-weighted AM is less than 4.5 db in depth. 4 There are many confirmed and hypothesized causes of amplitude modulation including: blade passage in front of the tower, blade tip sound emission directivity, wind shear, inflow turbulence, and turbine blade yaw error. It has recently been noted that although wind shear can contribute to the extent of amplitude modulation, wind shear does not contribute to the existence of amplitude modulation in and of itself. Instead, there needs to be detachment of 3 McCunney, Robert, et al. Wind Turbines and Health: A Critical Review of the Scientific Literature. Journal of Occupational and Environmental Medicine. 56(11) November 2014: pp. e108-e RSG, et al., Massachusetts Study on Wind Turbine Acoustics, Massachusetts Clean Energy Center and Massachusetts Department of Environmental Protection, October 31, 2017
14 airflow from the blades for wind shear to contribute to amplitude modulation. 5 While factors like the blade passing in front of the tower are intrinsic to wind turbine design, other factors vary with turbine design, local meteorology, topography, and turbine layout. Mountainous areas, for example, are more likely to have turbulent airflow, less likely to have high wind shear, and less likely to have turbine layouts that allow for blade passage synchronization for multiple turbines. Amplitude modulation extent varies with the relative location of a receptor to the turbine. Amplitude Modulation is usually experienced most when the receptor is between 45 and 60 degrees from the downwind or upwind position and is experienced least directly with the receptor directly upwind or downwind of the turbines. 4.3 METEOROLOGY Meteorological conditions can significantly affect sound propagation. The two most important conditions to consider are wind shear and temperature lapse. Wind shear is the difference in wind speeds by elevation and temperature lapse rate is the temperature gradient by elevation. In conditions with high wind shear (large wind speed gradient), sound levels upwind from the source tend to decrease and sound levels downwind tend to increase due to the refraction, or bending, of the sound (Figure 3). FIGURE 3: SCHEMATIC OF THE REFRACTION OF SOUND DUE TO VERTICAL WIND GRADIENT (WIND SHEAR) With temperature lapse, when ground surface temperatures are higher than those aloft, sound will tend to refract upwards, leading to lower sound levels near the ground. The opposite is true when ground temperatures are lower than those aloft (an inversion condition). High winds and/or high solar radiation can create turbulence which tends to break up and dissipate sound energy. Highly stable atmospheres, which tend to occur on clear nights with low ground-level wind speeds, tend to minimize atmospheric turbulence and are generally more favorable to downwind propagation. In general terms, sound propagates along the ground best under stable conditions with a strong temperature inversion. This tends to occur during the night and is characterized by low ground level winds. As a result, worst-case conditions for wind turbines tend to occur downwind under moderate nighttime temperature inversions. Therefore, this is the default condition for modeling wind turbine sound. 5 Wind Turbine Amplitude Modulation: Research to Improve Understanding as to its Cause and Effect. RenewableUK. December
15 Blazing Star Wind Farm 2, LLC Blazing Star Wind Farm 2 Public Document - Trade Secret Data has Been Excised PRELIMINARY NOISE COMPLIANCE REPORT 4.4 MASKING As mentioned above, sound levels from wind turbines are a function of wind speed. Background sound is also a function of wind speed, i.e., the stronger the winds, the louder the resulting background sound. This effect is amplified in areas covered by trees and other vegetation. The sound from a wind turbine can often be masked by wind sound at downwind receptors because the frequency spectrum from wind is very similar to the frequency spectrum from a wind turbine. Figure 4 compares the shape of the sound spectrum measured during a 5 m/s wind event to that of a Acciona AW MW wind turbine. As shown, the shapes of the spectra are very similar at lower frequencies. At higher frequencies, the sounds from the masking wind sound are higher than the wind turbine. As a result, the masking of turbine sound occurs at higher wind speeds for some meteorological conditions. Masking will occur most, when ground wind speeds are relatively high, creating wind-caused sound such as wind blowing through the trees and interaction of wind with structures. FIGURE 4: COMPARISON OF NORMALIZED FREQUENCY SPECTRA FROM THE WIND AND THE ACCIONA AW132 3 MW 6 It is important to note that while winds may be blowing at turbine height, there may be little to no wind at ground level. This is especially true during strong wind gradients (high wind shear), which mostly occur at night. This can also occur on the leeward side of ridges where the ridge blocks the wind. 4.5 INFRASOUND AND LOW FREQUENCY SOUND Infrasound is sound pressure fluctuations at frequencies below about 20 Hz. Sound below this frequency is only audible at very high magnitudes. Low frequency sound is in the audible 6 The purpose of this Figure is to show the shapes to two spectra relative to one another and not the actual sound level of the two sources of sound. The level of each source was normalized independently. 8 October 31, 2017
16 range of human hearing, that is, above 20 Hz, but below 100 to 200 Hz depending on the definition. Low frequency aerodynamic tonal sound is typically associated with downwind rotors on horizontal axis wind turbines. In this configuration, the rotor plane is behind the tower relative to the oncoming wind. As the turbine blades rotate, each blade crosses behind the tower s aerodynamic wake and experiences brief load fluctuations. This causes short, lowfrequency pulses or thumping sounds. Large modern wind turbines are upwind, where the rotor plane is upwind of the tower. As a result, this type of low frequency sound is at a much lower magnitude with upwind turbines than downwind turbines, well below established infrasonic hearing thresholds. Figure 5 shows the sound levels 350 meters (1,148 feet) from a wind turbine when the wind turbine was operating (T-on) and shut down (T-off) for wind speeds at hub height greater than 9 m/s. Measurements were made over approximately two weeks. 7 The red 90 dbg line is shown here as the ISO 7196:1995 perceptibility threshold. As shown, the wind turbines generated measurable infrasound, but at least 20 db below audibility thresholds. FIGURE 5: INFRASOUND FROM A WIND TURBINE AT 350 METERS (1,148 FEET) COMPARED WITH PERCEPTION THESHOLDS Low frequency sound is primarily generated by the generator and mechanical components. Much of the mechanical sound has been reduced in modern wind turbines through improved sound insulation at the hub. Low frequency sound can also be generated by the blades at higher wind speeds when the inflow air is very turbulent. However, at these wind speeds, low frequency sound from the wind turbine blades is often masked by wind sound at the downwind receptors. 7 RSG, et al., Massachusetts Study on Wind Turbine Acoustics, Massachusetts Clean Energy Center and Massachusetts Department of Environmental Protection, 2016 Graphic from RSG presentation to MassDEP WNTAG, March,
17 Blazing Star Wind Farm 2, LLC Blazing Star Wind Farm 2 Public Document - Trade Secret Data has Been Excised PRELIMINARY NOISE COMPLIANCE REPORT Finally, low frequency sound is absorbed less by the atmosphere and ground than higher frequency sound. Our modeling takes into account frequency-specific ground attenuation and atmospheric absorption factors that takes this into account. 4.6 USE OF SOUND LEVEL WEIGHTING NETWORKS FOR WIND TURBINE SOUND The human ear is not equally sensitive to sound pressure levels at all frequencies and magnitudes. Some frequencies, despite being the same decibel level (that is, magnitude), seem louder than others. For example, a 500 Hz tone at 80 db will sound louder than a 63 Hz tone at the same level. In addition, the relative loudness of these tones will change with magnitude. For example, the perceived difference in loudness between those two tones is less when both are at 110 db than when they are at 40 db. To account for the difference in the perceived loudness of a sound by frequency and magnitude, acousticians apply frequency weightings to sound levels. The most common weighting scale used in environmental noise analysis is the A-weighting, which represents the sensitivity of the human ear at lower sound pressure levels. The A-weighting is the most appropriate weighting when overall sound pressure levels are relatively low (up to about 70 dba). The A-weighting de-emphasizes sounds at lower and very high frequencies, since the human ear is insensitive to sound at these frequencies at low magnitude. The A-weighting is indicated by dba or db(a). At higher sound pressure levels (greater than approximately 70 dba), a different weighting must be used since human hearing sensitivity does not change as much with frequency. The C-weighting mimics the sensitivity of the human ear for these moderate to higher sound levels (greater than approximately 70 dba, which is higher ground based sound levels produced by wind power projects). C-weighted sound levels are indicated by dbc or db(c). The Z-weighting does not emphasize or de-emphasize sound at any frequency. Z weighted sound levels are sometimes labeled as Flat or Linear. The difference is that the Z-weighting is defined as being unweighted in a specific range, whereas Flat or Linear indicate that no weighting has been used. Z-weighting or unweighted levels are typically used when reporting sound levels at individual octave bands. The most appropriate weighting for wind turbine sound is the A-weighting, for two reasons. The first is that sound pressure levels due to wind turbine sound are typically in the appropriate range for the A-weighting at typical receiver distances (50 dba or less). The second is that various studies of wind turbine acoustics have shown that the potential effects of wind turbine noise on people are correlated with A-weighted sound level (i.e. Pedersen et al, ) as well as to the perceived loudness of wind turbine sound. 9,10 Other researchers 8 Pedersen, Eja and Waye, Kerstin. Perception and annoyance due to wind turbine noise - a doseresponse relation. Journal of the Acoustical Society of America. 116(6). pp Yokoyama S., et al. Perception of low frequency components in wind turbine noise. Noise Control Engr. J. 62(5) October 31, 2017
18 found that 51% of the energy making up a C-weighted measurement of wind turbine sound is not audible. Thus, it is more difficult to relate the level of C-weighted sound to human perception. That is, two sounds may be perceived exactly alike, but there could be significant variations in the C-weighted sound level depending on the content of inaudible sound in each Yokoyama et al. Loudness evaluation of general environmental noise containing low frequency components. Proceedings of InterNoise2013,
19 Blazing Star Wind Farm 2, LLC Blazing Star Wind Farm 2 Public Document - Trade Secret Data has Been Excised PRELIMINARY NOISE COMPLIANCE REPORT 5.0 SOUND LEVEL MONITORING PROCEDURES Background sound level monitoring was conducted throughout the area to quantify the existing sound levels, including the nighttime L50, and to identify existing sources of sound. In August 2017, four locations were monitored to determine existing background sound levels, including two offsite locations (Offsite C and Offsite D) and two locations within the project area. Also included in this report is monitoring that was conducted at two locations for Blazing Star in July 2016 but are either within or near the Blazing Star 2 project area. The Offsite B Monitor from Blazing Star was located within the Blazing Star 2 project area, and thus, its data is utilized in these analyses. In the context of this report, the Offsite B monitor from Blazing Star is referred to as the West Monitor. The South monitor from Blazing Star is within half a mile of the Blazing Star 2 project area, and so its data is also utilized in these analyses. In the context of this report, the South Monitor from Blazing Star is referred to as the Northwest Monitor. A map of the monitor locations within the project area is shown in Figure 6. Monitoring locations were selected per the guidance provided in the Department of Commerce, Energy Facility Permitting document, Guidance for Large Wind Energy Conversion System Noise Study Protocol and Report, October 2012 (LWECS Guidance). The guidance recommends a minimum of three locations within the project area, which were used for this project. The guidance also recommends that one monitoring location be in proximity to the worst-case modeled receptor, and for this project, the South Monitor location was selected as the worst-case modeled area. The North Monitor, was located approximately 3.6 kilometers (2.25 miles) west of US Route 75 and was positioned to be representative of the soundscape of the of residences that are further removed from US Route 75. The nearest proposed turbine to the North Monitor is approximately 300 meters (985 feet) to the north. The Northwest Monitor and West Monitor are both locations that were selected for Blazing Star as previously discussed. The Northwest Monitor was selected as one of the worst-case modeled areas for Blazing Star, and it was placed at a location that is approximately 1,200 meters (3,950 feet) northwest of a proposed turbine for Blazing Star 2. The West Monitor has proposed turbines to the west, north, and east with the closest located within approximately 1,065 meters (3,500 feet) to the west and north. Two offsite monitors were located to capture background sound levels beyond the extents of the project area. These monitors are expected to have little to no contributions of sound from the wind turbine when the project is built. The Offsite C Monitor was located northeast of the project area while still being located within Lincoln County. The monitor was located 2 km (1.25 miles) east of the project boundary and 5.7 km (3.5 miles) northeast of the nearest potential turbine location. The Offsite D monitor was located southeast of the project area, while being removed from Lake Benton to the south, U.S. Route 75 located to the west, and existing wind farms located to the west. The closest potential turbine location is located approximately 3.2 km (2 miles) to the northwest. 12 October 31, 2017
20 Further information on the monitoring locations as well as a review of monitoring equipment and procedures is found in the following sections. FIGURE 6: MONITORING LOCATION MAP 13
21 Blazing Star Wind Farm 2, LLC Blazing Star Wind Farm 2 Public Document - Trade Secret Data has Been Excised PRELIMINARY NOISE COMPLIANCE REPORT 5.1 EQUIPMENT Background sound level monitoring was performed with ANSI/IEC Type 1 Cesva SC310 and Svantek SV979 sound level meters with a minimum frequency range of 20 Hz to 10 khz. Meters were set to log, at a minimum, 1/3 octave band sound levels once each second for the entire measurement period. Sound level meter microphones were mounted on wooden stakes at a height of approximately 1.5 meters (5 feet) and covered with 180 mm (7 inch) windscreens to minimize the impact of wind distortion on measurements. The Cesva SC 310 meters were connected to Edirol audio recorders, recording audio data at a minimum resolution of 96 kbps in the.mp3 format. Svantek SV979 sound level meters record audio internally; resolution for audio files was set to 288 kbps in.wav format. Before and after the measurement periods, the meters were calibrated with a Cesva CB-5 calibrator. The monitoring equipment meets LWECS Guidance. A list of the equipment used at each monitor is shown in Table 2. At each site, an ONSET anemometer was located at microphone height. At the Offsite C and Offsite D locations, a wind direction sensor was also included in the setup. Wind data was logged at a rate of once each minute. Precipitation and temperature data were obtained from the KCNB National Weather Service weather station located at the airport in Canby, MN. TABLE 2: SOUND MONITOR SPECIFICATIONS BY SITE Monitor Sound Level 1/3 Octave Band Audio Location Meter 11 Frequency Range Recorder Weather Station North Cesva SC Hz - 10 khz Edirol R- 09HR ONSET HOBO Wind Speed Sensor South Svantek SV Hz - 20 khz Internal ONSET HOBO Wind Speed Sensor Northwest 12 Cesva SC Hz 20 khz Edirol R-05 ONSET HOBO Wind Speed Sensor West 13 Svantek SV Hz 20 khz Internal ONSET HOBO Wind Speed and Direction Sensor Offsite C ONSET HOBO Wind Speed and Svantek SV Hz - 20 khz Internal (North) Direction Sensors Offsite D ONSET HOBO Wind Speed and Svantek SV Hz - 20 khz Internal (South) Direction Sensor 5.2 DATA PROCESSING After data collection, data was downloaded, processed, and summarized into 1-hour periods. For each period A-, C-, and Z-weighted equivalent average sound levels (L EQ ) were calculated. For A- and C-weighted sound levels, the L10, L50, and L90 statistical sound levels were also calculated. A second set of data was also generated with periods removed from the data that either contained anomalous sound events or periods with conditions that could lead to false sound level readings. 11 The frequency range for the Cesva SC-310 sound level meters is limited by the instrument and the range for the Svantek SV979 sound level meters is limited by the microphone. 12 The Northwest Monitor collected data as part of the pre-construction background monitoring for Blazing Star conducted in July 2016 and was referred to as the South Monitor for Blazing Star. 13 The West Monitor collected data as part of the preconstruction background monitoring for Blazing Star conducted in July 2016 and was referred to as the Offsite B Monitor for Blazing Star. 14 October 31, 2017

22 Periods that were removed from the sound level data included: Wind speeds above 11 mph (5 m/s), Precipitation and thunderstorm events, Low flying aircraft near the monitor (presumably crop dusters), Personnel and animal interaction with equipment. 5.3 MONITOR LOCATION DESCRIPTIONS NORTH MONITOR The North Monitor was located in an open field in the northern half of the proposed project area. The monitor was placed approximately 340 meters (1,110 feet) west of 180 th Avenue on a fence line between a cow pasture, a hayfield, and cornfields. An abandoned homestead, about 250 meters (820 feet) southeast of the monitoring location, is still used for agricultural operations, including the pastured cattle. The surrounding area is predominantly under agricultural control. A picture of the monitoring setup is shown in Figure 7, and a map of the monitoring location is shown in Figure 8. FIGURE 7: PHOTOGRAPH OF THE NORTH MONITOR LOOKING NORTHWARD 15

23 Blazing Star Wind Farm 2, LLC Blazing Star Wind Farm 2 Public Document - Trade Secret Data has Been Excised PRELIMINARY NOISE COMPLIANCE REPORT FIGURE 8: NORTH MONITOR LOCATION AERIAL VIEW 16 October 31, 2017

24 SOUTH MONITOR The South Monitor was located approximately 180 meters (590 feet) south of CSAH-16, and 165 meters (540 feet) from US-75. This position was about 325 meters southeast of Ash Lake. The monitor was located in a sheltered area on the outskirts of a homestead, between a grove of planted trees and active soybean field. The homestead was approximately 100 meters (330 feet) to the southeast and uphill of the sound level meter. A picture of the monitor setup is shown in Figure 9, and a map of the monitoring location is shown in Figure 10. FIGURE 9: PHOTOGRAPH OF THE SOUTH MONITOR LOOKING NORTHWARD 17

25 Blazing Star Wind Farm 2, LLC Blazing Star Wind Farm 2 Public Document - Trade Secret Data has Been Excised PRELIMINARY NOISE COMPLIANCE REPORT FIGURE 10: SOUTH MONITOR LOCATION AERIAL VIEW 18 October 31, 2017
 south of 290th Street, and approximately 720 meters (2,360 feet) west of County Road 101 (CR-101).")
26 NORTHWEST MONITOR The Northwest Monitor was located along a row a trees that divided a homestead from the adjoining farm field to the east. The monitor was located approximately 76 meters (250 feet) south of 290th Street, and approximately 720 meters (2,360 feet) west of County Road 101 (CR-101). A residence was located approximately 50 meters (164 feet) to the west and a larger group of trees was located approximately 65 meters (213 feet) to the west. Farm fields surrounded the homestead and monitor location. Terrain in this part of the project is relatively flatter than to the north. A picture of the monitoring setup is shown in Figure 15, and a map of the monitor location is shown in Figure 16. FIGURE 11: PHOTOGRAPH OF THE NORTHWEST MONITOR LOOKING EASTWARD 19


27 Blazing Star Wind Farm 2, LLC Blazing Star Wind Farm 2 Public Document - Trade Secret Data has Been Excised PRELIMINARY NOISE COMPLIANCE REPORT FIGURE 12: NORTHWEST MONITOR LOCATION AERIAL VIEW 20 October 31, 2017
 north of Lake Shaokatan, to represent rural-residential soundscapes in this area.")
28 WEST MONITOR The West Monitor was located in the western portion of the project area approximately 2.4 kilometers (1.5 miles) north of Lake Shaokatan, to represent rural-residential soundscapes in this area. The monitor was located at a homestead, approximately 145 meters (475 feet) west of CR- 101 and approximately 350 meters (1,150 feet) southwest of the intersection between CR- 101 and 260 th Street. The area immediately surrounding the homestead was wooded and surrounding fields were planted with corn. Terrain in this area is flat, and like the rest of the project area, is predominantly agricultural. A picture of the monitoring setup is shown in Figure 13, and a map of the monitoring location is shown in Figure 14. FIGURE 13: PHOTOGRAPH OF THE WEST MONITOR LOOKING NORTHWARD 21


29 Blazing Star Wind Farm 2, LLC Blazing Star Wind Farm 2 Public Document - Trade Secret Data has Been Excised PRELIMINARY NOISE COMPLIANCE REPORT FIGURE 14: WEST MONITOR LOCATION AERIAL VIEW 22 October 31, 2017
 north of the road in a clearing.")
30 OFFSITE C MONITOR The Offsite C Monitor was located along 370 th Street (CSAH-19) adjacent to a wild and riparian area, approximately 465 meters (1525 feet) west of Country Road 109. The monitor did not have direct line of sight to the creek that ran well below its elevation to the north. The monitor was placed approximately 30 meters (100 feet) north of the road in a clearing. The nearest homestead was 750 meters (2460 feet) west on Route 19 and the surrounding land use primarily agricultural. A picture of the monitoring setup is shown in Figure 15, and a map of the monitor location is shown in Figure 16. FIGURE 15: PHOTOGRAPH OF THE OFFSITE C MONITOR LOOKING EASTWARD 23

31 Blazing Star Wind Farm 2, LLC Blazing Star Wind Farm 2 Public Document - Trade Secret Data has Been Excised PRELIMINARY NOISE COMPLIANCE REPORT FIGURE 16: OFFSITE C MONITOR LOCATION AERIAL VIEW 24 October 31, 2017
 north of the intersection with County Road 13. The field to the east of the monitor was in active corn production. Most other land in the surrounding area was used for farming.")
32 OFFSITE D MONITOR The Offsite D Monitor was located in a power line right-of-way, approximately 5 meters (16 feet) east of County Road 110 and approximately 1.5 km (0.95 miles) north of the intersection with County Road 13. The field to the east of the monitor was in active corn production. Most other land in the surrounding area was used for farming. Terrain in this area was rolling and the monitor was located in an area with a higher elevation than nearby terrain, surrounded by tall grass and tall corn, and attached to a utility pole. The closest residence to this monitor was located approximately 135 meters (440 feet) to the south, which also appeared to be used for agricultural operations. A picture of the monitoring setup is shown in Figure 17, and a map of this location is shown in Figure 18. FIGURE 17: PHOTOGRAPH OF THE OFFSITE A MONITOR LOOKING NORTHWARD 25

33 Blazing Star Wind Farm 2, LLC Blazing Star Wind Farm 2 Public Document - Trade Secret Data has Been Excised PRELIMINARY NOISE COMPLIANCE REPORT FIGURE 18: OFFSITE D MONITOR LOCATION AERIAL VIEW 26 October 31, 2017
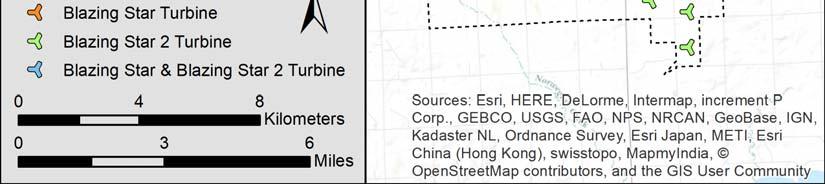
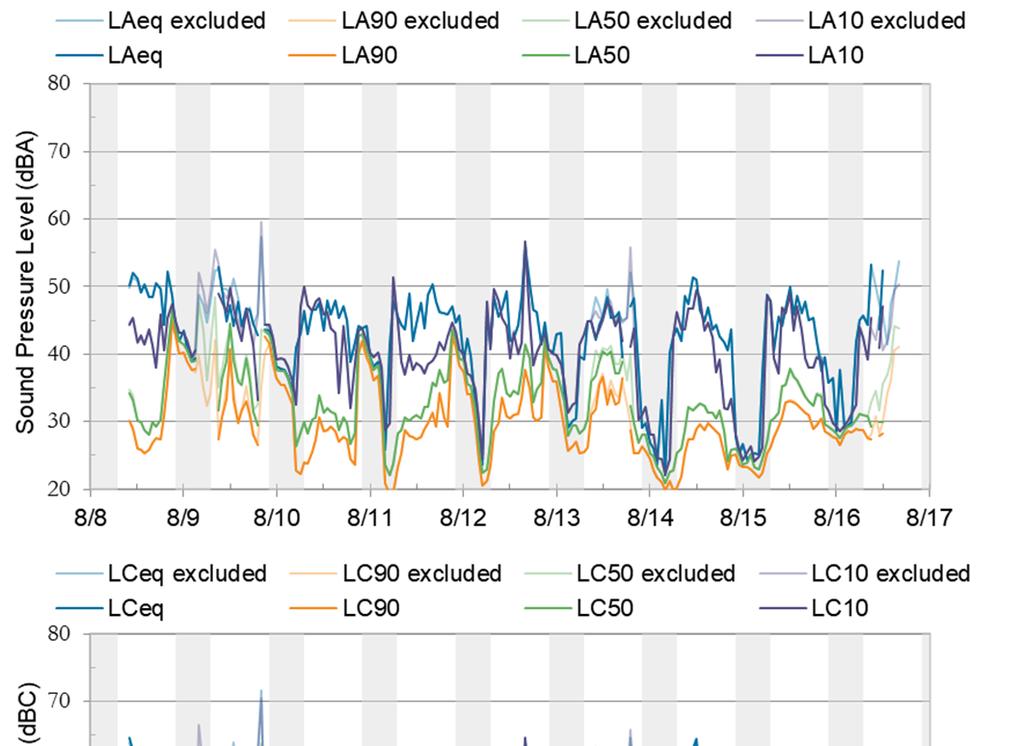
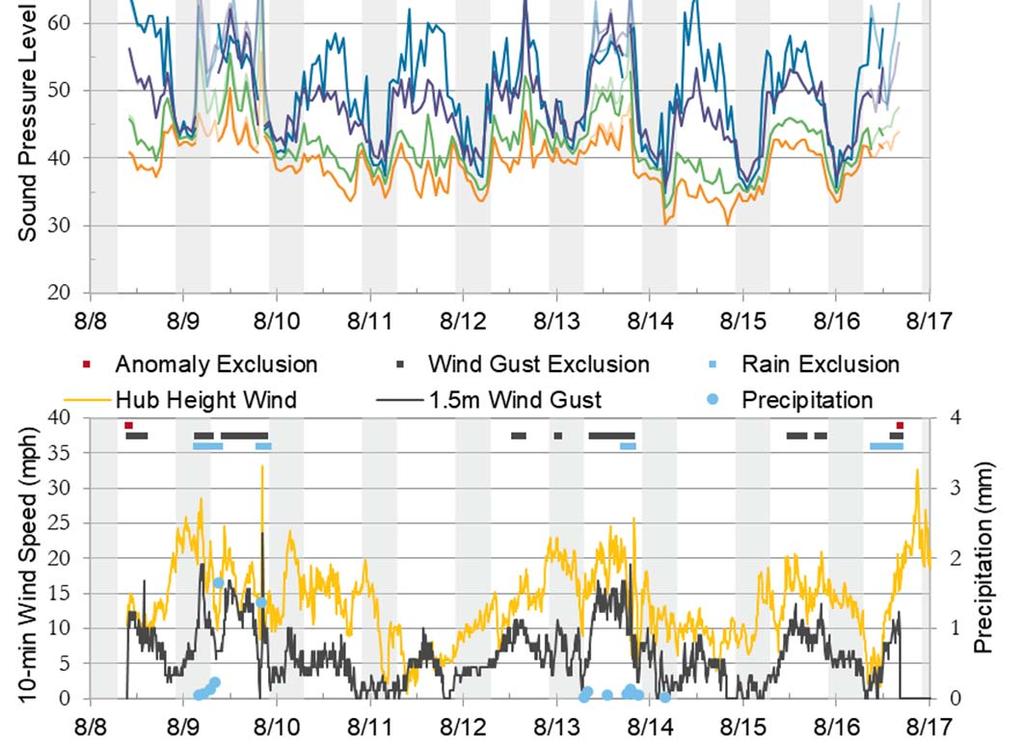
34 6.0 SOUND LEVEL MONITORING RESULTS For each monitor site, sound level monitoring results are presented in a single chart in this report section. Each chart contains hourly sound levels, gust wind speed measured adjacent to each microphone, hub height average wind speed, precipitation events, and indications of data exclusions in conformance with LWECS Guidance. Points on the sound level graph represent data summarized for a single one-hour interval. The top portion of the chart displays A-weighted sound levels, the middle portion presents C-weighted levels, and the bottom portion shows wind speeds and times when there were data exclusions. All portions of the chart exhibit day/night shading: night is defined as 22:00 to 07:00 and shaded in grey. The specific sound level metrics reported are L EQ, L 90, L 50, and L 10. Equivalent continuous sound levels (L EQ ) are the energy-average level over one hour. Tenth-percentile sound levels (L 90 ) are the statistical value above which 90% of the sound levels occurred during one hour. Fiftieth-percentile sound levels (L 50 ) represent the median sound level of that one-hour period. Ninetieth-percentile sound levels (L 10 ) are the statistical value above which 10% of the sound levels occurred during one hour. Data that were excluded from processing (e.g., due to high wind and rain periods) are included in the graphs but shown in lighter colors. Furthermore, square markers on the lower portion of the chart indicate periods for which data was excluded and designate if the period was eliminated as a result of rain, wind gusts over 11 mph, or anomalous events. Sound level data and wind gust data presented in the charts are those measured at each corresponding site. Wind data from the monitoring location, measured at the microphone height of 1.5 meters (5 feet), are presented as the maximum gust speed occurring at any time over a 10-minute interval; they are not averaged. The average 10-minute wind speed measured at the project met-tower closest to the monitoring location is also displayed on the chart. Lastly, one-hour precipitation totals are plotted with respect to the secondary axis on the right-hand side of the chart. 6.1 RESULTS SUMMARY EXCLUSION PERIODS Periods were excluded at each monitor through both manual identification and automated processing. Manual processing included the review of spectrograms created from the measured one-second one-third octave band data, accompanied by audio recordings made through the sound level meter s microphone. In this way, typical sources and anomalous events were identified. Exact rain periods were manually identified from the spectrogram to ensure that data during rain events at each monitor were excluded. Automated processing of wind speed permitted the identification of gusts above 11 mph on a one-minute basis. That is, if a gust within a specific one-minute period was measured above 11 mph, then that whole minute was eliminated. 27
35 Blazing Star Wind Farm 2, LLC Blazing Star Wind Farm 2 Public Document - Trade Secret Data has Been Excised PRELIMINARY NOISE COMPLIANCE REPORT A summary of each monitor s total runtime and the amount of time excluded from the reported sound levels for rain, wind, and anomalous events are shown in Table 3. TABLE 3. SUMMARY OF EXCLUSION PERIODS AT EACH MONITOR Run Exclusion Statistics Location Time 14 Rain Wind Anomalies Total (hr) (hr) (%) (hr) (%) (hr) (%) (hr) (%) North Monitor % % % % South Monitor % % % % Northwest % % % % Monitor West Monitor % % % % Offsite C % % % % Offsite D % % % % SOUND LEVELS The A-weighted sound levels are listed for all seven sites in Table 4 and the C-weighted sound levels are listed Table 5. The reported levels represent all valid periods, that is, all periods that were not excluded due to weather or anomalous activity, as discussed in Section 5.2. In both tables, the equivalent continuous levels (L EQ ) at night are less than (or equal to) daytime levels at all sites, which is typical and indicate the influence of human activity on the measured sound levels during the day. For some locations, the large difference between L EQ and 10 th -percentile levels (L 90 ) indicate that the soundscapes are often dominated by transient or intermittent sounds (such as aircraft overflights or passing automobiles). TABLE 4. PRECONSTRUCTION MONITORING SUMMARY (A-WEIGHTED RESULTS) 15 Location Sound Level (dba) Overall Day Night L EQ L 90 L 50 L 10 L EQ L 90 L 50 L 10 L EQ L 90 L 50 L 10 North Monitor South Monitor Northwest Monitor West Monitor Offsite C Offsite D Due to firmware upgrades from Svantek immediately prior to the August 2017 monitoring period, the Svantek 979 s memory became full after 144 hours of data collection. 15 The results for the North, South, Offsite C, and Offsite D Monitors are from the Blazing Star 2 monitoring period of August 8-16, 2017, while the results from the Northwest and West Monitors are from the Blazing Star monitoring period of July 20 August 1, October 31, 2017
36 TABLE 5. PRECONSTRUCTION MONITORING SUMMARY (C-WEIGHTED RESULTS) 16 Sound Level (dbc) Location Overall Day Night L EQ L 90 L 50 L 10 L EQ L 90 L 50 L 10 L EQ L 90 L 50 L 10 North Monitor South Monitor Northwest Monitor West Monitor Offsite C Offsite D METEOROLOGY Local meteorological data was collected from anemometers alongside the monitors, project met-towers, and the Canby Airport (station KCNB). According to the airport, local temperatures ranged from 12.0 C to 27.8 C during the August 2017 monitoring period and from 12.5 C to 33.6 C during the July 2016 monitoring period. According to KCNB, the only significant precipitation events during the August 2017 monitoring period took place the morning of August 9 and the evening of August 9. The evening of August 9 involved a strong thunderstorm system that moved through the area between 7 and 9 pm. During the July 2016 monitoring period, the only registered precipitation event from KCNB was on July 23. This too was a strong thunderstorm system that moved through the area. Additional short duration rain was observed at some of the monitors on July 26. Thunder, which was observed in the spectrograms, occurred on the morning of July 27 th and was excluded from data processing as an anomaly. A summary of the 1.5-meter (5-foot) wind speeds measured at each monitoring location over the deployment period at each site is provided in Table The results for the North, South, Offsite C, and Offsite D Monitors are from the Blazing Star 2 monitoring period of August 8-16, 2017, while the results from the Northwest and West Monitors are from the Blazing Star monitoring period of July 20 August 1,
37 Blazing Star Wind Farm 2, LLC Blazing Star Wind Farm 2 Public Document - Trade Secret Data has Been Excised PRELIMINARY NOISE COMPLIANCE REPORT TABLE 6. SUMMARY OF MEASURED 10-MINUTE 1.5-METER (5-FOOT) WIND SPEEDS Measured 1.5 meter Wind (mph) Location 10 min Wind Speed 10 min Gust Speed Average Maximum Average Maximum North Monitor South Monitor Northwest Monitor West Monitor Offsite C Offsite D MONITORING RESULTS FOR THE NORTH MONITOR Monitoring results for the North Monitor are presented in Figure 19. The North Monitor was the most exposed monitor and therefore registered the highest wind speeds. It had the most periods of wind greater than 5 meters per second which merited removal from the analysis due to wind-cause pseudo-noise on the microphone. The North Monitor was one of the quietest locations monitored. It was not near any major roadways and was set back a few hundred meters from local roadways, so the North Monitor was less influenced by traffic noise than other monitors. Primary sources of sound were wind rustling grass, biogenic sounds (both wildlife and agricultural), and occasional aircraft overflights. The sound levels displayed a clear diurnal pattern. That is, sound levels rose during the day and fell at night. This is often attributable to human activity, and in this case it was primary caused by aircraft overflights and biogenic sounds, which both occurred less at night. 17 The anemometer data logger for the Offsite D Monitor had a memory failure after 1.5 days. The data in Table 6 for the Offsite D Monitor only represent the 1.5 days of collected data. 30 October 31, 2017


38 FIGURE 19. PRE-CONSTRUCTION MONITORING RESULTS AT THE NORTH MONITOR 31
39 Blazing Star Wind Farm 2, LLC Blazing Star Wind Farm 2 Public Document - Trade Secret Data has Been Excised PRELIMINARY NOISE COMPLIANCE REPORT 6.3 MONITORING RESULTS FOR THE SOUTH MONITOR Monitoring results for the South Monitor are presented in Figure 20. Being located near the US Route 75 corridor, the South Monitor was more influenced by periodic traffic noise than the other monitors. This resulted in the South Monitor having the some of the highest background sound levels of all the monitoring locations. The overall nighttime L50 was 42 dba, 4 db higher than the next highest monitor location (Offsite D). The sound levels displayed a slightly diurnal pattern; less so than the North Monitor. Primary sources of sound at the South monitor included vehicle passbys, aircraft flyover, wind in foliage, and at night, insects. The South Monitor was placed in the proximity of the worst-case receptors, as identified in preliminary modeling of the project wind turbines. Figure 21 presents the 1/3 octave band statistical sound levels for a representative wind speed at the South Monitor. A wind speed of 9 m/s, applied at a representative hub height of 85 meters (279 feet), was selected because it is typically the speed at which turbines begin producing maximum sound power. Only periods with this representative wind speed were used for the unweighted statistical metrics in the figure, providing a baseline for direct comparison with post-construction measurements. The large difference between the upper and lower 10 th percentiles in the 10,000 Hz octave band is indicative of occasional insect sounds at night. 32 October 31, 2017
40 FIGURE 20. PRECONSTRUCTION MONITORING RESULTS AT THE SOUTH MONITOR 33
41 Blazing Star Wind Farm 2, LLC Blazing Star Wind Farm 2 Public Document - Trade Secret Data has Been Excised PRELIMINARY NOISE COMPLIANCE REPORT FIGURE 21: SOUTH MONITOR - 1/3 OCTAVE BAND AND OVERALL STATISTICAL SOUND LEVELS 18 AT 9 M/S 85-METER (279-FOOT) HEIGHT WIND SPEED 6.4 MONITORING RESULTS FOR THE NORTHWEST MONITOR Monitoring results at the Northwest Monitor are presented in Figure 22. Although the wind s behavior generated what appears to be a diurnal pattern, distant human activity was also a contributing factor. Two Hundred Ninetieth Street, located to the north, had a relatively low traffic volume, leading to noticeable soundscape contribution from vehicle traffic during the day yet minimal impact at night. Most of the sound sources at night were commercial aircraft flyovers at cruising altitude and barking dogs. Farm equipment was relatively infrequent during the monitoring period, even with farm fields surrounding the homestead. Dog barking was common due to two dogs inhabiting the site. Other sound sources that were present included birds, insects, aircraft, residents coming and going, and yard maintenance equipment. The louder period in the middle of the day on July 25 th was a result of the property, on which the monitor was placed, being mowed. 18 Each vertical orange and grey bar shows the Lower 10 th, median, and Upper 10 th percentile L 90, L 50, and L 10 ) sound level for a single 1/3 octave band. The top of the orange bar is the Upper 10 th percentile sound pressure level, the white dot is the median, and the bottom of the grey bar is the lower 10 th percentile sound level. The entire length of the bar indicates the middle 80 th percentile of sound pressure levels. The blue dots indicate the equivalent average sound pressure level (L EQ ) for that 1/3 octave band. At the far right of the chart are the A-, C-, and Z-weighted overall levels. Data shown was measured during periods where the estimated 85-meter (279-foot) wind speed was at 9 meters per second, the speed where most turbine models begin producing maximum sound emissions. 34 October 31, 2017


42 FIGURE 22. PRE-CONSTRUCTION MONITORING RESULTS FOR THE NORTHWEST MONITOR 35
43 Blazing Star Wind Farm 2, LLC Blazing Star Wind Farm 2 Public Document - Trade Secret Data has Been Excised PRELIMINARY NOISE COMPLIANCE REPORT 6.5 MONITORING RESULTS FOR THE WEST MONITOR Results for the monitoring period at the West monitor are presented in Figure 26. The soundscape at this location was often dominated by wind-caused sound, mostly resulting from the wind s interaction with nearby trees and crops. The C-weighted L 10 very closely followed the trend of 10-minute gust speed. Nearby vegetation also housed birds and insects that were responsible for the biogenic sound observed during monitoring. During quieter periods, a fan located at the nearby residence was audible, as was a television or radio. The early morning hours of July 29 th was observed to be the quietest period at this monitor as a result of the calm winds, with all A-weighted metrics dropping below 30 dba. Yard maintenance activities and farm equipment were occasionally audible. Due to low overall traffic volume and distance to the roads, vehicle noise was infrequent and lower in magnitude. Airplane overflights were often masked by the fan and a railroad was occasionally audible. Lawn care of the property on which the monitor was installed took place on July 27 th and July 29 th. Figure 27 displays the summary of overall and statistical levels for the representative hub height wind speed of 9 m/s. The relatively small difference between the upper 10 th - precentile level and the lower 10 th -percentile level means that there are few transient sounds that occurred at the monitoring location. 36 October 31, 2017
44 FIGURE 23. PRECONSTRUCTION RESULTS FOR THE WEST MONITOR 37
45 Blazing Star Wind Farm 2, LLC Blazing Star Wind Farm 2 Public Document - Trade Secret Data has Been Excised PRELIMINARY NOISE COMPLIANCE REPORT 6.6 MONITORING RESULTS FOR THE OFFSITE C MONITOR The monitoring results for the Offsite C monitor are presented in Figure 24. The soundscape at the Offsite C Monitor was dominated by wind-caused sound in nearby foliage and biogenic sounds, mostly bird calls. There were also occasional vehicle passbys on 370 th Street. The sound levels displayed a diurnal pattern which was due to both bird calls and vehicle passbys. Aircraft flyovers were also present at this monitor, but appeared slightly less frequent than at other monitoring locations. The L50 at this monitor location closely matches the pattern of wind speed at the site while the equivalent sound level is more influenced by vehicle passybs. This is evident in Figure 24. For example, August 10 and 14 were days with lower wind speeds and corresponding lower median sound levels, but the equivalent sound levels are similar to days with higher wind speeds indicating that they are driven more by occasional vehicle passbys. This would be due to the monitor s proximity to 370 th Street. Figure 25 displays the summary of overall and statistical levels for the representative hub height wind speed of 9 m/s. The relatively small difference between the upper 10 th - percentile and lower 10 th -percentile level means that there are few transient sounds that occurred at this monitor location. The large difference between the upper and lower 10 th percentiles in the 2,000 and 10,000 Hz octave bands is indicative of occasional insect sounds at night. 38 October 31, 2017
46 FIGURE 24. PRE-CONSTRUCTION RESULTS FOR THE OFFSITE C MONITOR 39
47 Blazing Star Wind Farm 2, LLC Blazing Star Wind Farm 2 Public Document - Trade Secret Data has Been Excised PRELIMINARY NOISE COMPLIANCE REPORT FIGURE 25: OFFSITE C - 1/3 OCTAVE BAND AND OVERALL STATISTICAL SOUND LEVELS AT 9 M/S 85-METER (279-FOOT) HEIGHT WIND SPEED 6.7 MONITORING RESULTS FOR THE OFFSITE D MONITOR Results for the monitoring period at the Offsite D monitor are presented in Figure 26. The soundscape at the Offsite D Monitor was dominated by wind-caused sound in nearby foliage, biogenic sounds including insects at night and occasional birds and dogs, and sound from agricultural activities at nearby farms. There were also occasional vehicle passbys on County Road 110. The A-weighted sound levels displayed a diurnal pattern, but the C- weighted sound levels did not. This is due to consistently present low frequency sound from agricultural operations at nearby farms. The spike in sound levels on August 12 which was removed from the data analysis as an anomaly was caused by a low-flying aircraft, presumably a crop duster. Figure 27 displays the summary of overall and statistical levels for the representative hub height wind speed of 9 m/s. The large difference between the upper and lower 10 th percentiles in the 10,000 Hz octave band is indicative of occasional insect sounds at night. The consistent low frequency sound from nearby agricultural operations is also apparent in Figure October 31, 2017

48 FIGURE 26. PRECONSTRUCTION RESULTS FOR THE OFFSITE D MONITOR The anemometer data logger for the Offsite D Monitor had a memory failure after 1.5 days. The 1.5-meter wind data in Figure 26 shows the data that was collected over the first 1.5 days. 41
49 Blazing Star Wind Farm 2, LLC Blazing Star Wind Farm 2 Public Document - Trade Secret Data has Been Excised PRELIMINARY NOISE COMPLIANCE REPORT FIGURE 27: OFFSITE D - 1/3 OCTAVE BAND AND OVERALL STATISTICAL SOUND LEVELS AT 9 M/S 85-METER (279-FOOT) HEIGHT WIND SPEED 42 October 31, 2017
50 7.0 SOUND PROPAGATION MODELING PROCEDURES Modeling for the project was in accordance with the standard ISO , Acoustics Attenuation of sound during propagation outdoors, Part 2: General Method of Calculation. The ISO standard states, This part of ISO 9613 specifies an engineering method for calculating the attenuation of sound during propagation outdoors in order to predict the levels of environmental noise at a distance from a variety of sources. The method predicts the equivalent continuous A-weighted sound pressure level under meteorological conditions favorable to propagation from sources of known sound emissions. These conditions are for downwind propagation or, equivalently, propagation under a well-developed moderate ground-based temperature inversion, such as commonly occurs at night. The model takes into account source sound power levels, surface reflection and absorption, atmospheric absorption, geometric divergence, meteorological conditions, walls, barriers, berms, and terrain. The acoustical modeling software used here was CadnaA, from Datakustik GmbH. CadnaA is a widely accepted acoustical propagation modeling tool, used by many noise control professionals in the United States and internationally. ISO also assumes downwind sound propagation between every source and every receiver, consequently, all wind directions, including the prevailing wind directions, are taken into account. Model input parameters are listed in Appendix B including the modeled sound power spectra for each turbine model. For this analysis, we utilized a ground absorption factor of G = 0.7, which is appropriate for comparing modeled results to the L 50 metric used in the state standard, particularly when summing model results with the monitored L 50 levels 20. A 2 db uncertainty factor was still added to the turbine sound power, except for the Acciona AW132, which specifically lists a sound power tolerance of 1 db, which leads to a 1.6 db uncertainty factor, per IEC Two distinct receiver heights are included in the analysis; different receiver heights result in different sound levels as a result of source proximity and relative exposure. Residences are modeled as discrete receivers at 4 meters (13 feet) above ground level. The 4-meter (13-foot) receiver height mimics the height of a second story window. A total of 455 residences located within 1.6 kilometers (1 mile) of Blazing Star 2. The grid, represented in the results map figures by sound pressure level contours, is calculated at a height of 1.5 meters (5 feet), to represent one s average listening height. 20 Generally accepted wind turbine modeling procedure calls for a ground absorption factor of G = 0.5, with a 2 db uncertainty factor added to the manufacturer s guaranteed levels, to predict a maximum L EQ(1-hr). In this case, the state limit utilizes an L50 metric instead of maximum L EQ(1-hr), which means a ground factor of G=0.7 is more appropriate. 43
51 Blazing Star Wind Farm 2, LLC Blazing Star Wind Farm 2 Public Document - Trade Secret Data has Been Excised PRELIMINARY NOISE COMPLIANCE REPORT A search distance up to 10,000 meters (6.2 miles) allows for the contributions of distant turbines to be considered at receivers. The contribution of distant turbines will depend on the geometry and geography of the project. Four iterations were performed using the currently proposed turbine layouts and turbine models which include the Acciona AW 132, Gamesa G126, GE LNTE, and the Vestas V110 STE. The sound power spectra for each turbine is provided in Appendix B. All model iterations included the turbines from Blazing Star and Blazing Star 2 to account for the combined potential impact of both projects together. 44 October 31, 2017
52 8.0 SOUND PROPAGATION MODELING RESULTS 8.1 OVERALL A-WEIGHTED MODEL RESULTS Modeling results are shown in Figure 28 for the Acciona AW 132, Figure 29 for the Gamesa G126, Figure 30 for the GE , and Figure 31 for the Vestas V110 STE. Results are presented as contour lines representing 5-dB increments of calculated A-weighted sound pressure levels. Appendix C provides a list of the calculated sound pressure levels at each receiver for all four models and a map showing all receiver identification numbers for reference in the chart. A summary of the sound propagation model results is presented in Table 7. All modeled receivers are predicted to experience sound levels below 50 dba. The highest sound level (L50) at a non-participating residence is 45 dba for the V110 model, and the average sound level (L50) across all non-participating residences is 32 to 35 dba depending on the turbine model. TABLE 7: MODEL RESULTS SUMMARY Residence Classification Avg L50 AW132 GE LNTE G126 Max L50 Min L50 Avg L50 Max L50 All Participating Non Participating Min L50 Avg L50 Max L50 Min L50 Avg L50 V110 STE Max L50 Min L50 45
53 Blazing Star Wind Farm 2, LLC Blazing Star Wind Farm 2 Public Document - Trade Secret Data has Been Excised PRELIMINARY NOISE COMPLIANCE REPORT FIGURE 28: ACCIONA AW MW SOUND PROPAGATION MODELING RESULTS 46 October 31, 2017
54 FIGURE 29: GAMESA G MW SOUND PROPAGATION MODELING RESULTS 47
55 Blazing Star Wind Farm 2, LLC Blazing Star Wind Farm 2 Public Document - Trade Secret Data has Been Excised PRELIMINARY NOISE COMPLIANCE REPORT FIGURE 30: GE LNTE SOUND PROPAGATION MODELING RESULTS 48 October 31, 2017
56 FIGURE 31: VESTAS V110 STE 2.0 MW SOUND PROPAGATION MODELING RESULTS 49
57 Blazing Star Wind Farm 2, LLC Blazing Star Wind Farm 2 Public Document - Trade Secret Data has Been Excised PRELIMINARY NOISE COMPLIANCE REPORT 8.2 MODEL RESULTS ADDED TO BACKGROUND L50 To assess potential for compliance with state noise regulations, the model results must be summed (logarithmically) 21 with the monitored overall nighttime L50 results to determine possible L50 levels that could occur when the project is operating. This analysis is presented in Table 8. As shown in the Table, the model results summed with the overall nighttime L50 for each monitoring location are less than 50 dba for turbine models. TABLE 8: MODEL RESULTS (dba) SUMMED WITH MONITORED BACKROUND SOUND LEVELS (L50, dba) Scenario Background Monitor Results AW132 G126 GE LNTE V110 STE Metric North Monitor Monitor Location Northwest Monitor West Monitor South Monitor Overall Nighttime L Maximum 1 hr Nighttime L Minimum 1 hr Nightime L Modeled Sound Level Summed With Overall Nighttime L Modeled Sound Level Summed With Overall Nighttime L Modeled Sound Level Summed With Overall Nighttime L Modeled Sound Level Summed With Overall Nighttime L The background L50 does and will vary from hour to hour, as shown in the monitor results in Section 6. Thus, in Appendix C, the model results are summed with a range of potential background L50 values ranging from 35 dba to 55 dba in 5 db increments. As previously discussed in Section 5, only periods with high wind (above 5 m/s), precipitation, thunder, low flying aircraft near the monitor, and personnel and animal interaction with equipment were excluded from the monitored data. For post-construction compliance monitoring, LWECS Guidance allows for elimination of sporadic noise such as vehicle passbys, dogs barking, and other non-turbine related extraneous sound. With all of those sources removed, the background L50s are likely lower than those reported here and in Section 6. 21, 10 log October 31, 2017
58 9.0 CONCLUSIONS Blazing Star 2 is a proposed wind power generation facility in Lincoln County, Minnesota. The facility will include up to 100 wind turbines for a rating of up to 200 MW. In preparation for its Site Permit Application, RSG conducted a preliminary noise compliance assessment of the project. Conclusions of the assessment are as follows: 1. Background sound level monitoring periods with high wind (above 5 m/s), precipitation, thunder, low-flying aircraft near the monitors, and personnel and animal interaction with equipment were excluded from the monitored data. 2. Background sound levels vary some around the project site with the quietest areas on the north and northwest side of the project area where the overall nighttime L50 was 31 to 32 dba over the course of the entire monitoring periods. At other on-site locations, the overall nighttime L50 was 37 to 42 dba over the course of the entire monitoring periods. 3. Minimum 1-hour nighttime L50s were between 21 and 36 dba across the project area, while maximum 1-hour nighttime L50s were between 37 and 52 dba. 4. With non-turbine extraneous sound sources such as, vehicle passbys and dogs barking, background sound levels may be lower than those reported here. 5. State noise regulations require that wind power generation facilities show compliance with a nighttime limit of 50 dba (L50) and a daytime limit of 60 dba (L50) at residences. 6. Sound propagation modeling was performed in accordance with ISO at 455 discrete receivers within 1 mile of the project with spectral ground attenuation and a ground factor of G=0.7. These modeling parameters are meant to represent the L50 of the proposed facility. 7. Modeling was completed for four different turbine models: Acciona AW132, Gamesa G126, GE LNTE, and the Vestas V110 STE. 8. For all turbine models, projected sound levels from the project are less than 50 dba at all residences with the highest projected sound level (L50) at a non-participating residence of 45 dba, and the average sound level (L50) across all non-participating residences is 32 to 35 dba depending on the turbine model. 9. When added to the overall nighttime L50 from monitored locations, sound levels remain below 50 dba, but the background L50 does and will vary from hour to hour, as shown in the monitor results. 51
59 Blazing Star Wind Farm 2, LLC Blazing Star Wind Farm 2 Public Document - Trade Secret Data has Been Excised PRELIMINARY NOISE COMPLIANCE REPORT APPENDIX A: ACOUSTICS PRIMER Expressing Sound in Decibel Levels The varying air pressure that constitutes sound can be characterized in many different ways. The human ear is the basis for the metrics that are used in acoustics. Normal human hearing is sensitive to sound fluctuations over an enormous range of pressures, from about 20 micropascals (the threshold of audibility ) to about 20 pascals (the threshold of pain ). 22 This factor of one million in sound pressure difference is challenging to convey in engineering units. Instead, sound pressure is converted to sound levels in units of decibels (db, named after Alexander Graham Bell). Once a measured sound is converted to db, it is denoted as a level with the letter L. The conversion from sound pressure in pascals to sound level in db is a four-step process. First, the sound wave s measured amplitude is squared and the mean is taken. Second, a ratio is taken between the mean square sound pressure and the square of the threshold of audibility (20 micropascals). Third, using the logarithm function, the ratio is converted to factors of 10. The final result is multiplied by 10 to give the decibel level. By this decibel scale, sound levels range from 0 db at the threshold of audibility to 120 db at the threshold of pain. Typical sound sources, and their sound pressure levels, are listed on the scale in Figure 32. Human Response to Sound Levels: Apparent Loudness For every 20 db increase in sound level, the sound pressure increases by a factor of 10; the sound level range from 0 db to 120 db covers 6 factors of 10, or one million, in sound pressure. However, for an increase of 10 db in sound level as measured by a meter, humans perceive an approximate doubling of apparent loudness: to the human ear, a sound level of 70 db sounds about twice as loud as a sound level of 60 db. Smaller changes in sound level, less than 3 db up or down, are generally not perceptible. Frequency Spectrum of Sound The frequency of a sound is the rate at which it fluctuates in time, expressed in Hertz (Hz), or cycles per second. Very few sounds occur at only one frequency: most sound contains energy at many different frequencies, and it can be broken down into different frequency divisions, or bands. These bands are similar to musical pitches, from low tones to high tones. The most common division is the standard octave band. An octave is the range of frequencies whose upper frequency limit is twice its lower frequency limit, exactly like an octave in music. An octave band is identified by its center frequency: each successive band s center frequency is twice as high (one octave) as the previous band. For example, the 500 Hz octave band includes all sound whose frequencies range between 354 Hz (Hertz, or cycles 22 The pascal is a measure of pressure in the metric system. In Imperial units, they are themselves very small: one pascal is only 145 millionths of a pound per square inch (psi). The sound pressure at the threshold of audibility is only 3 one-billionths of one psi: at the threshold of pain, it is about 3 onethousandths of one psi. 52 October 31, 2017

60 per second) and 707 Hz. The next band is centered at 1,000 Hz with a range between 707 Hz and 1,414 Hz. The range of human hearing is divided into 10 standard octave bands: 31.5 Hz, 63 Hz, 125 Hz, 250 Hz, 500 Hz, 1,000 Hz, 2,000 Hz, 4,000 Hz, 8,000 Hz, and 16,000 Hz. For analyses that require finer frequency detail, each octave-band can be subdivided. A commonly-used subdivision creates three smaller bands within each octave band, or so-called 1/3-octave bands. FIGURE 32: A SCALE OF SOUND PRESSURE LEVELS FOR TYPICAL SOUND SOURCES Human Response to Frequency: Weighting of Sound Levels The human ear is not equally sensitive to sounds of all frequencies. Sounds at some frequencies seem louder than others, despite having the same decibel level as measured by a 53
61 Blazing Star Wind Farm 2, LLC Blazing Star Wind Farm 2 Public Document - Trade Secret Data has Been Excised PRELIMINARY NOISE COMPLIANCE REPORT sound level meter. In particular, human hearing is much more sensitive to medium pitches (from about 500 Hz to about 4,000 Hz) than to very low or very high pitches. For example, a tone measuring 80 db at 500 Hz (a medium pitch) sounds quite a bit louder than a tone measuring 80 db at 60 Hz (a very low pitch). The frequency response of normal human hearing ranges from 20 Hz to 20,000 Hz. Below 20 Hz, sound pressure fluctuations are not heard, but sometimes can be felt. This is known as infrasound. Likewise, above 20,000 Hz, sound can no longer be heard by humans; this is known as ultrasound. As humans age, they tend to lose the ability to hear higher frequencies first; many adults do not hear very well above about 16,000 Hz. Most natural and man-made sound occurs in the range from about 40 Hz to about 4,000 Hz. Some insects and birdsongs reach to about 8,000 Hz. To adjust measured sound pressure levels so that they mimic human hearing response, sound level meters apply filters, known as frequency weightings, to the signals. There are several defined weighting scales, including A, B, C, D, G, and Z. The most common weighting scale used in environmental noise analysis and regulation is A-weighting. This weighting represents the sensitivity of the human ear to sounds of low to moderate level. It attenuates sounds with frequencies below 1000 Hz and above 4000 Hz; it amplifies very slightly sounds between 1000 Hz and 4000 Hz, where the human ear is particularly sensitive. The C-weighting scale is sometimes used to describe louder sounds. The B- and D- scales are seldom used. All of these frequency weighting scales are normalized to the average human hearing response at 1000 Hz: at this frequency, the filters neither attenuate nor amplify. When a reported sound level has been filtered using a frequency weighting, the letter is appended to db. For example, sound with A-weighting is usually denoted dba. When no filtering is applied, the level is denoted db or dbz. The letter is also appended as a subscript to the level indicator L, for example L A for A-weighted levels. Time Response of Sound Level Meters Because sound levels can vary greatly from one moment to the next, the time over which sound is measured can influence the value of the levels reported. Often, sound is measured in real time, as it fluctuates. In this case, acousticians apply a so-called time response to the sound level meter, and this time response is often part of regulations for measuring sound. If the sound level is varying slowly, over a few seconds, Slow time response is applied, with a time constant of one second. If the sound level is varying quickly (for example, if brief events are mixed into the overall sound), Fast time response can be applied, with a time constant of one-eighth of a second. 23 The time response setting for a sound level measurement is indicated with the subscript S for Slow and F for Fast: L S or L F. A sound level meter set to Fast time response will indicate higher sound levels than one set to Slow time response when brief events are mixed into the overall sound, because it can respond more quickly. 23 There is a third time response defined by standards, the Impulse response. This response was defined to enable use of older, analog meters when measuring very brief sounds; it is no longer in common use. 54 October 31, 2017
62 In some cases, the maximum sound level that can be generated by a source is of concern. Likewise, the minimum sound level occurring during a monitoring period may be required. To measure these, the sound level meter can be set to capture and hold the highest and lowest levels measured during a given monitoring period. This is represented by the subscript max, denoted as L max. One can define a max level with Fast response L Fmax (1/8-second time constant), Slow time response L Smax (1-second time constant), or Continuous Equivalent level over a specified time period L EQmax. Accounting for Changes in Sound Over Time A sound level meter s time response settings are useful for continuous monitoring. However, they are less useful in summarizing sound levels over longer periods. To do so, acousticians apply simple statistics to the measured sound levels, resulting in a set of defined types of sound level related to averages over time. An example is shown in Figure 33. The sound level at each instant of time is the grey trace going from left to right. Over the total time it was measured (1 hour in the figure), the sound energy spends certain fractions of time near various levels, ranging from the minimum (about 27 db in the figure) to the maximum (about 65 db in the figure). The simplest descriptor is the average sound level, known as the Equivalent Continuous Sound Level. Statistical levels are used to determine for what percentage of time the sound is louder than any given level. These levels are described in the following sections. Equivalent Continuous Sound Level - LEQ One straightforward, common way of describing sound levels is in terms of the Continuous Equivalent Sound Level, or L EQ. The L EQ is the average sound pressure level over a defined period of time, such as one hour or one day. L EQ is the most commonly used descriptor in noise standards and regulations. L EQ is representative of the overall sound to which a person is exposed. Because of the logarithmic calculation of decibels, L EQ tends to favor higher sound levels: loud and infrequent sources have a larger impact on the resulting average sound level than quieter but more frequent sounds. For example, in Figure 33, even though the sound levels spends most of the time near about 34 dba, the L EQ is 41 dba, having been inflated by the maximum level of 65 dba and other occasional spikes over the course of the hour. 55

63 Blazing Star Wind Farm 2, LLC Blazing Star Wind Farm 2 Public Document - Trade Secret Data has Been Excised PRELIMINARY NOISE COMPLIANCE REPORT FIGURE 33: EXAMPLE OF DESCRIPTIVE TERMS OF SOUND MEASUREMENT OVER TIME Percentile Sound Levels LN Percentile sound levels describe the statistical distribution of sound levels over time. L N is the level above which the sound spends N percent of the time. For example, L 90 (sometimes called the residual base level ) is the sound level exceeded 90% of the time: the sound is louder than L 90 most of the time. L 10 is the sound level that is exceeded only 10% of the time. L 50 (the median level ) is exceeded 50% of the time: half of the time the sound is louder than L 50, and half the time it is quieter than L 50. Note that L 50 (median) and L EQ (mean) are not always the same, for reasons described in the previous section. L 90 is often a good representation of the ambient sound in an area. This is the sound that persists for longer periods, and below which the overall sound level seldom falls. It tends to filter out other short-term environmental sounds that aren t part of the source being investigated. L 10 represents the higher, but less frequent, sound levels. These could include such events as barking dogs, vehicles driving by and aircraft flying overhead, gusts of wind, and work operations. L 90 represents the background sound that is present when these event sounds are excluded. Note that if one sound source is very constant and dominates the soundscape in an area, all of the descriptive sound levels mentioned here tend toward the same value. It is when the sound is varying widely from one moment to the next that the statistical descriptors are useful. 56 October 31, 2017

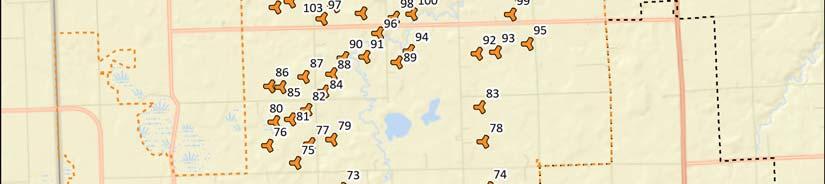
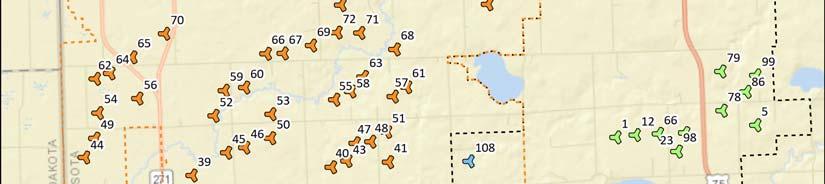
64 APPENDIX B: SOURCE INFORMATION FIGURE 34: SOURCE LOCATIONS NORTHERN HALF 57


65 Blazing Star Wind Farm 2, LLC Blazing Star Wind Farm 2 Public Document - Trade Secret Data has Been Excised PRELIMINARY NOISE COMPLIANCE REPORT FIGURE 35: SOURCE LOCATIONS SOUTHERN HALF 58 October 31, 2017