Human viruses in deep groundwater in Wisconsin: Implications for public health, water treatment, and groundwater protection
|
|
|
- Junior Short
- 5 years ago
- Views:
Transcription


1 Human viruses in deep groundwater in Wisconsin: Implications for public health, water treatment, and groundwater protection Kenneth R. Bradbury Wisconsin Geological and Natural History Survey University of Wisconsin-Extension Wisconsin Soil and Water Conservation Society Annual Conference 2/9/12
2 Waterborne Disease Outbreaks in the USA From 1971 to 2002 there were 716 outbreaks associated with an infectious agent in drinking water 60% of the outbreaks were attributable to groundwater Pathogen in more than 50% of outbreaks is unknown and assumed viral Summarized from CDC reports, e.g., MMWR, 2004, 53(SS08);23-45
3 Examples of Groundwater-borne Disease Outbreaks South Bass Island, OH 2004 Campylobacter jejuni, Salmonella typhimurium, norovirus, and Giardia in private and municipal wells 1,450 persons ill Missouri 1999 Salmonella typhimurium in municipal well 124 persons ill Walkerton, Ont E. coli O157:H7 in municipal well Of 4,800 residents, 2,300 became ill 7 died Wyoming 2001 Norovirus in noncommunity, transient well At least 84 patrons ill Door County WI 2007 Norovirus in restaurant well At least 229 patrons/employees ill 6 hospitalized
4 Take-home messages Groundwater supplied from deep, confined bedrock aquifers is usually assumed to be protected from contamination and free of pathogenic organisms, but the presence of viruses in deep wells in Madison, Wisconsin shows that pathogenic surface contaminants can reach deep aquifers over relatively short time spans.
 might explain virus")
5 furthermore Viruses were found in every well tested Leaky sewers are a likely virus source Virus transport to wells appears to be much more rapid than standard groundwater models suggest Rapid flow through discrete geologic features (fractures) might explain virus occurrence


 Protozoa,")


6 Pathogens in Human Wastewater Bacteria (e.g., Campylobacter, Salmonella, E. coli O157:H7, Aeromonas) Protozoa, (e.g., Cryptosporidium, Giardia, Toxoplasma) 1,438 pathogens infect humans of which 32 are waterborne in the U.S. Viruses (e.g., adenovirus, enterovirus, rotavirus)
7 Particulate transport Particulates and common diameters Colloids (<0.2 um) Bacteria (~.2 20 um) Viruses (~50 nm) (1000 nm= 1um; 1nm is one billionth of a meter) For comparison Human hair (~ um) Rock fracture (1 um 1 mm -?) Viruses are often much smaller than fracture apertures or rock pores.

8 Public supply wells in Wisconsin Currently, 66 municipal water systems in Wisconsin do not disinfect water
9 Background Initial virus sampling conducted as part of AWWARF (now Water Research Foundation)- funded study of aquitards We wanted to find out whether viruses were present in a deep, confined bedrock aquifer We did not expect to find any because the travel times were supposedly much longer than the virus lifetimes
10 Acknowledgements: co-authors, field workers, and cooperators Madeline Gotkowitz, Dave Hart, Pete Chase, Andrew Aslesen, Jake Krause, Wisconsin Geological and Natural History Survey Mark A. Borchardt, Susan K. Spencer, Marshfield Clinic Research Foundation Chris Gellasch, Jean Bahr, University of Wisconsin-Madison Randy Hunt, U.S. Geological Survey John Cherry, Beth Parker, University of Waterloo, Ontario Madison Water Utility Madison Municipal Sewerage District Wisconsin DNR Groundwater Joint Solicitation Program


11 Study Objective Evaluate the occurrence of human viruses in the Mount Simon aquifer, a confined, deep sandstone aquifer in south-central Wisconsin.


12 Wisconsin Geology bedrock glacial Wisconsin s geologic history created important bedrock and glacial aquifers. Aquitards control groundwater flow and quality in both settings.


13 Dane County geology... The next slide shows a cross section along this line... glacial geology
14 Groundwater moves downward and laterally through Dane County s aquifers... Hydrogeologic Cross Section Blue Mounds Domestic wells the lakes Sandstone & dolomite Mt Horeb Verona water table Glacial deposits Madison Eau Claire shale Mt Simon & Eau Claire sandstones sandstone aquifer city well Granite

15
16 Units in the sandstone aquifer aquifer 16 aquitard aquifer


17 Microscope image of sandstone from a Madison supply well. Clean, wellrounded quartz grains are generally non-reactive. Core of Cambrian sandstone from the Madison area. Sand is clean, well-sorted, well rounded, predominately quartz.


18 18 Core sample of the Eau Claire shale (aquitard)


19 Eau Claire aquitard 19

20 Wells sampled We began with 10 wells in a variety of locations to be sure we had virus-positive wells to work with. We later reduced the sampling to 6 wells due to budget and logistic considerations.


21 Virus Sampling
22 Study Methods Virus samples collected monthly. All samples taken prior to chlorination qrt-pcr/qpcr detection of enterovirus, rotavirus, hepatitis A virus, norovirus, and adenovirus Enterovirus and adenovirus serotype determined by nucleic acid sequencing; infectivity determined by cell culture Isotopes ( 3 H, 2 H, 18 O) analyzed at the University of Waterloo Environmental Isotope Lab
23 Construction of Madison supply wells Typical (newer wells) well Some older wells (1928) Note shallow casing well 50 glacial materials water table 50 casing glacial materials shallow aquifer water table relative depths, feet below surface casing open hole shallow aquifer aquitard deep aquifer potentiometric surface relative depths, feet below surface open hole aquitard deep aquifer potentiometric surface 800 crystalline rock 730 crystalline rock not to scale not to scale
24 well well 11 well 12 well 13 relative depths, feet below surface casing open hole glacial materials shallow aquifer aquitard deep aquifer water table potentiometric surface relative depths, feet below surface 18 open hole casing open hole casing open hole casing crystalline rock not to scale 986 Construction details of the municipal wells sampled throughout the project. Diagram at upper left shows typical hydrostratigraphy and well construction for the Madison area. relative depths, feet below surface well 7 casing open hole well 19 open hole casing well 30 open hole casing 312 not to scale

25 Wells sampled We began with 10 wells in a variety of locations to be sure we had virus-positive wells to work with. We later reduced the sampling to 6 wells due to budget and logistic considerations.
26 Overall findings We found viruses in every well sampled in , though not every time sampled Summary of virus detections by water source, wells 7, 11, 12, 13, 19, 30 only. virus detection (gc/l) water source wells Lake Mendota sewage influent number of samples percent positive min max mean ,900 36,310,000 2,010,000
27 Most frequently detected viruses, by rank. Number of detections in parentheses. Multiple viruses indicate a rank tie. Rank wells sewage lakes 1 A41 (38) A41 (18) A41 (12) 2 A31 (12) A31 (15) A2, E3 (3) 3 A2 (11) A2, E3 (5) A31, E11, E30 (2) 4 E3 (5) E9 (4) -- 5 E30, A7 (4) A6, E11 (3) -- 6 Cox A16, Cox B3, Cox B4, E11 (3) Cox A16, Cox B4 (2) -- 7 A5, E6, E9, E71 (1) A5, A7, E6, E30, E71, E? (1) --


28 was an unusually wet period; large storms in August 2007 and June 2008


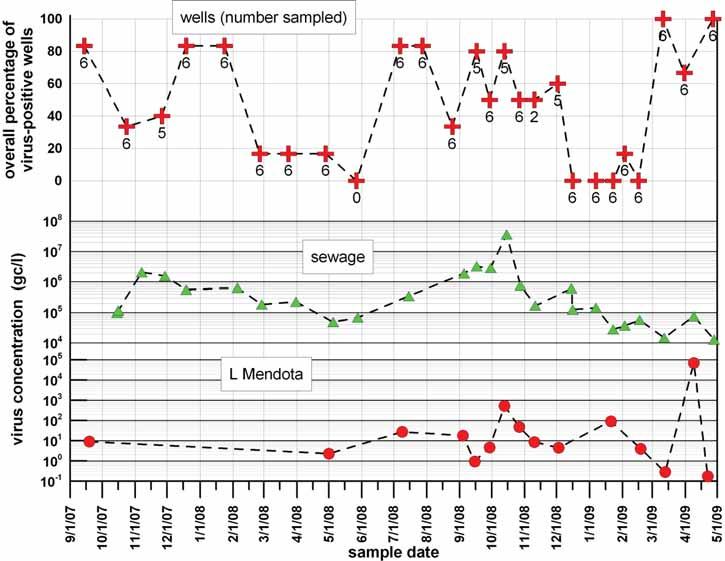
29 Coincidence with time The coincidence of virus detections in wells, lakes, and sewage is surprising.

30 Well Virus Concentrations - Coincidence with Time percentages indicate positive detections note scale changes Coincidence of peaks in wells miles apart suggests a regional problem
31 16 different species (serotypes) of viruses were identified in wells, sewage, and lake water during this study, and in many cases wells and sewage contained identical virus serotypes. Detected viruses include Enteroviruses echovirus 3, echovirus 11, Coxsackie A16, B3, and B4, Adenoviruses 2, 7, 31, and 41. Sample round lakes all wells sewage median sample date 14-Sep Oct Nov Dec Jan Feb Mar Apr May-08 7-Jul Jul Aug-08 A41 x x x x x x NS x x x x x x x x x x x x x A31 x x x x NS x x x x x x x x x x x x A2 x x x x x NS x E3 x x NS x x x E30 NS x x A7 x NS E11 x x x x NS CoxA16 x NS x CoxB3 NS CoxB4 x NS x A41 x x x x x x x x x x x x x x x x x x A31 x x x x x x x A2 x x x x x x x E3 x x x E30 x x A7 x x x x E11 x x x CoxA16 x x CoxB3 x x CoxB4 x A41 x NS NS NS NS NS NS NS x NS x x x x x x x x A31 NS NS NS NS NS NS NS NS x x A2 x NS NS NS NS NS NS x NS x NS E3 NS NS NS NS NS NS NS x NS x x E30 NS NS NS NS NS NS NS x NS A7 NS NS NS NS NS NS NS NS E11 NS NS NS NS NS NS NS NS x x CoxA16 NS NS NS NS NS NS NS NS CoxB3 NS NS NS NS NS NS NS NS CoxB4 NS NS NS NS NS NS NS NS 17-Sep Sep Oct Oct Nov-08 2-Dec Dec-08 7-Jan Jan-09 3-Feb Feb Mar Mar Apr-09
32 There is coincidence between serotypes present in sewage and serotypes present in groundwater. Sample round lakes all wells sewage median sample date 14-Sep Oct Nov Dec Jan Feb Mar Apr May-08 7-Jul Jul Aug-08 A41 x x x x x x NS x x x x x x x x x x x x x A31 x x x x NS x x x x x x x x x x x x A2 x x x x x NS x E3 x x NS x x x E30 NS x x A7 x NS E11 x x x x NS CoxA16 x NS x CoxB3 NS CoxB4 x NS x A41 x x x x x x x x x x x x x x x x x x A31 x x x x x x x A2 x x x x x x x E3 x x x E30 x x A7 x x x x E11 x x x CoxA16 x x CoxB3 x x CoxB4 x A41 x NS NS NS NS NS NS NS x NS x x x x x x x x A31 NS NS NS NS NS NS NS NS x x A2 x NS NS NS NS NS NS x NS x NS E3 NS NS NS NS NS NS NS x NS x x E30 NS NS NS NS NS NS NS x NS A7 NS NS NS NS NS NS NS NS E11 NS NS NS NS NS NS NS NS x x CoxA16 NS NS NS NS NS NS NS NS CoxB3 NS NS NS NS NS NS NS NS CoxB4 NS NS NS NS NS NS NS NS 17-Sep Sep Oct Oct Nov-08 2-Dec Dec-08 7-Jan Jan-09 3-Feb Feb Mar Mar Apr-09


33 Sewers are ubiquitous in urban areas. This graphic shows only regional connector sewers. There are hundreds of miles of local sewers. The older sewers are nearly 100 years old. Source:


34 Sewer Locations Relative to the Water Table Cross sections showing the possible locations of a sewer relative to the water table. A: gravity-drain sewer below water table; B: gravity-drain sewer above water table; C: force main above water table; D: force main below water table. H 1 and H 2 represent hydraulic head inside and outside the sewer. Arrows show directions of potential sewer leakage. Sewers are a potential virus source. Some Madison sewers are in hydraulic positions that allow them to leak to groundwater.
35 How Did the Viruses Reach the Deep Aquifer? (assume continuous aquitard) Is t 1 + t 2 + t 3 < Virus survival time (~ 2 years)? K bulk-vert ~ 2 x 10⁻⁴ cm/s K bulk-vert ~ 2 x 10⁻⁴ cm/s K bulk-horiz ~ 3.5 x 10⁻³ cm/s
?")
36 If we pick the right parameters, transport to the aquifer could occur with the virus lifetime Is t 1 + t 2 + t 3 < Virus survival time (~ 2 years)? But, other transport pathways are also possible
37 Possible Transport Pathways Through 1) fractures Aquitard 2) depositional or erosional stratigraphic windows 3) down cross-connecting open wells or boreholes 4) along damaged, deteriorated, poorly sealed well annulus or breaches in well casings We still have not determined the pathway research continues!
38 CURRENT WORK sanitary sewer (nonpoint source) monitoring wells Unit Well 7 glacial sediments water table Tunnel City Group 6m Wonewoc Formation well casing Eau Claire aquitard Mt. Simon aquifer (confined) open borehole Not to scale


39 Geophysical logs of monitoring well adjacent to Madison well #7 A major fracture exists at 80 feet.


40 Dipping fracture at 165 ft Large horizontal fracture at 80 ft


41 Installing a FLUTE liner at well 7
42 So what, do viruses matter? Consider- In a recent ( ) evaluation of 14 Wisconsin communities using untreated water, viruses were found in wells from every system. And Using a crossover-control study design, Dr. Mark Borchardt and colleagues (Marshfield Clinic) estimate that about 15% of the annual gastro-intestinal illness in these communities can be attributed to consuming untreated water.
43 Should communities be required to disinfect public water?? Following our studies in 2009, the DNR decided to require all communities to disinfect public water supplies. Last year (2011) the Legislature voted to make it illegal to require disinfection. Reasons given included cost, taste, and a desire for local decision-making Cost of illness was not considered
44 Implications/Recommendations Human viruses can be commonly present in groundwater in deep bedrock wells. Communities that use groundwater for a drinking water source should ensure that chlorination or other disinfection levels are sufficient to deactivate viruses. Sampling for viruses requires a time series approach because virus concentrations, and virus species, vary with time in individual wells. Untreated sewage contains very high concentrations of viruses and should be considered a source of groundwater contamination. Human enteric viruses potentially represent a powerful new tracing tool for hydrogeologic studies. Fundamental and applied research on the use and effectiveness of viruses as tracers should be undertaken.
45 Recent Publications Borchardt, M. A.; Bradbury, K.R.; Gotkowitz, M. B.; Cherry, J. A.; Parker, B. L Human enteric viruses in groundwater from a confined bedrock aquifer. Environmental Science and Technology. 41(18); Bradbury, K.R., M.A. Borchardt, M. Gotkowitz, and R.J. Hunt Assessment of Virus Presence and Potential Virus Pathways In Deep Municipal Wells. WGNHS Open-File report p. Bradbury, K.R., M.A. Borchardt, M. Gotkowitz, and S. Spencer Human viruses as tracers of wastewater pathways into deep municipal wells. Final report to the Wisconsin Department of Natural Resources. 47 p.

46 Thank You Questions?