The Gulf Coast Carbon Center: Exploring Synergies between gasification and CO2 Sequestration
|
|
|
- Eustacia Griffith
- 5 years ago
- Views:
Transcription


1 The Gulf Coast Carbon Center: Exploring Synergies between gasification and CO2 Sequestration Ian J. Duncan Bureau of Economic Geology Jackson School of Geosciences The University of Texas at Austin

2 Bureau of Economic Geology Energy, Environment, Education QAd2349x


3 BUREAU OF ECONOMIC GEOLOGY Established in 1909 Oldest research unit of The University of Texas at Austin Geological Survey of Texas
4 Bureau of Economic Geology Provides extensive advisory, technical, and informational services Conducts basic and applied research Energy Industrial Associates Basin analysis Reservoir Characterization Environmental and Earth Systems Airborne Geophysics Coastal and environmental studies Geologic mapping Hydrogeology Geologic sequestration Education and Outreach
5

6 CO2 Sequestration CO2 contributes to climate change Geologic sequestration is one way to reduce atmospheric releases of CO2 Critical assessment of geologic and engineering aspects of CO2 sequestration is needed
7 GCCC Vision Statement The GCCC seeks to impact global levels of GHG in the atmosphere by doing science and engineering studies that will support reduction of CO2 and methane emissions and enable the development of an economically viable, multifaceted, CO2 sequestration industry in the Gulf Coast

8 Why the Gulf Coast? Image shows concentrations of stationary sources of CO2 superimposed on the thickness of the subsurface


9 GCCC Industry Partners

10 Other GCCC Collaborators DOE-NETL Southeast Regional Sequestration Partnership (SECarb); Southwest Regional Sequestration Partnership Environmental research, NGO s Environmental Defense, National Resources Defense Council Houston Sierra Club Other research teams National labs, NETL, LBNL,LLNL, ORNL, PNL; USGS; HARC; UT ESI; Louisiana Geological Survey, Australian CO2CRC Mike Moore (Falcon Environmental) GCCC consultant in carbon credits markets UT Department of Petroleum Engineering, internationally recognized leaders in CO2 enhanced oil recovery (EOR) research.
11 Core Competencies Conducting large scale field projects that demonstrate the viability of geologic sequestration of CO2 Establishing best practices for CO2 Monitoring, Measurement and Verification using risk analysis Economic modeling of the future CO2 value chain for the Gulf Coast Using next generation reservoir characterization to optimize CO2 EOR

12 Field Demonstration - Monitoring at Frio Pilot Gas wells Aquifer wells (4) Access tubes, gas sampling Downhole P&T Wireline logging Tracers Downhole sampling U-tube Gas lift Radial VSP Cross well Seismic, EM

13 Injection Well Observation Well
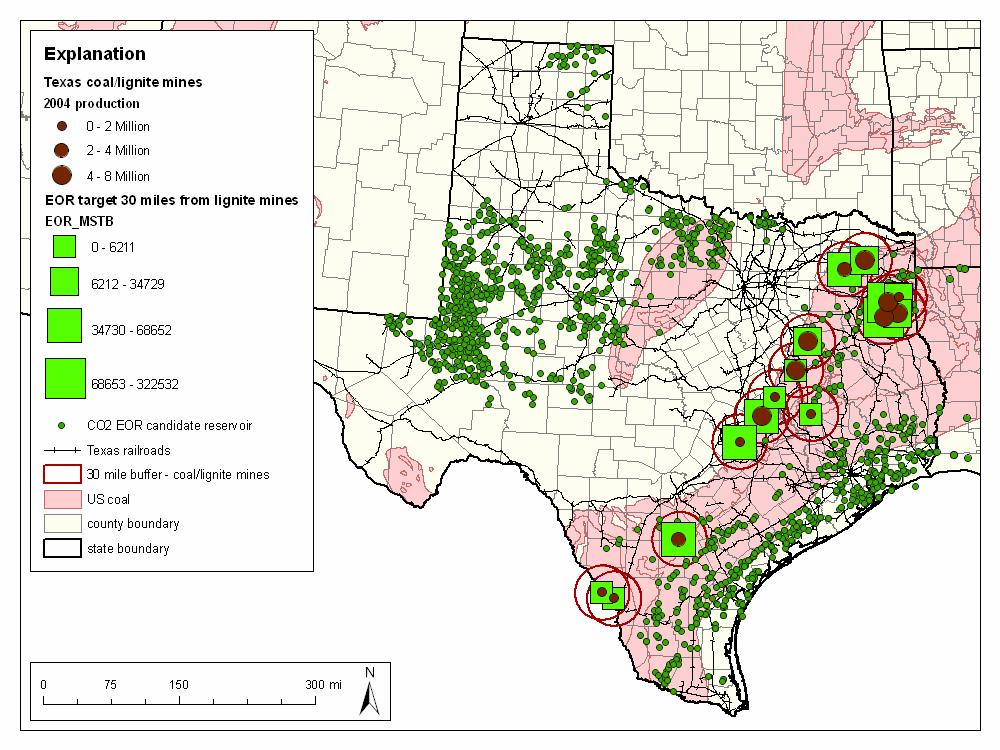
14 Main GCCC Results to Date Quantification of CO2 market for EOR in GIS (spatial inventory) Successful field demonstration (Frio I Project) of monitoring and modeling techniques to measure subsurface storage of CO2, assure public and environmental safety and effectiveness of this process Demonstration of significance of two phase trapping in assuring permanence of CO2 storage Development of enhanced screening methodology for EOR prospects
15 Model for Stacked Storage in the Gulf Coast Validation of adequacy of permitting and monitoring protocols Near-term and long-term sources and sinks linked in a regional pipeline network Linked enhanced oil and gas production to offset development cost and speed implementation Very large volume storage in stacked brine formations beneath reservoir footprints
16 Message to Legislatures National Energy supply benefits from applying CO2 enhanced oil recovery processes in Texas and the Gulf Coast. The Environment benefits from capturing and storing a major greenhouse gas. The Economy benefits from: Enhanced oil recovery (EOR) including wellhead value, taxes, and jobs. Carbon credits from around the world could come to the Gulf Coast owing to a unique association of large volume storage capacity and CO2 sources Jobs created by infrastructure development associated with a CO2 sequestration industry
17 Future Trends for Fossil Energy Utilization in the US
18

19 THE US IS THE SAUDI ARABIA OF COAL
20 THE US IS THE SUADI ARABIA OF COAL What are the Implications for the Oil Industry High oil prices and National Security will drive gasification of coal and production of synthetic diesel for DOD Environmental NGO s driving power companies to decarbonize fuel. CO2 sequestration Cheap CO2 available for EOR

21 GULF COAST CO2 BASED ENHANCED OIL RECOVERY SCENARIOS
22 CO2 Miscible Flooding Mechanisms Large density at reservoir conditions makes the CO2 a good solvent for light hydrocarbons The formation of a single phase diminishes the capillary forces Miscibility with the CO2 lowers the viscosity of the oil and increases its mobility. Miscibility Region (CO2 and Oil Form Single Phase) Pure CO2 CO2 Vaporizing Oil Components Direction of Displacement CO2 Condensing Into Oil Original Oil

23 CO2 Flooding under Miscible Conditions
24 Selection of Candidates Suitable for CO2 Miscible Flooding Minimum Miscibility Pressure (MMP) within an achievable range CO2 Minimum Misciility Pressure % Recovery at 1.2 HCPV of CO2 Injected CO2 Thermodynamic MMP Test Pressure, psia
25 United States CO2 EOR 2 Bcf/day (~35 MMTY) of CO2 currently injected for EOR, largely in the Permian Basin ~ % of CO2 for EOR is anthropogenic (~ 7 MMTY) CO2 annual emissions from all fossil energy is ~ 6 GT Annual U.S. oil consumption is ~7 BSTB and annual oil production is ~3.2 BSTB Current U.S. CO2 EOR Production ~ 6 MBOPD, 7.5 MMBOPY 4% of U.S. production, 66 active projects, 50 in Permian Basin
,")
26 United States CO2 EOR Source: Beecy (03), ARI
27 Converging Forces Energy, Environment, Economy Energy supply benefits from applying CO2 enhanced oil recovery processes in Texas and the Gulf Coast. The Environment benefits from capturing and storing a major greenhouse gas. The Economy benefits from Enhanced oil recovery (EOR) including wellhead value, taxes, and jobs. Net positive carbon credits in Texas and the Gulf Coast owing to large volume storage capacity Jobs created by infrastructure development associated with a CO2 sequestration industry
28 Why the Gulf Coast? The Gulf Coast region accounts for approximately 16% of the U.S. annual CO2 emissions from fossil fuels. Annual emissions of CO2 in Texas, Louisiana and Mississippi are ~ 1 billion metric tons (1 GT), and Texas alone emits 667 million metric tons of CO2. Source-sink proximity Stacked Sinks ; oil fields and large volume brine aquifers Regional and local geology is well understood Some infrastructure in already in place Economic feedback, whereby State incentives for capture are recovered via taxes on CO2 EOR
29 Focus on the Gulf Coast Ozone non attainment Selected oil field that could benefit from EOR Existing CO2 pipeline Frio Brine Pilot Sources (dot size =release) Refineries and chemical plants Electric power plants Future CO2 pipeline Saline Formations Anthropogenic CO2 stationary source data from Hendriks and others, IEA Greenhouse Gas R&D Program, 02).
30 Anthropogenic CO2 14,000 U.S. others Gulf Coast (TX, LA, MS) 12,000 10,000 Historical Forecast 8,000 6,000 4,000 2, Annual Emissions (MM metric tons of CO The Gulf Coast Wedge Historical and Forecast of U.S. and Gulf Coast region CO2 emissions from fossil fuels (Data from CDIAC and EIA websites).
31 Converting CO2-EOR to Storage Permanently store CO2 in reservoir after EOR has been completed Reservoir characterization and simulation for long term storage Long term measurement, monitoring, and verification (MMV) systems.
32 Optimizing CO2 Storage CO2 bulk volume residual (kgm/m3) Maximum storage capacity ,000 10,000 Depth (ft) 15,000
33 Screening Criteria for CO2 Storage/EOR Minimum miscibility pressure Cumulative and current annual oil production Storage potential (metric tons of CO2) Distance from CO2 source Reservoir Geology Cultural character (Urbanization, Unitization)
34 Oil-reservoir database Cumulative production > 1 MMSTB No Rejected Yes Yes Minimum miscibility pressure (depth, temp., pressure, oil character) No DECISION TREE FOR SCREENING CANDIDATE RESERVOIRS Rejected Unknown No Yes Reservoir depth > 6000 ft Yes Candidate reservoirs Has reservoir been waterflooded? Yes No Candidate for secondary recovery Does reservoir have water- drive mechanism? No Rejected
35 Past Gulf Coast CO2 EOR Water-alternating gas (WAG) Example Quarantine Bay, Chevron 1991 Results 16.9% recovery of OOIP, 188 Mstb recovered CO2 utilization 2.57 Mcf/stb recovered Gravity stable flood Example Weeks Island, Shell ( Johnston, 1988) Results 64% of starting oil volume, 261 Mstb Design 24 % pore-volume CO2 w/ 6 % CH4 CO2 utilization 7.9 Mcf/stb with recycle

36 Areas With Miscible CO2-EOR Potential
37 Residual Oil Resources in Texas (Non Permian Basin) Total > 38 Billion STB 9,637,000 MSTB 13,580,000 M STB Gulf Coast Texas Cretaceous Margin East Texas North Central Texas 2,051,290 MSTB 13,105,709 MSTB
38 Residual Oil Resources in Texas (Non Permian Basin) 15% Recovery Total = 5.7 billion STB 1,445,550 2,037,000 Gulf Coast Texas Cretaceous Shelf Margin East Texas North Central Texas 307,694 1,965,856
39 Pipelines
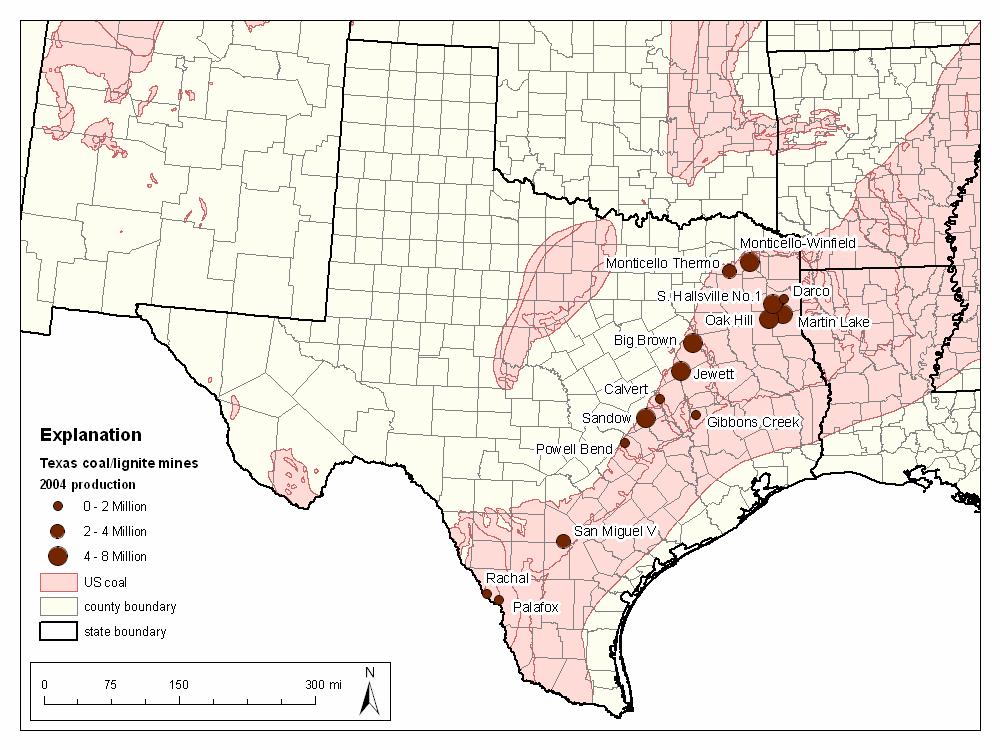
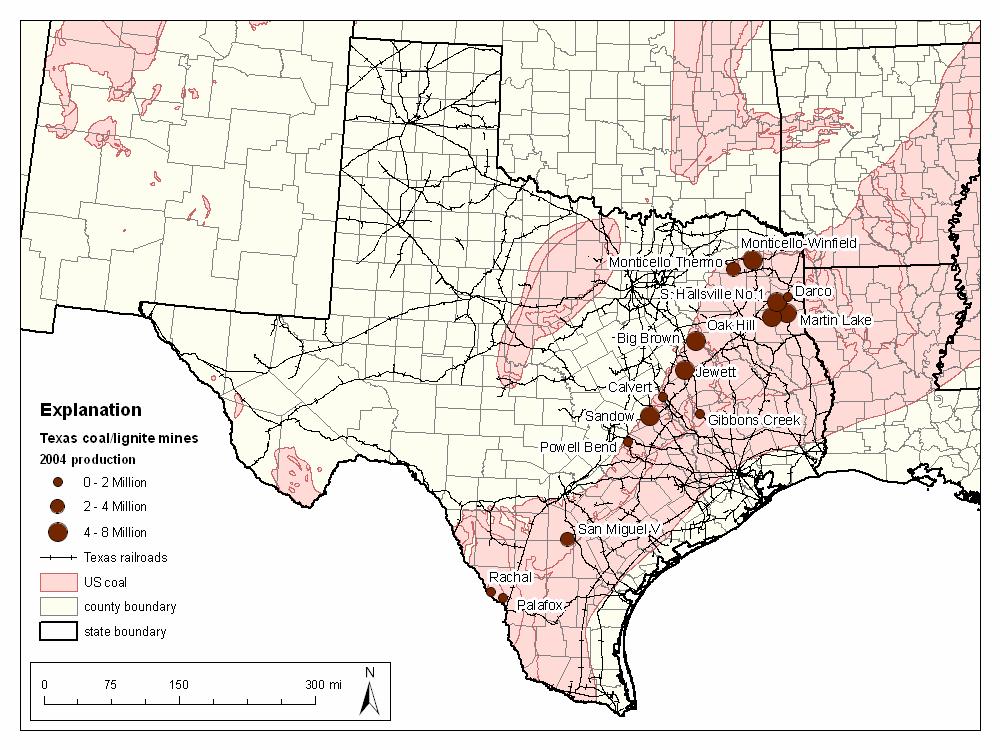
40 Coal Resources and Mines
41
42 Economics Anthropogenic CO2-EOR Competes with natural source CO2, priced at $10-$15/Ton, delivered at pressure. High purity (95+%) CO2 preferred. Cost of compression and transportation to sinks are significant. Near-term opportunities for low-cost capture and CO2-EOR are offered by high concentration CO2 sources. Production of additional domestic oil is value added benefit. EOR and carbon tax incentives will provide economic incentives for CO2-EOR for sequestration.
43 Storage Volumes Annual production in Gulf Coast (37,000 km3) is ~1 GT CO2 with emissions doubling over 50 years Total EOR CO2 storage is 0.7 GT Brine filled storage is ~ 222 GT CO2 in only 1% of brine-filled volume in sandstones from 4000 ft-12,000 ft
44 Technical Advances Since the 1980 s to Improve EOR Results 3D seismic for delineating fault blocks Directional drilling for placing wells Reservoir characterization for designing flood Improved knowledge of CO2 flooding
45 The Size of the Prize State Revenue $/bbl CO2-EOR Resource Oil Price (B bbls) ($/bbl) Wellhead Value (B $) $171 $228 $285 CO2 Sequestered CO2 Sequestered CO2 Sequestered (metric tons, tonnes) (Gigatonne, Gt) CO2-EOR Resource (B bbls) (tons) ,565, ,112,455 Economic Wellhead Taxes Value Jobs Created (19.1 jobs per Severance Taxes Ad Valorem Taxes $1MM Wellhead Value) ($B, 4.6%) ($B, 3.95%) $30 $8 $10 $40 $13 (Wellhead Franchise Taxes Valuex2.91) ($B, 0.18%) $15 billion $7 $9 $11 Other Taxes 3,266,100 4,354,800 $19 5,443,500 $498 $663 billion $829 Sales Taxes ($B, 2%) $11 billion $0.9 $1.2 $14 $1.5 $10 $13 billion $17 $50 $24 billion $19 billion $60 $30 billion $22billion 0.73 State Incentives for Capture Cost *Calculations based on the TX RRC's "General Model of Oil and Gas Impact on the Texas Economy" derived from the Comptroller's Input-Output model of the Texas economy. Severance and Ad Valorem Taxes from Wellhead Value; Indirect Taxes from Economic $70/ton capture = $51 $/ton capture = $15 billion We may be closer than we think!

46 Thanks! For more information:
47
48
49
50 Anthropogenic CO2 in the Gulf Coast Region 14,000 U.S. others Gulf Coast (TX, LA, MS) Annual Emissions (MM metric tons of CO2) 12,000 10,000 Historical Forecast 8,000 6,000 4,000 2, Historical and forecast U.S. and Gulf Coast CO2 emissions from fossil fuels Data from CDIAC and EIA websites
51 Selection of Candidates Suitable for Miscible Flooding Molecular Weight C5+ vs. Oil gravity (Lasater, 1958) 100 Oil Gravity, oapi Molecular Weight C
52 Selection of Candidates Suitable for Miscible Flooding Temperature gradient non-linear regression used for the Frio Plays 5, 6, 7, and 10 Temp = 0.015Depth Non-linear regression for the molecular weight of the C MW = o API
53 Selection of Candidates Suitable for Miscible Flooding Non-linear Multiple Regression for the Minimum Miscibility Pressure, MMP MMP = (7.727 * MW *1.005T ) * MW