Mechanisms for NO x Formation in Combustion Systems
|
|
|
- Irene Phelps
- 5 years ago
- Views:
Transcription
1 NO x Emissions: Where Have We Been and Where are We Going? H. Christopher Frey, Ph.D. Professor frey@ncsu.edu Dept. of Civil, Construction, and Environmental Engineering Raleigh, North Carolina Prepared for: Workshop on Nitrogen Assessment Science in the USA Denitrification Research Coordination Network Boulder, Colorado May 18, 2010 Mechanisms for NO x Formation in Combustion Systems Thermal NO x : Thermal fixation of N 2 and do 2 from combustion air at high temperature Air is approximately 79 volume percent N 2 and 20.9 volume percent O 2 1 N O2 NO 2 2 NO formation is endothermic Fuel NO x : conversion of fuel-bound nitrogen to NO x
2 Thermal NO x Equilibrium NO Concentration (ppm) Initial Conditions: 5%O Oxygen 75 % Nitrogen Temperature (K) Thermal NO x can be formed from any fuel combusted in air at sufficiently high temperature Fuel NO x Fuel N conversion to NO: NO O, H, OH Fuel N HCN NH i fast O, H, OH fast fast NH i, NO slow N 2 NH i slow Fuel NO x formation is sensitive to localized excess oxygen in the boundary layer surrounding a burning fuel particle, but is not sensitive to temperature Source: Seinfeld, 1988
3 Comparison of Fuels and NO x Emissions Coal Relatively l difficult to obtain good mixing i of solid fuel and air Localized variations in air/fuel ratio Typically 0.5 to 1.0 wt-% nitrogen in the fuel Oil Somewhat easier to mix liquid droplets with air Natural Gas Easiest to mix well with air compared to coal or oil Preventing NO x Emissions in the Combustor Improve mixing of fuel and air to avoid localized hot spots Reduce peak flame temperature (excess air, water/steam injection, catalytic combustion) Stage combustion: Primary zone: Fuel rich combustion to avoid thermal and fuel NO formation Secondary zone: Fuel lean combustion to oxidize products of incomplete combustion (burn-out) This is the idea behind Burners-out-of-Service (BOOS), Overfire Air (OFA), Low NOx Burners (LNB), and Reburning.
4 Staged Combustion Primary Air Secondary Air Fuel Fuel Rich Zone, φ > 1 Fuel Lean Zone, φ < 1 -Oxygen-Starved - Moderate peak temperature - Moderate peak temperature - Increased residence time - Burnout NO x formation in Reciprocating Engines The kinetics of NO formation are influenced by the time, temperature, and pressure history of each parcel of air in the cylinder. Parcels of air that burn early at the highest peak pressures and temperatures can reach thermal equilibrium. As the gases in the cylinder cool, the concentration of free radicals drops, slowing down chemical reactions and resulting in NO concentrations becoming frozen. Diesel engines operate with more excess oxygen and at significantly higher peak pressures than gasoline engines. (Diesel engines are more efficient).
5 Overview of NO x Emissions in the US: Annual NO x Emissions (Tons/Year) Everything Else All Mobile Sources Stationary Boilers Legend Everything Else All Mobile Sources Stationary Boilers Year Source: EPA Overview of NO x Emissions in the US: Annual NO x Emissions (Tons/Year) Nonroad Mobile Sources Onroad Mobile Sources Industrial Boilers Utility Boilers Year Legend Other Mobile-Nonroad Mobile-Onroad Stationary-Other Stationary-Industrial Stationary-Utility Source: EPA


6 Annual NO x Emissions (Tons/Year) Overview of NO x Emissions in the US: Legend Miscellaneous Solvent Nonroad Mobile Sources Onroad Mobile Sources Storage Metals Chemicals Waste Petroleum Industrial-Other Mobile-Nonroad 5000 Industrial Boilers Utility Boilers Year Mobile-Onroad Stationary-Other Stationary-Industrial Stationary-Utility Source: EPA Spatial Distribution of NO x Emissions tonnes NO yr km x 2 Source: NARSTO (2005)
7 Emission Inventory EI = ( EF ) i AF i i EI = Emission Inventory EF i = Emission factor for source category, i AF i = Activity factor for source category, i Energy Consum mption (Quadrillion BTU U/yr) 40.0 Energy Consumption by U.S. Electric Power Plants 35.0 Legend Oil Hydro Nuclear Natural Gas Coal Year Other Renewable Hydro Nuclear Natural_Gas Oil Coal Source: EIA
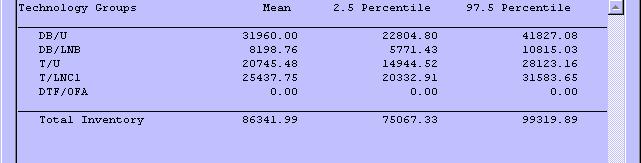
8 Examples of Power Plant NO x Controls TABLE 3-4 Example of Cost-Effectiveness Estimates for Utility Boiler NO x Control for a Generic Tangentially Fired Furnace: Comparison of Cost Effectiveness for Different Sizes and Capacity Factors Control Option a Cost effectiveness, $/ton Emission rate, lb of NO 2 / MW boiler at 30% capacity 600 MW boiler at 75% capacity Btu factor factor Uncontrolled 0.70 LNC , LNC , LNC , SCR , LNC1+SNCR , LNC2+SNCR , LNC3+SNCR , LNC1+SCR , LNC2+SCR , LNC3+SCR , a LNC1, LNC2, and LNC3 are various types of low-no x burner designs. Abbreviations: Btu, British thermal unit; lb, pound; MW, megawatt. Source: National Research Council (2006) report on New Source Review Effectiveness of Typical Control Technologies for Coal-Fired Power Plants 100 ical Control Efficiency (% %) Typi NO x Control Technology for Coal-Fired Boilers BOOS LEA OFA LNB LNB+OFA Reburn SNCR SCR LNB+SCR LNB+OFA+SCR Source: EPA, AP-42
9 NO x Emission Regulations for Utility Power Plants The 1971 New Source Performance Standards (NSPS) required that solid fossil fuel-fired utility boilers not emit more than 0.70 lb NO x (as NO 2 ) per million BTU of fuel consumed. In recent years, NSPS was not typically the binding standard. Best Available Control Technology (BACT) determinations under New Source Review were often more stringent than NSPS. The NO x SIP Call in the Eastern U.S., coupled with state programs, and the acid rain provisions of the Clean Air Act Amendment of 1990, have required retrofit of existing power plants with combustion and post-combustion controls. EPA issued a new NSPS for large steam boilers effective in 2005 at 130 ng/j of plant output. This is approximately equivalent to 0.10 lb NO x /10 6 BTU on a fuel input basis. This may lead to a requirement for post-combustion SCR control in many cases. How Low Can We Go? Any new or modified coal-fired plant must meet the 2005 NSPS or better (BACT). The current NSPS for a new large natural gasfired gas turbine is equivalent to approximately lb NO x /10 6 BTU of energy input. In-use emissions depend on the dispatch order of the power plant fleet. Emissions at the margin may differ significantly from the average. Market penetration of plug-in hybrid vehicles and electric vehicles could lead to increases in night time power demand, peak demand, or both.
10 Energy Consumption in the Transportation Sector r llons Consumed Per Year Million Gal Legend Other Jet Diesel Gasoline Year Source: EIA 250 Vehicle Activity in the U.S.: Numbered of Registered Vehicles Millions of Registered Vehicles 200 Legend Bus Truck - Combination Motorcycle Trucks: 6+ Tires Light Trucks: 4 tires Cars Year Source: BTS
11 Growth in Vehicle Miles Travelled Billion Ve ehicle Miles Travelled Legend Bus Motorcycle Truck_Combination Truck_6+_Tires Truck_4_Tire Car Year Source: BTS Simplified Schematic of U.S. Light Duty Gasoline Vehicle NO x Emission Standards ission Limit (g/mile) NO x Emi Year Source: BTS, EPA
12 Average Emission Rates, 2007, grams per mile Vehicle type Total HC Exhaust CO Exhaust NOx GASOLINE Light duty Light duty trucks Heavy duty DIESEL Light duty Light duty trucks Heavy duty Source: Table 4-39, National Transportation Statistics, 2007 Simplified Summary of Emission Standards for Heavy Duty Diesel Vehicles : 10.7 g/bhp-hr 1990: 6.0 g/bhp-hr : 5.0 g/bhp-hr (average) : 4.0 g/bhp-hr (average) : 2.4 g/bhp-hr combined with HC 2007-: 02g/bhphr 0.2 g/bhp-hr (phase in by 2010) Source: BTS, EPA
13 How Are the New HDDV Standards Being Met? (Can Diesel be Clean?) For NO x, many manufacturers are resorting to a combination of combustion and postcombustion controls. Post combustion control is typically based on selective catalytic reduction, a technology originally developed for power plants. A regulation for Ultra Low Sulfur Diesel (ULSD) is in place to enable the use of sulfursensitive post-combustion control technologies. Emerging Trends in Transportation NO x Emissions Fleet turnover to LDGV Tier 2 and HDDV Tier 4 will lead to ongoing reductions in real-world emissions over time. New standards are being implemented for nonroad engines, which include a large share of diesel (construction equipment, locomotives, marine engines). Biofuels Electric vehicles
14 Biofuels Ethanol (E85), if produced from corn, could lead to 82% higher life cycle NO x emissions compared to gasoline, even though tailpipe emissions average 8% less (Frey et al., 2009a). B20 Biodiesel could lead to NO x life cycle emissions approximately 2 to 5 percent higher than diesel fuel. Tailpipe pp emissions may be higher or lower depending on the vehicle (Frey et al., 2009b). Improved technologies for fuel production might mitigate some of these life cycle emissions increases. Plug-In Hybrid Electric Vehicles On average, NO x emissions associated with electricity use could offset NO x reductions from avoided gasoline use, depending on the power generation mix. Actual differences in NO x emissions will depend on time of day of electricity use, the power plant fleet and fuel mix, and the marginal dispatch of the power plants.
15 Current Practice for Qualifying Uncertainty in Emission Factors and Inventories Qualitative ratings for emission factors (AP-42) Data Attribute Rating System (DARS) (not really used in practice) Both methods are qualitative No quantitative interpretation Some sources of uncertainty (i.e. nonrepresentativeness) difficult to quantify Qualitative methods can complement quantitative methods EPA Emission Test Rating Rating Explanation A Tests are performed by a sound methodology and are reported in enough detail for adequate validation. B C D Tests are performed by a generally sound methodology, but lacking enough detail for adequate validation. Tests are based on an unproven or new methodology, or are lacking a significant amount of background information. Tests are based on a generally unacceptable method, but the method may provide an order-of-magnitude value for the source.
16 EPA Emission Factor Rating Rating A(E (Excellent) B (Above Average) C (Average) D (Below Average) E (Poor) Explanation Factor is developed from A or B rated source test data taken from many randomly chosen facilities in the industry population. The source category population is sufficiently specific to minimize variability. Factor is developed from A or B rated test data from a reasonable number of facilities. Although no specific bias is evident, it is not clear if the facilities tested represent a random sample of the industry. As with an A rating, the source category population is sufficiently specific to minimize variability. Factor is developed from A, B, or C rated test data from a reasonable number of facilities. Although no specific bias is evident, it is not clear if facilities tested represent a random sample of the industry. As with the A rating, the source category population is sufficiently specific to minimize variability. Factor is developed A, B, or C rated test data from a small number of facilities, and there may be reason to suspect that these facilities do not represent a random sample of the industry. There also may be evidence of variability within the source population. Factor is developed from C and D rated test data, and there may be reason to suspect Trends in Quantity and Quality of Emission Factors As of March 1996 As of September 2004 Number Number Factor Rating Qualitative Description of Factors Percent of Total of Factors Percent of Total A Excellent 1, , B Above 1, , Average C Average 1, , D Below 2, , Average E Poor 2, , Total 8,838 17,110 Source: EPA Office of the Inspector General (2006)
17 Aggregated Assessment of Confidence in U.S. Emission Inventories Estimated Confidence Levels in Source Overall Inventory SO 2 NO x VOC HAPs Utilities H H M-H M Other Point M M L-M L-M Onroad Mobile M M-H L-M L-M Nonroad Mobile M M L-M L-M Stationary Nonpoint L L L L Biogenic L L L L Other Anthropogenic (non-combustion) L M M L Source: NARSTO (2005) Variability and Uncertainty Variability: refers to the certainty that different emission sources will have different emissions (inter-unit variability) emissions will vary over time for a given source (intra-unit variability) Uncertainty: refers to lack of knowledge regarding True value of a fixed but unknown quantity True population distribution for variability Both depend on averaging time
18 Sources of Variability Design Feedstocks Ambient Conditions Maintenance Practices Operational practices and occurrences (e.g., load following, baseload, transients, process upsets) Seasonality/Periodicity Sources of Uncertainty Random sampling error for a random sample of data Measurement errors Systematic error (bias, lack of accuracy) Random error (imprecision) Non-representativeness Not a random sample, leading to bias in mean (e.g., only measured loads not typical of daily operations) Direct monitoring i versus infrequent sampling versus estimation, averaging time Omissions Surrogate data (analogies with similar sources) Lack of relevant data
19 How Good are the Emission Factors? NO x From Coal-Fired Power Plants Compilation of Air Pollutant Emission Factors, AP-42, U.S. Environmental Protection Agency Example: Bituminous coal, Wall-fired, dry bottom boilers Data Quality Rating of A 28 data points 9.5 to 44.5 lb NO x /ton Average = 21.1 lb NO x /ton, std dev = % Confidence Interval on the mean: (±15%) Uncertainty: t Depends on context t ±15% of the average of many plants A factor of two for a randomly selected individual plant The Rating of an AP-42 emission factor does not translate into a quantitative estimate of uncertainty Methods for Quantifying Uncertainty Bottom-Up Approaches Statistical ti ti Methods Based Upon Empirical Data Statistical Methods Based Upon Judgment Sensitivity Analysis Top-Down Approaches


20 Quantifying Uncertainties in Emission Inventories: Conceptual Bottom-Up Approach Input Uncertainties Source Emission Activity Category Factor Factor 1 Output Uncertainty 2 Emission Inventory Total Emissions k Uncertainty in Total Emission Inventory: AUVEE Prototype Software


21 Summary of Probabilistic Emission Inventory Identification of Key Sources of Uncertainty in an Inventory
 Uncontrolled NO x 2SLB, 90-105% 3.17 34 / 11 W 3.")

 Case Study of Emissions Uncertainty Charlotte modeling domain 32 units from 9 different coal-fired power plants 1995 and 1998 data used Propagation of")
22 Probabilistic AP-42 Emission Factors for Natural Gasfueled Engines (July 2000 Version) Engine and Load Range AP-42 No. of Fitted Mean of Emission Data / Distri- Bootstrap Factor a Engines bution. b sample means a Relative 95% CI of mean c (%) Uncontrolled NO x 2SLB, % / 11 W to +24 2SLB, <90% / 11 W to +46 4SLB, % / 4 G to +49 4SLB, <90% / 5 W to +180 Uncontrolled TOC 2SLB, all load / 14 W to +18 4SLB, all load / 4 G to +57 aunits are lb/106 BTU. bmle is used for 2SLB engine, MoMM is used for 4SLB engine, W=Weibull distribution, G=Gamma distribution. ccalculated based upon bootstrap simulation results. Based on Frey and Li (2003) Case Study of Emissions Uncertainty Charlotte modeling domain 32 units from 9 different coal-fired power plants 1995 and 1998 data used Propagation of uncertainty investigated using July 12 July meteorological data Data available for emission and activity factors Vector autoregressive time-series modeling of emissions from each unit Based on Abdel-Aziz and Frey (2002)
23 . Emissions (t/hr) Time Series and Uncertainty Real. Obs Hour Different uncertainty ranges for different hours of day Top-Down Methods: Identify Major Biases Comparison of Inventories Developed Using Independent Methods and Data Comparison of Air Quality Model Predictions to Monitoring Data Comparison of Source-Oriented vs. Receptor- Oriented Modeling Approaches Comparison of Inventories and Ambient Monitoring Data
24 Comparison of Fuel-Based Versus Mileage-Based Mobile Source Inventories 70 emissions (tons/day) VOC NO x CO/10 Diesel Gasoline 10 0 Fuelbased EPA Fuelbased EPA Fuelbased EPA Source: NARSTO (2005) Discussion NO x emissions reduction is an ongoing success story, with a 40% overall reduction in 2008 versus a peak ca From 1970 to 2008, the number of registered vehicles increased by 128%, and VMT increased by 173%. Concurrently, highway vehicle NO x emissions decreased by 59%. Significant further reductions in total vehicle emissions are likely, given fleet turnover to newer, cleaner vehicles.
25 Discussion The current fossil electricity mix of mostly coal and natural gas has an average NO x emission rate of about 0.22 lb NO x /10 6 BTU. A state-of-the-art power plant might have emissions of about one-half this level. Electrification of vehicle technology may or may not have benefits in terms of NO x emissions. Setting aside other benefits, alternative transportation fuels do not yet demonstrate potential for significant NO x reductions; in contrast, increases in life cycle emissions may be possible.