The IPCC Working Group I Assessment of Physical Climate Change
|
|
|
- Poppy Bailey
- 5 years ago
- Views:
Transcription
1 The IPCC Working Group I Assessment of Physical Climate Change Martin Manning Director, IPCC Working Group I Support Unit 1. Observed climate change 2. Drivers of climate change 3. Attribution of cause 4. Projections 5. Extremes Symptoms Physiology Diagnosis Prognosis

2 The Working Group I Report Started 2003 Completed February Authors ~450 contributors ~600 expert reviewers 30,000+ review comments Contents You can get it at: Summary for policymakers Technical summary Includes supplementary material. 11 Chapters All figures available in PowerPoint Frequently format. asked questions Book now published by Cambridge ~5000 University literature Press. references ~1000 pages 2
3 Observed Climate Change Warming of the climate system is unequivocal Numerous long-term changes in climate observed at continental, regional and ocean basin scales Some aspects of climate have not been observed to change 3

4 Global average temperature 4

5 Warming is truly global Warming trends since 1979 (when satellite measurements started) show: Warming everywhere at surface except in eastern Pacific, Southern Ocean and parts of Antarctica; Land warming significantly faster than ocean over last 20 years; Mid-troposphere warming consistent with that at surface. 5
6 Consistent pattern across climate system Surface temperatures increasing Tropospherictemperatures increasing Atmospheric water vapour content increasing Ocean heat content increasing now directly linked to sea level rise Greenland and Antarctic Ice Sheets losing mass Unequivocal Glaciers and snow cover decreasing Arctic sea ice extent decreasing Area of seasonally frozen ground decreasing Mid-latitude wind patterns/ storm tracks shifting poleward More intense and longer droughts Frequency of heavy precipitation events increasing Extreme temperatures increasing Tropical cyclone intensity increasing 6

7 Icarus and Daedalus The Greeks knew a lot about geophysics; And that the sun heated the planet; But not how the greenhouse effect worked! The Fall of Icarus Jacobi Gowi 7


8 The greenhouse effect The natural greenhouse effect increases surface temperatures by about 30 o C. Increasing greenhouse gas concentrations tends to increase surface temperatures. 8
9 Drivers of Climate Change Concentrations of CO 2, methane and nitrous oxide have increased markedly as a result of human activities and now far exceed pre-industrial values Net effect of human activities since 1750 has been one of warming 9


10 Industrial revolution and the atmosphere Air bubbles in a piece of an ice core The current concentrations of greenhouse gases and their rates of change are unprecedented. 10

11 Comparing different drivers of change Increased by 20% over Radiative forcing: measures the change in the Earth s energy balance due to different causes of climate change. W m -2 11
12 Identifying cause and effect Most of the observed increase in global average temperatures since the mid-20th century is very likely* due to the observed increase in anthropogenic greenhouse gas concentrations. *Very likely means an assessed likelihood of being correct greater than 90% 12


13 Attribution temporal patterns Climate models explain observed global mean temperatures with greenhouse gases and aerosols included. No model can explain observed global mean temperatures without including increased greenhouse gases. Note transient coolings due to volcanic eruptions 13

14 Attribution spatial patterns Can not explain spatial pattern of warming without this component. Solar Greenhouse gases Volcanoes Ozone Sulfate Estimated Sum 14

15 Projections of climate change Svante Arrhenius, Verldamas Utveckling, 1906 any doubling of the percentage of carbon dioxide in the air would raise the temperature of the Earth s surface by 4 C. the percentage of carbonic acid in the atmosphere may, by the advances of industry, be changed to a noticeable degree in the course of centuries. Intergovernmental Panel on Climate Change 2007 the best estimate of climate sensitivity to a CO 2 doubling is a warming of 3 C, with a likely range of 2 to 4.5 C. business as usual scenarios lead to CO 2 doubling over pre-industrial levels between 2050 and

16 Projected global average warming High scenario Medium scenario Low scenario Higher emissions lead to more warming later in century. 3.4 o C = 6.1 o F 2.8 o C = 5.0 o F 1.8 o C = 3.2 o F Further warming of ~0.6 o C after concentrations stabilized Warming of about 0.2 o C per decade for next two decades for a range of scenarios 16
17 No one lives at the global average Medium (A1B) scenario ( ): Global mean warming 2.8 o C; Much of land area warms by ~3.5 o C Arctic warms by ~6 o C. A 550 ppm CO2-eq world would more likely than not be warmer. 17
18 Projected precipitation change Underlying physics of precipitation change is better understood. Projected percent change in precipitation in (Medium scenario) Pattern is: increases in tropics and high latitudes; decreases in sub-tropics. Consistent with observed trends. Multi-model mean change shown where >66% of models agree in sign; >90% of models agree in stippled areas. 18
19 Calculus of extremes The distribution of weather events around the climatic average follows a bell-shaped curve. Climate change can involve change in the average, or the spread around the average (standard deviation), or both. A shift of 1 standard deviation makes a 1 in 40 yr event into a 1 in 6 yr event Standard deviation 1 in 40 yr high range A shift in the distribution of temperatures has a much larger relative effect at the extremes than near the mean. 19


20 Projected changes in extremes 20
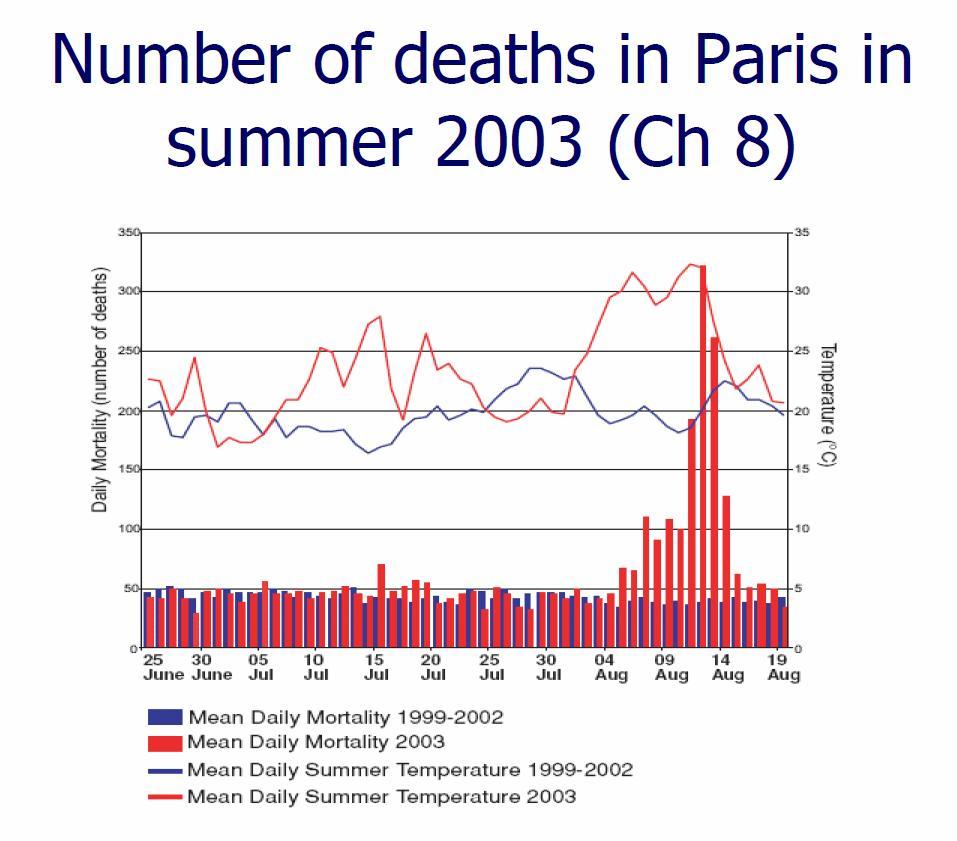
21 Extremes will increase Projected increases in heavy precipitation and drought are linked to physical processes principally increased absolute humidity and patterns of convergence and divergence in atmospheric transport. Precipitation intensity increases - even where total precipitation decreases. Risk of 2003 type heat wave doubled in Europe due to current level of greenhouse gases (single study). Extreme summer temperatures become at least 20 times more frequent by end of century (average for 3 scenarios and for multiple models). 21

22 Wide area average temperature anomaly ~3 o C Soil moisture feedback, i.e. less moisture means more sensible heating Tens of thousands of premature deaths Loss of about 500 Mt carbon from soils Unprecedented drop in crop yields Europe July
23 23
24 Summary Confidence in climate change science has increased significantly. Evidence for warming of the climate system is unequivocal. We are changing the geography of the planet. Reducing greenhouse gas emissions can reduce the magnitude of change in the longer term 24

25 Glacier mass balance Cumulative loss of glacier mass in many regions During the 20th century, glaciers and ice caps have experienced widespread mass losses and have contributed to sea level rise. 25

26 Surface elevation changes shown as red hues where rising and blue where falling. Evidence for rapid changes in ice flow in some regions. Changes in ice sheets Very likely that Greenland Ice Sheet shrunk from 1993 to Thickening in central regions more than offset by increased melting in coastal regions. Antarctic ice sheet also estimated to have lost mass, but uncertainties are larger. 26


27 Tide gauge and satellite data on sea level Average rate of sea level rise: : 1.8 mm /yr : 3.1 mm /yr 27


28 Sea level trends satellite altimetry Since 1993 satellite techniques have provided a much more detailed picture of sea level changes. Over trends vary significantly from place to place. The pattern of sea level trends is very similar to that of the underlying change in ocean heat content. 28
 Actual CO 2 growth Land Use Change flux: 1980s: 5.1 GtCO 2 /yr 1990s: 5.")
29 Carbon Dioxide Fossil fuel emissions: 1980s: 19.8 GtCO 2 /yr 1990s: 23.5 GtCO 2 /yr : 26.4 GtCO 2 /yr Fossil Fuel emissions (in atmospheric concentration units.) Actual CO 2 growth Land Use Change flux: 1980s: 5.1 GtCO 2 /yr 1990s: 5.9 GtCO 2 /yr Atmospheric CO 2 growth rate: : 1.4 ppm /yr : 1.9 ppm /yr 29

30 Radiative forcing: CO 2 equivalents Used to compare different drivers of climate change CO 2 -eq of 455 ppm for long lived greenhouse gases Offset cooling by Aerosols removed within weeks of emission CO 2 -eq of 375 ppm for net human activities 30


31 Anthropogenic climate change signals Attribution is based on a large number of climate models and simulations with and without greenhouse gases and aerosols. Observed patterns can only be explained with greenhouse gases and aerosols. 31
32 Scenarios used Based on pre-2000 literature No additional climate change policy (no mitigation) Low, Medium, and High emission scenarios. Physics tests kept atmospheric composition constant. Compare doing so in 2100 vs doing so in Results from 14 modelling groups 23 models 32
33 Near term climate change For SRES scenarios average warming in all continents will exceed range of natural variability in next few decades. 33
34 (Modelled) Sea level rise Sea level rise has 3 main components: Thermal expansion Glaciers and small ice caps new estimates use much more detailed models and give results slightly less than in TAR. Causes 70 75% of projected sea level rise uncertainties reduced using new data Ice Sheets (Total) processes that are simulated in ice dynamics models with confidence remain much as in TAR New projections are within 10% of those in the TAR but have smaller uncertainties. For the parts of sea level rise explained by models, projections for 2100 range from 0.28 to 0.43 m (9 to 16 in) 34

35 Sea level rise limits to knowledge Accelerated ice sheet discharge observed in recent years implies ice processes that are not in current models. We can not provide a best estimate or upper bound for sea level rise by 2100 Surface melt on Greenland ice sheet descending into moulin, a vertical shaft carrying the water to base of ice sheet. Photo credit: Roger Braithwaite 35