Climate Change. Are we to blame?
|
|
|
- Maximillian Elliott
- 5 years ago
- Views:
Transcription

1 Climate Change Are we to blame?
2 Presentation Flow Global changes Climate Science Findings Impacts on India Underlying Causes of Climate Change
3 What changes are we seeing

4 Unusual weather events around the world Mildest winter in in Canada, 2005/06 Rare snow in United Arab Emirates, 2004 Record high winter temperatures, Japan Record 2007 snowfalls in Japan, 2005/06 Extreme winter storms USA, 2011 United States and Central America hit hit by by most devastating hurricanes ever, 2005 Major heat wave in Europe, 2003 Floods in Algerian Sahara Desert, 2006 Heaviest rain in a day in Mumbai, 2005 Worst winter storms, China 2008 Winter heatwave Argentina, 2009 First hurricane in Brazil, 2004 Hottest year in Australia, Hottest 2005year in Australia, Record 2005 breaking rain Australia,


5 Pederson Glacier (Alaska) Glaciers are retreating

6 Parts of some Antarctic ice shelves are collapsing Larsen B ice shelf, Antarctica 3250 km 2 of ice, 220 m thick collapsed in 2002 Photos: NSIDC/NASA

7 Sea levels are rising Source:

8 Drought in many places around the world

9 Increase in Wildfires

10 All is not well All is not well
11 Climate Science Findings

12 Source: Vital Climate Graphics, Grid Arendal / UNEP Gases like carbon dioxide are essential for life on Earth.

13 They trap some of the heat leaving the Earth. Without them, Earth s average temperature would be C


14

15 Some are natural some manmade
16 Not only are we creating new greenhouse gases, we are adding to natural ones as well
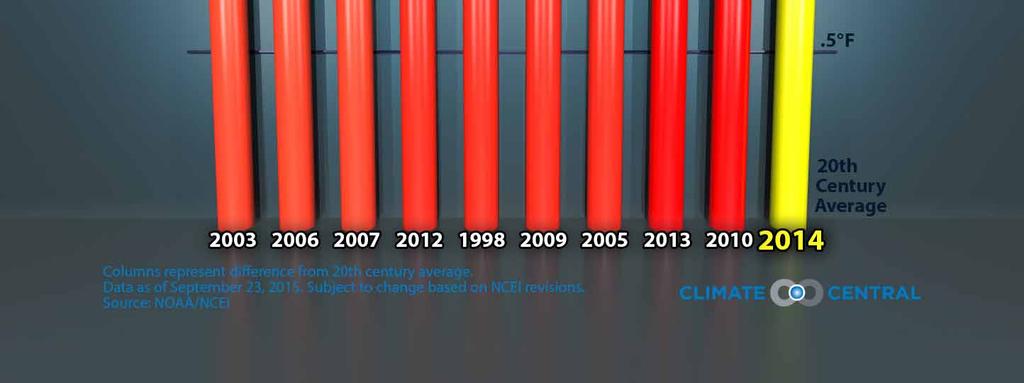
17 Atmospheric CO 2 has increased from a pre-industrial concentration of about 280 ppm to about 397 ppm at present
18 Methane and nitrous oxide fare no better Figure: NOAA Earth System Research Laboratory

19 To learn more about the concentration of GHGs in the atmosphere before the era of instruments and measurements, scientists are analyzing gases trapped in ice And we find that.
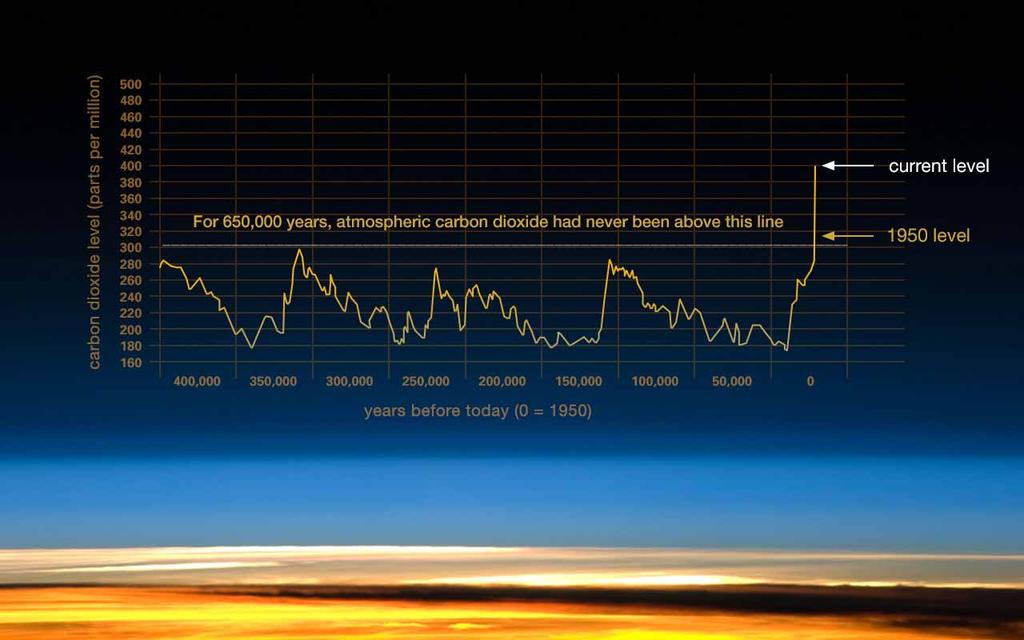
20

21 Source: We re blanketing the Earth with more and more of these gases and the ball is going warm
22

23

24 A hot future awaits us Global mean surface temperature could rise between C by 2100
25 Will we be impacted?
26 Each one of us will be affected

27 Net cereal production in South Asian countries is projected to decline at least between 4 to 10% by the end of this century

28 The risk of hunger is likely to remain very high in India. Food costs will increase

29 Melting of glaciers could seriously affect 500,000,000 people served by the Himalaya-Hindu-Kush region Source:

30 Groundwater it s finite! 7 out of 9 districts in Delhi are over-exploited (extraction > recharge) with respect to dynamic groundwater resources

31 India will reach a state of water stress before 2025 This will impact food security, human health and economic activity


32 Precipitation patterns will change There may be more intense rainfall on rainy days, resulting in floods and more dry days in a year, causing drought Flood damage costs India an average of Rs 4745 crore every year 350 million Indians have been affected badly due to drought in a decade

33 Deaths due to heat waves, water borne diseases and vector borne diseases like dengue are expected to increase

34 Sea level will be a minimum of 40 cm higher than today by the end of 21st century Source: TERI % of Bangladesh's coastal land is likely go underwater, creating 7 to 10 million climate refugees


35 But, are we to blame? Aren t the culprits industry and the government? The underlying causes

36 billion billion Population is increasing but natural resources are NOT!!

37 Forests are becoming croplands to feed our growing millions. Fewer trees, more carbon dioxide in the atmosphere
38 Intensification of agriculture to feed the growing millions Global fertilizer consumption More nitrous oxide released Source: IGBP

39 Changing lifestyles More methane generated by anaerobic decomposition of wastes in landfills Source: Philippe Rekacewicz, UNEP/GRID-Arendal


40 Changing lifestyles
41 Increasing industrialization to meet our growing demands
42 Increased demand for electricity From domestic consumers From industries From the agriculture sector 0.82 kg of CO 2 produced for every unit of electricity generated from coal. That s approx. 1 kg of CO 2 produced for every unit of electricity we use.

43 Energy use


44 It s time to adopt a low carbon lifestyle. Reduce use of electricity Conserve fuel Do not waste water Reduce, Reuse, Recycle


45 But can I make a difference? I am just one person Each one adopt at least two low carbon actions The worst can still be avoided ely and aggressively work towards being part of the solution Each one influence at least 5 others to adopt two low carbon actions and spread the message


46 Will it help? The impact of millions of people who choose to make changes in personal lifestyles cannot be undermined Whatever you may do may seem insignificant to you, but it s most important that you do it. Mahatma Gandhi
47 Prepared by: Rashmi Gopal Sources: The Schools Water Portal Dr U Kelkar For more information, please contact: Prabhjot Sodhi E mail: prabhjot.sodhi@ceeindia.org Ph: Address: Centre for Environment Education C 40, South Extension II New Delhi