3 S River Hydropower Development &
|
|
|
- Austin Jefferson
- 5 years ago
- Views:
Transcription


1 Water Access, Available Land Resources and Impacts on Food dproduction: 3 S River Hydropower Development & Tonle Sap Food Security By T. Farrell, T. Piman, T. Cochrane and M. Arias Water Food Security in Cambodia Assessing risk and alternatives under an altered flow regime SIWI, UNDP Phnom Penh, December 2 3, 2013
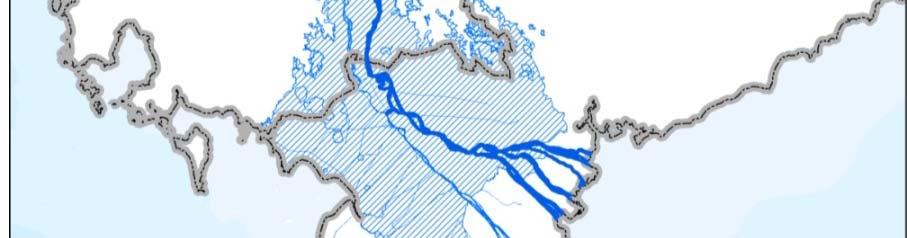
2 3 S Basin & Food Security Downstream Only 10% Mekong basin, yet more than 20% annual water volume. 3 S flows to Mekong 3,000 m 3 /sec, dry, 4,500 m 3 /sec wet seasons. Nearly 15% suspended sediment discharge originates in the 3 S. Key nutrient sourcefor agriculture and fisheries. Most important catchment for keeping migrating fish populations. Trans boundary, yet decisions in country can make a difference Close proximity to lower floodplains rice and fish baskets for millions in Cambodia and Vietnam downstream. Valuedat at hundreds of millions of dollarsin terms of ES provision, regulation, supporting, cultural services. Ultimate test case for hydropower trade offs in food security critical question in SE Asia in terms of political stability and poverty alleviation.
3


4 Level Fluct tuations ual Water Ann Flows have changed, but effect diminishes as you move downstream larger dams downstream most impacting CS LP VT MH
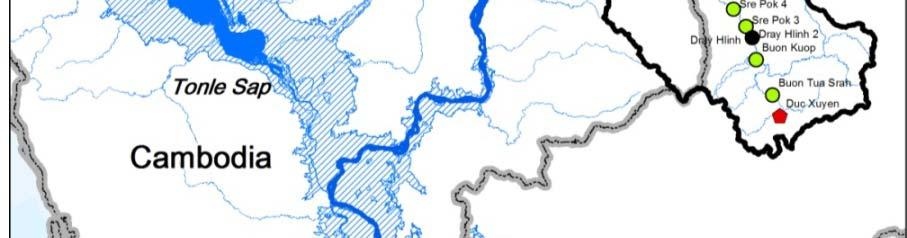
5 3 S river hydropower dam impacts and their implications 3 S river mainstem dams developed would increase dry season flows by 63% and wet season by 22%, with minimal additional impact from tributary dams Some of these Lower Sesan II and Sambor effectively block most fish migration and sediment flow. Coordinationandcooperation and amongdevelopers and transboundary countries are necessary to minimize the impact and maximize basin benefits Need to understand other environmental ramifications sediment, nutrients, food web, biodiversity Hundreds of thousands displaced upstream resettlement and compensation plans disputed
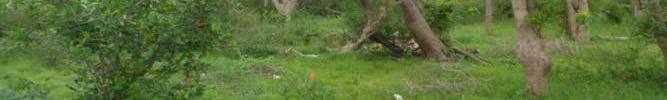
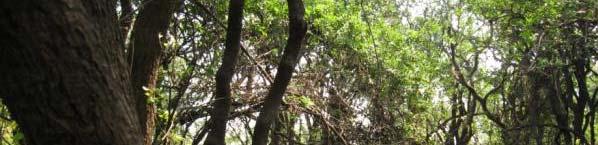
6 Land Use/Clearing Issues in the 3 S


7 What does this mean for food security for those living on the TS lake?


 60% of entire country s protein is")

8 Tonle Sap Fisheries Important for Cambodia Fourth largest inland fishery in the world, larger than U.S. and Canada combined; 12% of GDP About 500,000 tonnes of fish caught annually (>55 tonnes/hour) 60% of entire country s protein is from inland fisheries in Cambodia Over 1 million people in floating villages on Tonle Sap Lake rely onfishing fishing; another 2M in floodplain


9 Freshwater Giants and Rare Species Cambodia Over 400 freshwater vertebrate species (including about 550 species of fish); over 50 species are globally threatened including Irrawaddy dolphin, giant catfish, giantstingray, turtles, crocodiles Tonle Sap Lake Very rich in species (over 300 kinds of fish); contains over 1/3 of Cambodia s rarest species (e.g., otters, fish eagles, fishing cats)


10 Research Overview: TS Food Security

: 0 25 50 100 Kms Flood extent changes during dry season (-10%): 0 25 50 100")
11 TS Hydrological Changes Expected masl Climate change and hydropower impacts on an average year rvmpa rvcca rvgia rvnca A1b models + hydropower observed average Hydropower May Jun Jul Aug Sep Oct Nov Dec Jan Feb Mar Apr Flood extent changes during dry season (+30%): Kms Flood extent changes during dry season (-10%): Kms


")


12 Changes Impact Landscape Patterns Flood duration rules (months) Rainfed habitats Transitional habitats average year Seasonally flooded habitats 5-8 Gallery forest 9 Open lake Habitat code Gallery Forest (GF) Open Water (OW) Rainfed habitats (RF) Seasonally flooded habitats (SF) Transitional habitats (T) Kms


13 Which Impacts Biodiversity and Food Infered species information from literature When and where do they eat and reproduce? Assign habitat types where each species is likely to be during each of 4 seasons Link database to habitat maps
14 Research and Practice to Manage TS Food Security Basic information anddata data about theecology/biology ecology/biology of the lake system and the larger watershed: Determine what can and cannot thrive/survive in the system. Created by scientific monitoring and applied scientific research. This includes nutrient flows (UW), basic ecology (IFReDI,Sci Cap), and linkage to hydrology (U of Cant). Build capacity among government, civil society and communities: allows for more consistent capacity development for sustainable data collection, monitoring, and site implementation results (CI, IFReDI, Sci Cap).
15 Research and Practice to Manage TS Food Security Demonstration sites: linking science lessons learned to inform selection of best practices for biodiversity protection, food security and fisheries management. Includes community fish sanctuary/protected zone management, testing fisheries management practices, conserving biodiversity, and ensuring effective site enforcement (CI). And WCS in Preak toal. Modeling scenarios: looking at hydro power hd (U of Cant), climate change (UW, U of Cant, CI, BU), and ecosystem services (BU). Trade offs and impacts. Integrating information, capacity, management and modeling results to inform policy decisions, and fisheries management actions. Bestpractices implemented at community and national levels while also influencing regional policy.
16 Sharing Results and Influencing Policy: Hydropower Impacts and Alternatives


 Funding: CriticalEcosystem Partnership")
17 Partners and Support Partners: Mekong River Commission Collaborators: M. of Environment, Aalto University, EIA Ltd Finland, Research Development International, University of Washington, Fisheries Administration, Boston University, SCI CAP (food web modeling group) Funding: CriticalEcosystem Partnership Fund, MacArthur Foundation, UNDP CCCA, and Belmont Challenge Award
18 Thank you for your kind attention!! Please feel free to contact us: acnz org