Implementation of a Strategic Approach for Complex Vapor Intrusion Assessment at a Large Military Facility
|
|
|
- Lillian Wade
- 5 years ago
- Views:
Transcription


")
 John Wrobel (US")
1 Implementation of a Strategic Approach for Complex Vapor Intrusion Assessment at a Large Military Facility David W. Himmelheber Emily H. Majcher, Paul Nicholson, Aron Krasnopoler, Todd McAlary, Robert Ettinger (Geosyntec Consultants) Jennifer Harris (General Physics Corporation) John Wrobel (US Army, USAG Aberdeen Proving Ground)
 is the transport of gas-phase contaminants from the subsurface to indoor air Typically")

2 Introduction to Vapor Intrusion What is Vapor Intrusion? Vapor intrusion (VI) is the transport of gas-phase contaminants from the subsurface to indoor air Typically originates from groundwater and/or soil contamination --- volatile organic compounds (VOCs) Exposures of contaminants to building occupants are a major concern Relatively new regulatory emphasis on assessing VI risk ITRC Vapor Intrusion Team logo;
3 Site Background Aberdeen Proving Ground (APG) Established in 1917 in northwestern region of Chesapeake Bay R&D, manufacture of military chemical agents Portion of APG placed on NPL site in 1990 Canal Creek Study Area (CCSA) 700-acre parcel Chemical manufacturing 1918 end of WWII Current use is lab and pilot scale facilities Over 20 years of soil and groundwater investigations

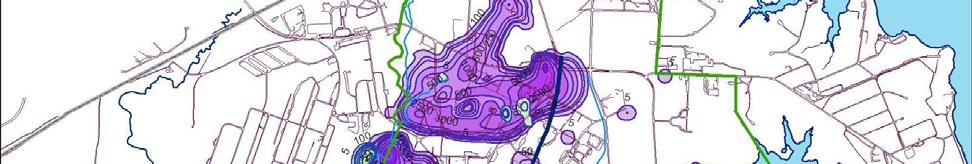
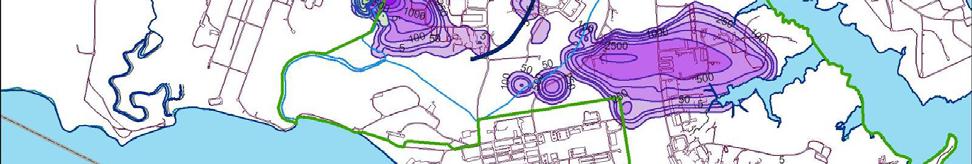
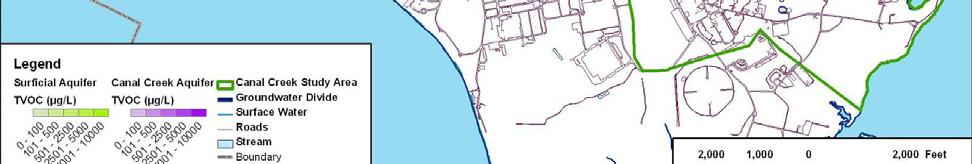
4 CCSA Groundwater Impacts Site Background (Courtesy of WESTON Solutions)
5 Site Background Key Project Challenges Large number of buildings on Site (317) Unique contaminants uncommon for VI assessments Co-mingled contaminant plumes Complex hydrogeology below large site Working constructively to meet needs of US Army Federal, and State regulators
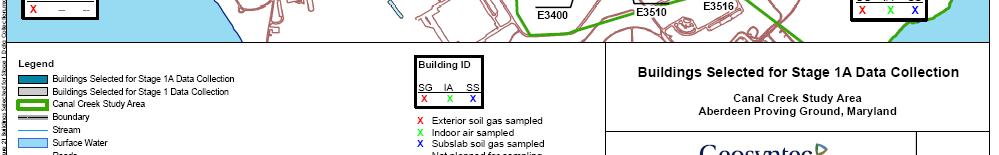
6 P2 Site Background Proposed VI Assessment Strategies Initially Proposed Strategy Collect indoor air samples from all buildings Geosyntec Proposed phased approach for VI evaluation Conceptual Site Model (CSM) development Data collection to refine CSM Follow-up sampling for sub-set of buildings Evaluate mitigation needs and options
7 Slide 6 P2 Just a comment. I think we need to highlight that we took advantage of the amount of historical knowledge gained from previous investigations and used this information to develop a phased approach. There was a lot of good data, it just needed to be complied together and understood from a VI perspective. PNicholson, 9/22/2010
8 COPC Identification Develop list of COPCs based on: Calculated screening levels were developed based on risk to building occupants Detection ti frequency analysis COPC screening results 15 of 90 contaminants retained for groundwater 46 of 160 contaminants retained for soil COPCs include VOCs, SVOCs, PCBs, chemical warfare material (CWM) degradation products, and mercury
9 Conceptual Site Model Development Sources of Contamination Primary Locations of Former Activities Secondary Downgradient Comingled Plumes Pathways Geology Hydrogeology Receptors (Building) Characteristics Buildings (Use, Occupancy, Foundation, HVAC)
10 Conceptual Site Model Development Historical analytical data Sample Locations Building Inspections RDMS P3 CSM GIS Stratigraphy Interviews Building Locations Historical Activities
11 Slide 9 P3 What is RDMS? PNicholson, 9/22/2010
12 Conceptual Site Model Development Conceptual Model ID Conceptual Model #1 Primary Source Areas Conceptual Model #2 Surficial Aquifer Source Areas Conceptual Model #3 Upper Confining Unit (UCU) Source Areas Conceptual Model #4 Confined Canal Creek Aquifer (CCA) Source Areas Conceptual Model #5 Areas with No Identified ed Source or No Existing Buildings Description Residual COPCs in the Vadose Zone near or beneath buildings COPCs present in unconfined aquifer with no confining unit above the water table COPCs present in the UCU, and materials above the UCU are unsaturated COPCs are present in the CCA, and the UCU is present above the CCA No sources or receptors identified


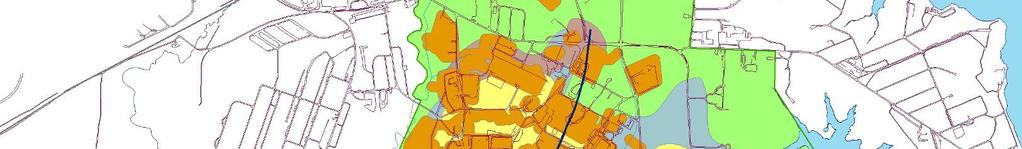
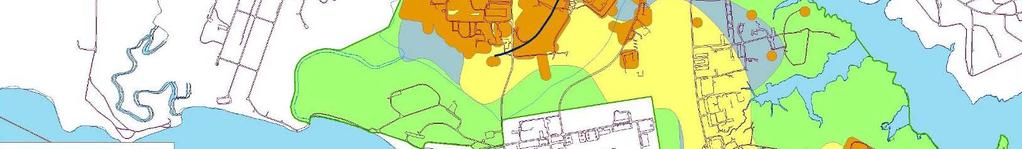
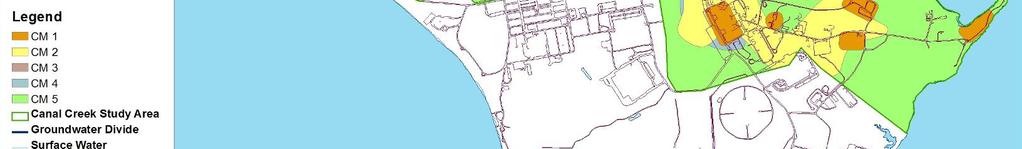
13 Conceptual Site Model Development Spatial Distribution of CM Classification


14 Conceptual Site Model Development Buildings per CM Classification CM 1 27% CM 2 20% CM 3 1% CM 4 10% CM 5 43%


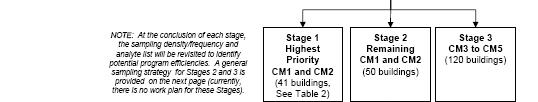
15 Conceptual Site Model Development Evaluation Step Database/GIS Analysis and Risk Screening CSM Development CM1 CM2 CM3 CM4 CM Building Count Building Occupancy Screening Stage I Field Investigation CM1 CM2 CM3 CM4 CM5 CM1 CM2 CM3 CM4 CM
16 P8 Stage 1 Field Investigation Systematic Building Selection 1. Historic use, storage and handling of COPCs were documented within or near the building 2. Elevated concentrations of COPCs in shallow soil samples 3. Soil samples with concentrations ti within an order of magnitude of the Site maximum for each COPC were located close to the building 4. Shallow groundwater samples with a cumulative risk greater than 10-6 were located close to the building
17 Slide 14 P8 Just a comment. I think we need to highlight that we took advantage of the amount of historical knowledge gained from previous investigations and used this information to develop a phased approach. There was a lot of good data, it just needed to be complied together and understood from a VI perspective. PNicholson, 9/22/2010

18 Stage 1 Field Investigation
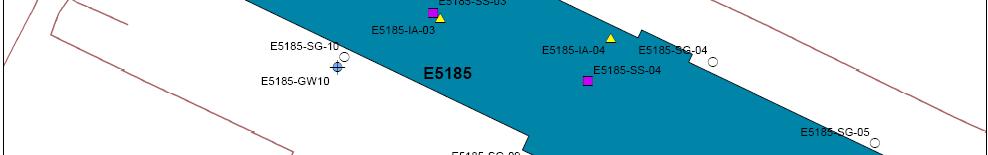
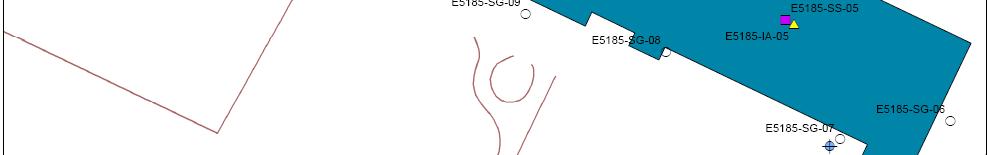
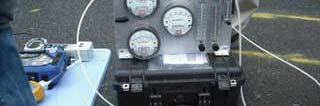
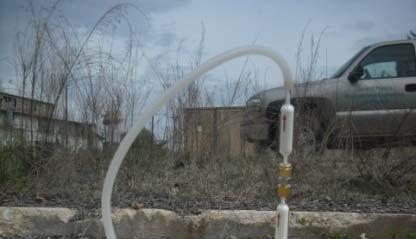
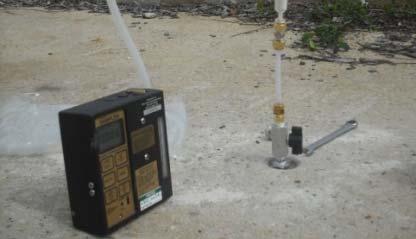
19 Stage 1 Field Investigation Building-specific sampling plans were developed Assessment of uncommon and analytically-challenging COPCs at locations of maximum historical concentration Groundwater, soil gas, and sub-slab b samples around dtarget t buildings to assess subsurface vapor sources Indoor Air sampling to assess receptor air quality Extensive Quality Assurance/Quality Control procedures Pneumatic testing Inter-method comparisons Tracer testing Building ventilation survey Equipment blanks Trip blanks

20 P5 Stage 1 Field Investigation
21 Slide 17 P5 What are the comments for this slide? Just an example of what we did. Highlight the different methods that we used. Regular SSP sampleing, HPV, IA monitoring with passive samples, summas, sorbent tubes, soil gas probes installation. Focused SSP (SS-01) towards areas of historical activity. PNicholson, 9/22/2010


22 Stage 1 Field Investigation MEC clearance and monitoring during subsurface activities High Purge Volume sub-slab sampling to increase spatial footprint of sample Sorbent tubes for mercury, pesticides, PCBs, SVOCs, and chemical warfare agents Waterloo Membrane Samplers for long-term average indoor air concentrations; selected verification via 8-hr Summa canisters P4
23 Slide 18 P4 Point out the WMS sampler in the background of this photo (it's really small) PNicholson, 9/22/2010


24 P6 Stage 1 Field Investigation
25 Slide 19 P6 May want to note that we are not actually in buildings in these pictures, but are testing highest concentration areas for uncommon COPCs, pesticides etc at old slabs. But similar methods used inside buildings (difficult to take photos in some of the buildings) PNicholson, 9/22/2010
26 Field Investigation Results Only 2 of 14 buildings in the initial phase of investigation showed potential ti for VI possessing a complete VI pathway Contaminants detected in subsurface and in indoor air above screening levels Carbon tetrachloride, chloroform, PCE,TCE, hexachloroethane (HCA) Confirmatory sampling during heating season verified results Long-term monitoring suggested with mitigative actions possible P7 Uncommon COPCs, mercury, pesticides, id and most SVOCs were not found to pose unacceptable exposures
27 Slide 20 P7 highlight that the COPC list can now be reduced as highest concentration areas did not pose any risk, cost savings for future assessments PNicholson, 9/22/2010


28 Field Investigation Results Quality Assurance and Quality Control procedures well received by all stakeholders Important when relying on the data for scoping decisions Results to date support limiting additional investigations significant cost savings to the Army
29 Summary US Army was tasked with assessing Vapor Intrusion at a Site with greater than 300 buildings and significant groundwater/soil impacts The large number of buildings and unique contaminants created a challenging scenario Geosyntec was able develop and implement a systematic CSM to prioritize buildings and identify receptors most at risk to potential VI Initial field investigations indicate only 2 of 14 high priority buildings have potential VI concerns Results to date support limiting additional investigations significant cost savings to the Army


30 Thank You for Your Attention! Questions?

31 Prioritization
32 Sampling VOCs in Indoor Air Air Toxics conducted an exposure time test using the polydimethylsiloxane (PDMS) samplers Evaluated stability of VOCs over 35 day deployment time Sampled at day 0 and day 35 Losses generally low (<10%); however, some VOCs had greater losses including: Chloromethane 2 chlorovinyl ether and 1,4 dithiane Styrene 1,1,2,2 tetrachloroethane (degradation to TCE)
33 Data Quality Objectives Sample Type & Matrix Specific Objectives Exterior soil gas Purpose of Activity Assess potential VI by identifying and quantifying COPCs in soil gas adjacent to buildings. Specific Objectives Collect representative soil gas samples from a depth sufficient to have minimal variability attributable to weather conditions, with sufficient volume to meet analytical requirements, and no significant leakage of atmospheric air. Document sample representativeness using pneumatic testing, tracer testing and field screening data. Sub-slab soil gas Assess potential VI at buildings where Collect representative sub-slab slab soil gas a known or suspected release of COPCs was identified within the building footprint in the RFA or 35 sites RI reports. Assess potential VI at samples from immediately beneath the floor slab with sufficient volume to meet analytical requirements and no significant leakage of atmospheric air. buildings that are greater than 100 feet in width to practically minimize the potential of failing to identify a region of elevated soil vapor concentrations beneath a building using external soil gas samples collected immediately outside the building footprint. 26 Document sample representativeness using pneumatic testing, tracer testing and field screening data.
34 Data Quality Objectives (Continued) Sample Type & Matrix Specific Objectives High-purge volume sub-slab soil gas Purpose of Activity Minimize the potential risk of failing to identify a region of elevated soil vapor concentrations between sub-slab probe locations in buildings that are greater than 100 feet in width. Specific Objectives Withdraw sufficient gas from beneath the floor slab to enable field screening and laboratory analysis of gas from a large area surrounding the sub-slab slab probe. Indoor and outdoor air Groundwater Assess indoor air quality at buildings identified with historical known or suspected source of COPCs within the building footprint. Assess potential VI by identifying and quantifying COPCs in groundwater upgradient of buildings located within CM2. Collect long-term average screening- level concentration data for a broad spectrum of COPCs for comparison to risk-based screening levels where practicable, and for comparison to subsurface groundwater and/or soil gas data. Collect representative groundwater samples from just below the water table of sufficient volume to meet analytical requirements. 27
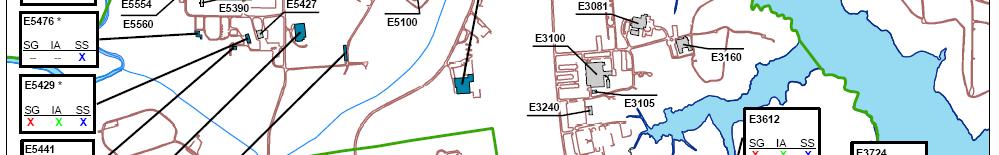
35 Focused Assessment of Selected COPCs Mercury at E5476 Detected in 2/3 samples; maximum concentration 0.14 g/m 3 (RSL=1,300 g/m 3 ) COPCs Not Routinely Analyzed by Commercial Labs 1,4 dithiane and 2 chlorovinyl ether at E5654 Not detected at E5654 (RL<RSL) Detected at E5429 SG 04 at conc. of 210 g/m 3 (RSL=15,330 g/m 3 ) Mirex and 2,4,6 tribromophenol at E5286 (not collected) 2,4,6 tbp detected at E5265 SS 02 at conc. of 32 g/m 3 (RSL=3,956 g/m 3 )
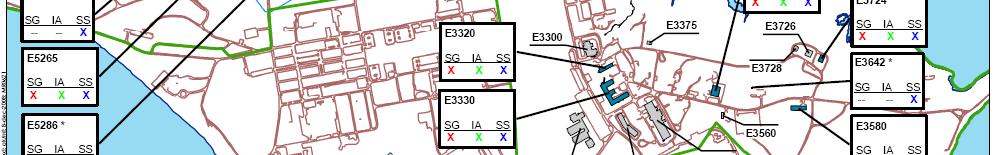
36 Focused Assessment of Selected COPCs - continued COPCs with Very Low Screening Levels 4 chlorophenylether, hexachlorobenzene, dieldrin, heptachlor, heptachlor epoxide, alpha BHC, beta BHC, gamma BHC at E5441 Not detected at E5441 (RL<RSL) or elsewhere Aroclor , 1254, 1260at E3642 Not detected at E3642 or elsewhere 2 samples at E3642 RL=24 g/m 3 (RSL=22 g/m 3 )
37