SUMMARY.
|
|
|
- Roxanne Beasley
- 5 years ago
- Views:
Transcription
1 Regional Water Quality NEWSLETTER DATE: Report for July 2016 A Tempe, Glendale, Peoria, Chandler, Phoenix, ADEQ, CAP, SRP, Epcor NSF Central Arizona-Phoenix Long-Term Ecological Research ASU Regional Water Quality Partnership SUMMARY 1. Taste and Odor compounds were all below the threshold levels of 10 ng/l in the canals and water treatment plants. One Bartlett epilimnion sample was above the threshold odor level and results were similar to results observed in June. 5. SAVE the date. Friday September 23 rd will be the 2016 ASU Regional Water Quality Workshop at the Pera Club from 8:30-11: The DOC concentrations could not be measured because of technical difficulties. However, UV absorbance values were very similar to the values observed during June sample and UV absorbance values have historically tracked DOC concentrations. In June, both Saguaro and Bartlett DOC concentrations ranged from mg/l. The DOC concentrations in Canals and WTPs were somewhat lower as attenuation and dilution with groundwater lowered the concentrations. Dilution from groundwater was not prevalent during July sampling as groundwater pumping decreased between June and July. 3. The primary source of surface water is the Salt River at the time of sampling. CAP diversions to the Arizona Canal increased and groundwater pumping decreased as compared to June. 4. Microbial concentrations tended were similar to or less than the concentrations measured in June. Temperatures continued to increase but there was not much monsoon rainfall. 1
2 Topics Du Jour Microbial Water Quality Data Over the years the regional water quality center has collected data on numerous different topics but very little data has been collected on basic microbial water quality. Therefore, we have initiated microbial sampling for E. Coli, total coliforms and mycobacterium in the canal system to determine potential impacts on both water quality and sources of possible contamination. The values in the tables below for sampling in July were similar to or less than the values from sampling in June. While temperatures have been increasing, there has not been much impact from monsoon rainfall. All Values are cfu per 100 ml Sample E. coli Coliform Blank Average 0 0 AZ Canal at Highway 87 average South Canal below CAP Cross- connect average Cap Canal at Cross-connect average AZ Canal at 56th St. average AZ Canal- Central Avenue average Pima Average AZ Canal above CAP Cross-connect average 3 18 Waddell Canal average Verde Beeline average AZ Canal below CAP Cross-connect average head of the Consolidated Canal average Middle of Consolidated Canal average Head of Tempe Canal average Mycobacterium (June) colonies Blank 0 AZ Canal at Highway 87 3 South Canal below CAP Cross- connect 9 Cap Canal at Cross-connect 0 AZ Canal at 56th St. 2 AZ Canal- Central Avenue 0 AZ Canal at Pima 0 AZ Canal above CAP Cross-connect 1 Waddell Canal 0 Verde Beeline CONT AZ Canal below CAP Cross-connect 2 head of the Consolidated Canal 4 1
3 Middle of Consolidated Canal 0 Head of Tempe Canal 2 CONT Contaminated with other bacteria 2
 Flow into SRP Canal System Dissolved organic carbon Concentration (mg/l) ** 985 cfs 596 cfs into Arizona 2.9 mg/l Canal 114 cfs 850 cfs into South Canal 3.")
4 Source Trend in supply Discharge to water supply system Salt River Verde River Reservoirs at 53% full Reservoirs At 43% full Quick Update of Water Supplies for July, 2016 (during day of canal/wtp July 12th, 2016 ) Flow into SRP Canal System Dissolved organic carbon Concentration (mg/l) ** 985 cfs 596 cfs into Arizona 2.9 mg/l Canal 114 cfs 850 cfs into South Canal 3.0 mg/l 436 cfs of CAP water into Arizona Canal Colorado River Lake Pleasant is 71.1% full (Lake Powell is 57.1% full) Lake Pleasant is* releasing 2100 cfs Groundwater Pumping *** 169 cfs pumping by SRP 169 cfs Groundwater Pumping into SRP Canals *CAP is releasing 0 cfs from Lake Pleasant which was 0% of the total flow **Concentration of DOC in the terminal reservoir ***CAP water is being delivered to the Arizona Canal. 3.8 mg/l 0.5 to 1 mg/l Data from the following websites:


5 The following views are from SRP website, and show which wells are operating along the various canals. 4
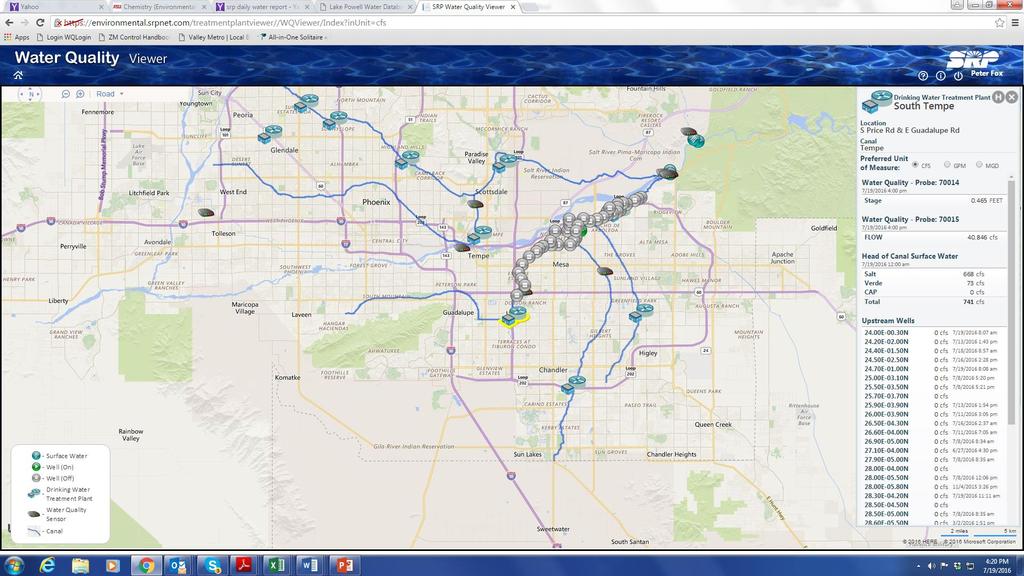
6 5
7 Dissolved Organic Carbon In Reservoirs and Treatment Plants DOC = Dissolved organic carbon UV254 = ultraviolet absorbance at 254 nm (an indicator of aromatic carbon content) SUVA = UV254/DOC TDN = Total dissolved nitrogen (mostly nitrate from groundwater) July 2016 Data Sample Description Location DOC (mg/l) UV254 (l/cm) SUVA (L/mgm) TDN (mg/l Havasu (March) N/A #VALUE! Lake Pleasant (March) Epilimnion N/A #VALUE! Hypolimnion N/A #VALUE! Verde River at Tangle N/A #VALUE! Verde River at Beeline Highway N/A #VALUE! Bartlett Reservoir Epilmnion N/A #VALUE! Hypolimnion N/A #VALUE! Epilimnion N/A #VALUE! Saguaro Lake Epi - Duplicate N/A #VALUE! Hypolimnion N/A #VALUE! Salt River at Blue Point Bridge N/A #VALUE! Salt River above Roosevelt N/A #VALUE! Roosevelt Reservoir Point 1 Epilmnion N/A N/A N/A N/A Hypolimnion N/A N/A N/A N/A Roosevelt Reservoir Point 2 Epilmnion N/A N/A N/A N/A Hypolimnion N/A N/A N/A N/A Apache Reservoir Point 1 Epilmnion N/A N/A N/A N/A Hypolimnion N/A N/A N/A N/A Apache Reservoir Point 2 Epilmnion N/A N/A N/A N/A Hypolimnion N/A N/A N/A N/A Canyon Reservoir Point 1 Epilmnion N/A N/A N/A N/A Hypolimnion N/A N/A N/A N/A Canyon Reservoir Point 2 Epilmnion N/A N/A N/A N/A Hypolimnion N/A N/A N/A N/A 6
8 Organic Matter in Canal & Water Treatment Plants Water Treatment Plants- July 11th-12th, 2016 Sample Description DOC (mg/l) UV254 (l/cm) SUVA (L/mg-m) TDN (mg/l Union Hills Inlet n/a #VALUE! N/A Union Hills Treated n/a #VALUE! N/A Tempe North Inlet n/a #VALUE! N/A Tempe North Plant Treated n/a #VALUE! N/A Tempe South Inlet n/a #VALUE! N/A Tempe South Plant Treated n/a #VALUE! N/A Greenway WTP Inlet n/a #VALUE! N/A Greenway WTP Treated n/a #VALUE! N/A Glendale WTP Inlet n/a #VALUE! N/A Glendale WTP Treated n/a #VALUE! N/A Anthem WTP Inlet n/a #VALUE! N/A Anthem WTP Treated n/a #VALUE! N/A 24th Street WTP Inlet n/a #VALUE! N/A 24th Street WTP Treated n/a #VALUE! N/A Chandler WTP Inlet n/a #VALUE! N/A Chandler WTP Treated n/a #VALUE! N/A Rivers and Canals- July 11th-12th, 2016 Sample Description DOC (mg/l) UV254 (l/cm) SUVA (L/mg-m) TDN (mg/l Waddell Canal n/a #VALUE! Anthem WTP Inlet n/a #VALUE! Union Hills Inlet n/a #VALUE! CAP Salt-Gila Pumping Station (June) n/a #VALUE! CAP Mesa Turnout (June) n/a #VALUE! CAP Canal at Cross-connect n/a #VALUE! Salt Blue pt. Bridge n/a #VALUE! Verde Beeline n/a #VALUE! AZ Canal above CAP Cross-connect n/a #VALUE! AZ Canal below CAP Cross-connect n/a #VALUE! AZ Canal at Highway 87 n/a #VALUE! AZ Canal at Pima Rd. n/a #VALUE! AZ Canal at 56th St. n/a #VALUE! AZ Canal - Central Avenue n/a #VALUE! AZ Canal - Inlet to Glendale WTP n/a #VALUE!
9 AZ Canal - Inlet to Greenway WTP n/a #VALUE! South Canal below CAP Cross-connect n/a #VALUE! Head of Tempe Canal n/a #VALUE! Tempe Canal - Inlet to Tempe's South Plant n/a #VALUE! Head of the Consolidated Canal n/a #VALUE! Middle of Consolidated Canal n/a #VALUE! Chandler WTP - Inlet n/a #VALUE!
10 Taste and Odor MIB, Geosmin and Cyclocitral are compounds naturally produced by algae in our reservoirs and canals, usually when the water is warmer and algae are growing/decaying more rapidly. They are non toxic, but detectable to consumers of water because of their earthy-musty-moldy odor. The human nose can detect these in drinking water because the compounds are semi-volatile. Since compounds are more volatile from warmer water, these tend to be more noticable in the summer and fall. The human nose can detect roughly 10 ng/l of these compounds. Our team collects samples from the water sources and raw/treated WTP samples. Table 1 - Water Treatment Plants July 11, 2016 Sample Description MIB (ng/l) Geosmin (ng/l) Union Hills Inlet 2.2 <2.0 Union Hills Treated 2.9 <2.0 Tempe North Inlet <2.0 <2.0 Tempe North Plant Treated Tempe South WTP 2.0 <2.0 Tempe South Plant Treated Anthem Inlet 3.8 <2.0 Anthem Treated 3.9 <2.0 Chandler Inlet 2.5 <2.0 Chandler Treated Greenway WTP Inlet 4.1 <2.0 Greenway WTP Treated Glendale WTP Inlet ns ns Glendale WTP Treated <2.0 <2.0 24th St. WTP Inlet th St. WTP Outlet <2.0 <2.0 Table 2 - Canal Sampling July 11,
11 System Sample Description MIB (ng/l) Geosmin (ng/l) CAP Waddell Canal 2.7 <2.0 AZ Canal South Tempe Canals Union Hills Inlet 2.2 <2.0 CAP Canal at Crossconnect 3.4 <2.0 Salt Blue Pt Bridge 2.0 <2.0 Verde Beeline AZ Canal above CAP <2.0 <2.0 Cross-connect AZ Canal below CAP Cross-connect 3.0 <2.0 AZ Canal at Highway <2.0 AZ Canal at Pima Rd. 3.0 <2.0 AZ Canal at 56th St AZ Canal - Central Avenue AZ Canal - Inlet to Glendale WTP ns ns Head of the Consolidated Canal Middle of the Consolidated Canal South Canal below CAP Cross-connect Head of the Tempe Canal Tempe Canal - Inlet to Tempe's South Plant 2.1 < <2.0 <2.0 < < <2.0 Salt-Gila (June) 2.5 <2.0 Mesa Turnout (June) 2.9 <2.0 10
12 Table 3 - Reservoir Samples July 13, 2016 Sample Description Location MIB (ng/l) Geosmin (ng/l) Lake Pleasant (June) Eplimnion 3.5 <2.0 Lake Pleasant Hypolimnion (June) Verde Beeline Bartlett Reservoir Epilimnion Bartlett Reservoir Epi-near dock Bartlett Reservoir Hypolimnion Salt BluePt Bridge Saguaro Lake Epilimnion 2.8 <2.0 Saguaro Lake Epi Duplicate Saguaro Lake Epi-near dock 2.4 <2.0 Saguaro Lake Hypolimnion 2.1 <2.0 Lake Havasu (June) Verde River at Tangle Creek (June) Roosevelt at Salt River Inlet (June) < <2.0 <2.0 11