Presentation Outline
|
|
|
- Barbara Daniels
- 5 years ago
- Views:
Transcription
1 Approximation of Discharge Volumes During Precipitation Events for a Portland, Oregon Stormwater System Class Project Presentation Van McKay, James Manzione PSU Geography 592 March 16, 2009 Presentation Outline Background Methods Results Conclusions 1

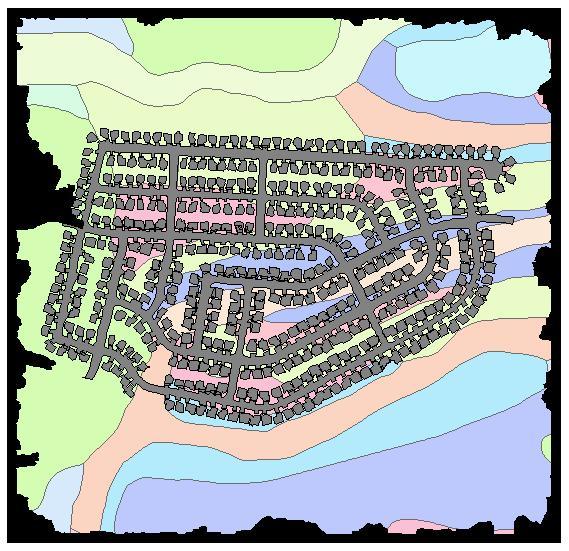
2 Background Vicinity Map Area of Concern 2

3 Area of Concern Bauer Woods Estates Wetland Health and Urban Stormwater Runoff Stormwater runoff and pollutants Water quality and water quantity Wetlands as filtration system 3

4 Research Questions What are the Approximate Discharge Volumes of a Community Watershed? How does an Artificial Drainage System Affect the Local Watershed? At What Precipitation Rate does Flooding Occur? 4
5 Spatial and Attribute Databases Digital Elevation Model (DEM) Stormwater lines vector layer Stormwater catch basins vector layer Vector street layer Vector parcel layer Soils layer Precipitation data Methods Terrain Modeling and Stormwater System Networking Automating Precipitation Data Determining Wetland Water Levels 5

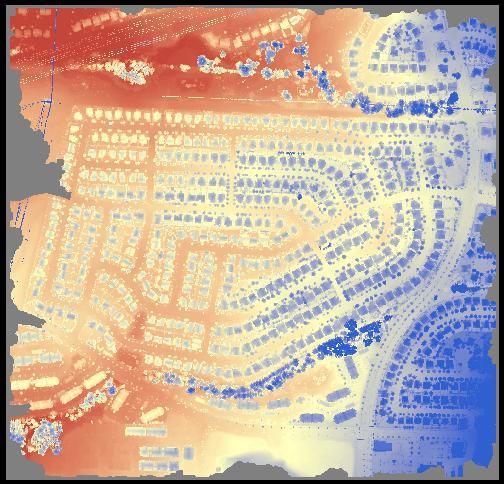
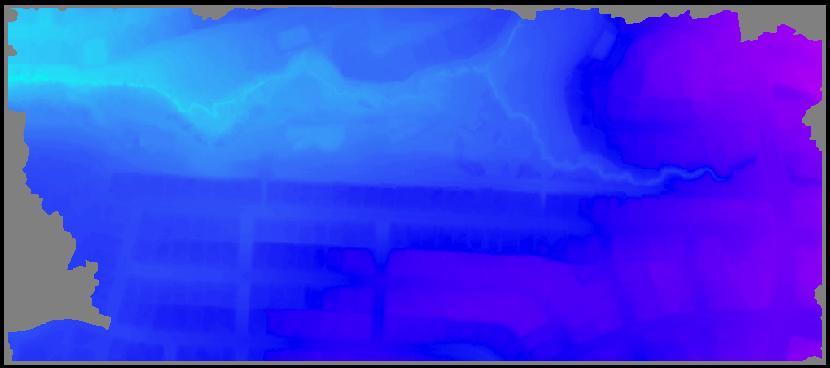
6 Methods Terrain Modeling and Stormwater System Networking 6

7 Drainage Network Drainage Point Outfalls Drainage Drainage Lines Lateral Main Methods Defining Watershed Features 7
8 8

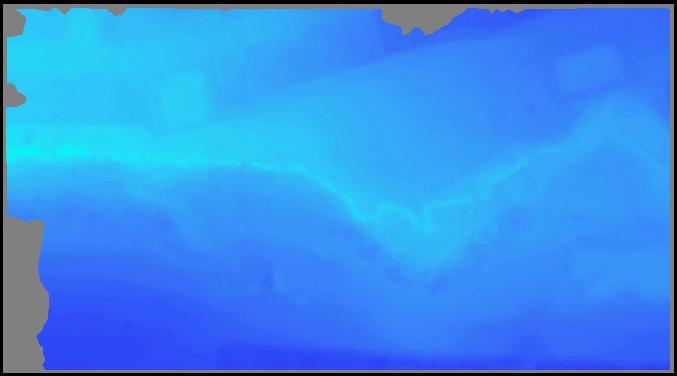
9 Methods Approximating Surface Volumes 9
10 Multi Criteria Assessment Weighted Considerations: Sub Catchment Surface Feature Areas Average Catchment Slopes Impermeable Surfaces Permeable Surfaces Unique Soil Infiltration Rates Drainage Volume Formula Where: And: DV: CA: DV CA P CS PIR ISR 12 = ISR = SCA * SPR Drainage Volume Catchment Area P: Precipitation Rate CS: PIR: ISR: Catchment Slope Average Permeable Surface Infiltration Impermeable Surface Restriction PIR= SCA * SCA: SPR: 12: Conversion from Inches to Feet (per hour) Sub Catchment Area Soil Permeability Rate 0.015: Constant for Pavement Water Storage 10


11 Precipitation Test Goal: To Test a Rolling Increment of Values to Determine Potential Flooding Increments of the Drainage Wetlands Values Tested: in./hour at 0.01 Time Steps 0.25, 0.50, 1.00, and 2.00 in./hour Testing Location: Northern Wetland / Riparian Habitat 11

12 Bug Found in ArcHydro! When Accumulating your Values make sure that you DO NOT Re Sort your Output Table This Tool Calculates the Accumulation Depending on the Current Arrangement of Table Values Check NextDownID s for Connection Variances Methods Determining Wetland Water Levels 12
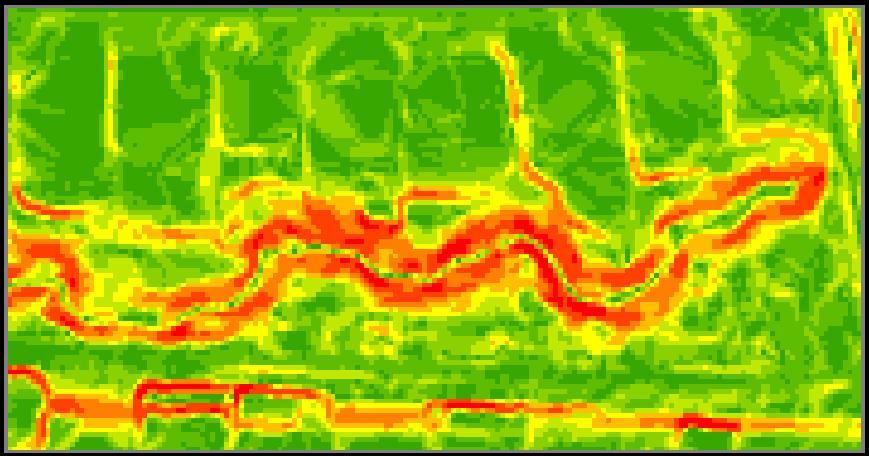
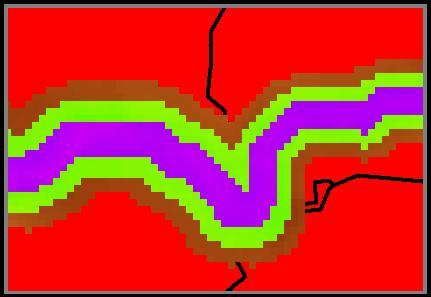

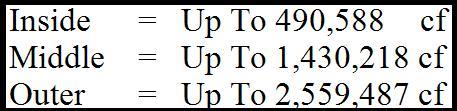
13 Stream Delineation Channel and Flood Plane Delineation 13
14 Restate Research Questions What are the Approximate Discharge Volumes of a Community Watershed? How does an Artificial Drainage System Affect the Local Watershed? At What Precipitation Rate does Flooding Occur? Results What are the Approximate Discharge Volumes of a Community Watershed? 14
 25000000 20000000 15000000 10000000 5000000 0 0.01 0.03 0.05 0.07 0.09 0.11 0.13 0.15 0.17 0.19 0 0.25 0.")
15 Identify Areas of Interest Outfall Drainage Volumes Test Outfall Drainage Values Extreme Outfall Drainage Volumes Drainage Volume (cf/hour) Drainage Volume (cf/hour) Precipitation Rates (in/hour) Precipita tion Rate s (in/hour) Drainage Values Drainage Volumes 15
 16")
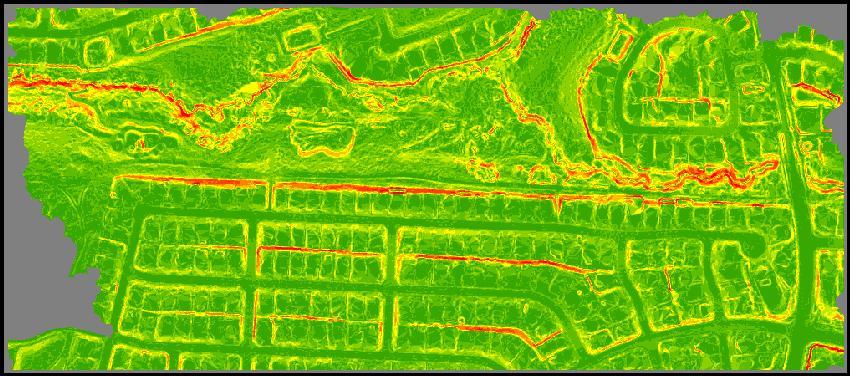
16 Results How does an Artificial Drainage System Affect the Local Watershed? Erosion Potentials (Derived by Slope) 16
17 Comparative Discharge Volumes Discharge Volumes 30,000,000 Discharge Volumes (cf/hour) 25,000,000 20,000,000 15,000,000 10,000,000 5,000, Precipitation (in./hour) Cummulative Discharge Entering Discharge Before Discharge Results At What Precipitation Rate does Flooding Occur? 17
18 Test Outfall Drainage Values Test Outfall Drainage Values 3,500,000 Drainage Volume (cf/hour) 3,000,000 2,500,000 2,000,000 1,500,000 1,000, , Precipitation Rate (in/hour) Test Outfall Channel (8 ft. buffer) Flood Plane 1 (16 ft. buffer) Flood Plane 2 (24 ft. buffer) Extreme Outfall Drainage Volumes Extreme Outfall Drainage Volumes 30,000,000 Drainage Volume (cf/hour) 25,000,000 20,000,000 15,000,000 10,000,000 5,000, Precipitation Rate (in/hr) Test Outfall Channel (8 ft. buffer) Flood Plane 1 (16 ft. buffer) Flood Plane 2 (24 ft. buffer) 18
19 Conclusions Limitations Does not take into consideration Groundwater Hydrology Precipitation Values are Manually Entered Stream Delineation was not measured On Site Requires Field Data for Calibration and Accuracy Assessment Does not measure Previous Conditions Bug in ArcHydro 19
20 Questions Master background slide 20