Modeling the Hydrologic Impacts of Control Structures Utilizing LiDAR, ICPR, and GIS Technologies
|
|
|
- Loren Sparks
- 5 years ago
- Views:
Transcription


1 Modeling the Hydrologic Impacts of Control Structures Utilizing LiDAR, ICPR, and GIS Technologies Keanan Bell NorthStar June 12, 2015
2 Project began in 2010 as a Hydrology Assessment and Conceptual Restoration Plan Limited to a 2,000 acre Wildlife and Environmental Area Objectives: 1. Identify man-made impacts to hydrology 2. Recommend modifications to drainage system


3 Project scope was expanded in 2011 to evaluate the hydrologic conditions of the primary canal channel Third phase of the project in 2012 included surveys, sampling and preparation of a hydrologic model of the canal.


4 In 2014, this project was initiated to prepare a series of surface water model simulations. Much greater area 30,000 acres > 2,000 acres for original assessment Project Goals: Enhance spring flows Rehydrate natural systems Augment groundwater supplies
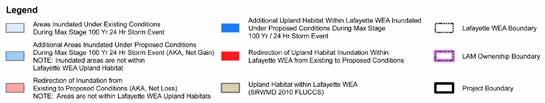
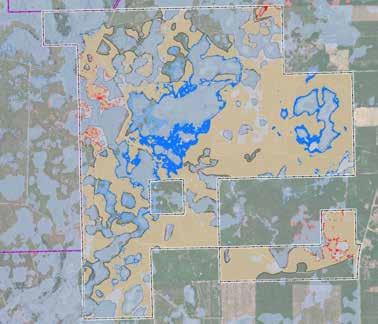
5 Project Objectives: Model predicted inundation following three types of rainfall events 100-Year/24-Hour Storm (Major Event) Typical Wet Season Event Typical Dry Season Event Events were modeled once using existing conditions Events modeled again using proposed conditions where water control structures were strategically located into the system Goal of proposed condition simulation Retain water that is currently being lost outside the system


6 Size 30,000 acres is a large, complex system to model Assumptions Impacts Gopher tortoise habitat Private property

7 Interconnected Channel and Pond Routing (ICPR ) Widely used throughout Florida Approved by FEMA as a floodwater management modeling program What else? Large node-link capacity Processing time efficiency Accessible interface Results can easily be ported to a GIS for further analysis
8 ICPR: An Overview Simulated hydrology by using time-variance hydrographs to compute runoff based on rainfall intensity and duration Hydrologic site characteristics are analyzed by processing the parameters into a drainage network of storage nodes that are linked by conveyance features ( links ) such as channels, weirs and pipes.
9 Source of Rainfall data? 100-Yr/24-Hr rainfall data was provided by the FDOT Hydrology Book. 11 inches over 24 hours For typical wet and dry season storm events, 10-yr rainfall data was obtained from a rainfall station near the site. Based on team input, April through September was used for wet season data, while October through March was used for dry season data. Wet season 4.99 inches over 24 hours Dry season 2.63 inches over 24 hours


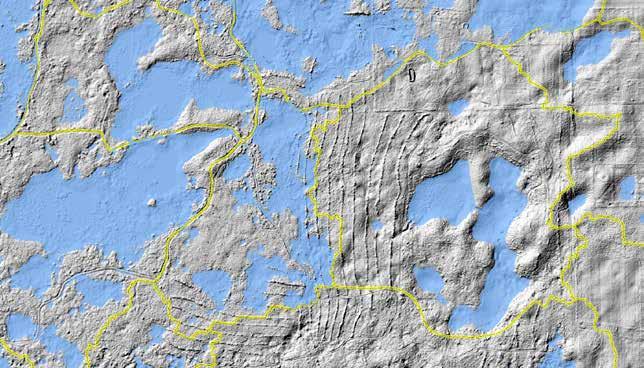
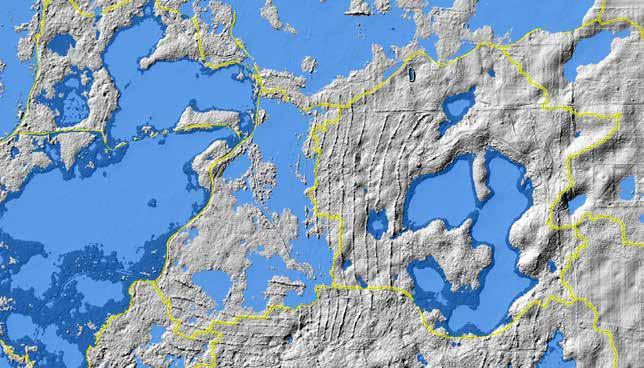
10 Watershed Basin Delineation LiDAR data was used to create a Digital Elevation Model (DEM) A hydrologic network was prepared in a GIS using spatial analysis and hydrologic modeling tools. Sub-basin delineations were derived from the hydrologic network
11 Sub-basin Runoff / Developing Sub-basin Parameters SCS Method developed by the former Soil Conservation Service Runoff properties are described by a Curve Number (CN) and the time of concentration (Tc) for each subbasin CN based on land use, slope, soil drainage and saturation Tc calculated from the hydraulically longest flow path, aka, the time for runoff to reach a collection point


12 After sub-basin delineation, Nodes are assigned to each sub-basin at the lowest point of elevation in the basin Links represent surface water conveyance to the node collection points This network of nodes and links is the hydraulic system and commonly referred to as the node-link diagram The diagram also includes outfall locations


13 ICPR model results are delivered in text file format Stage elevations are assigned to each sub-basin reflecting inundation within a sub-basin for all areas under the stage elevation Python scripts developed in an ESRI GIS environment GIS models prepared to automate the application of model results to each raster sub-basin
14 Several proposed water control structures were integrated into the model to evaluate proposed conditions Addition of culverts Addition of flashboard risers Addition of channel blocks An additional node-link diagram was prepared to model these proposed condition changes
15
16 Total outflowing Volume in 120 hrs (cubic feet) Storm Event Existing Proposed Diff (Ex-Pr) 100-Yr /24-Hr 3.18E E E+06 Typical Wet 1.33E E E+06 Typical Dry 4.99E E E+06 How much water is being retained when existing conditions are compared to proposed.
17
18 Additional data Model the interaction between surface water and groundwater to determine infiltration

19 Thanks for attending! For more information contact