Natural Gas Outlook and Assessment of Energy Infrastructure
|
|
|
- Arline Richards
- 5 years ago
- Views:
Transcription


1 Natural Gas Outlook and Assessment of Energy Infrastructure Georgia Tech Conference Center Atlanta, Georgia March 10, 2006 David E. Dismukes Center for Louisiana State University
2 Summary on Impacts of Hurricanes Hurricanes were incredibly destructive to energy business effects felt for some time. Hurricanes clearly showed the interrelationship of all types of energy infrastructure in the Gulf the 4 Ps production, processing, pipes, and power. Hurricanes impacts were felt nationally drives home importance of Gulf coast. Price and supply wildcards: geopolitics, weather, and industrial activity. Recent industrial demand destruction not clear but a big potential looming problem. Energy markets are likely to not be back on their feet prior to the next hurricane season.
3 The WORST Case Scenario: Two Hurricanes in the Heart of the Largest Energy Infrastructure Region of the U.S.
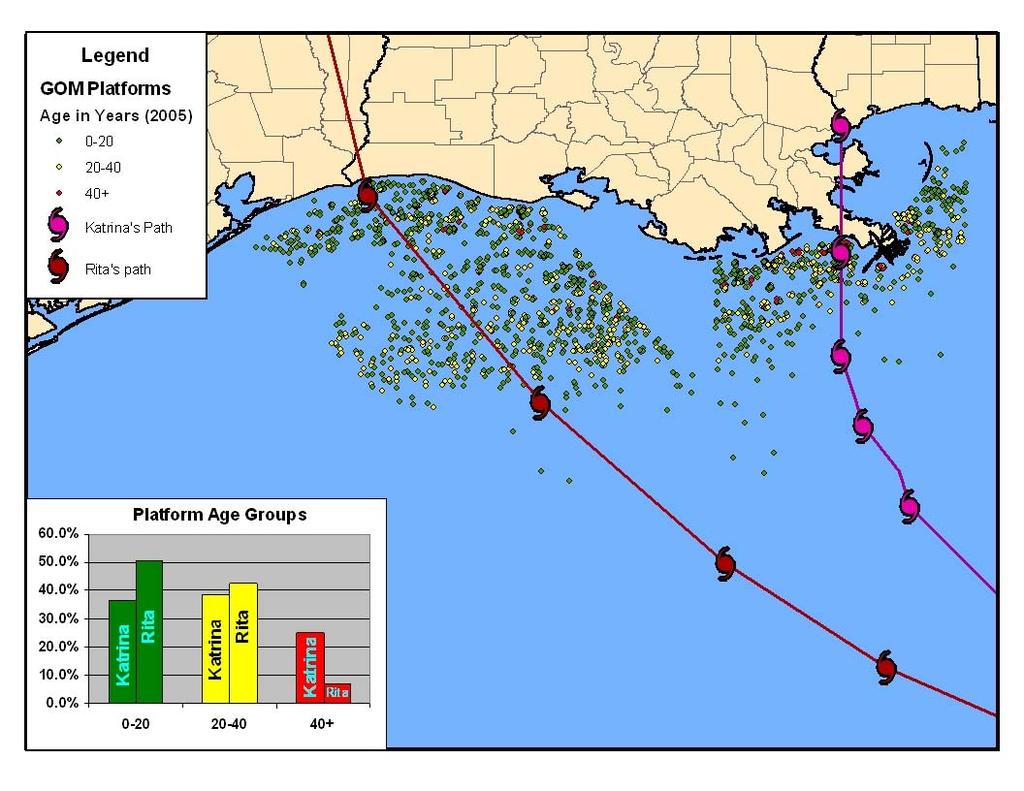
4 Platforms/Structures Impacted by Rita
5 Shut-in Statistics Natural Gas Percent Total Percent Shut-in of Daily Cumulative of Annual Percent of Natural Gas GOM Gas Shut-in Gas GOM Gas Annual US Date Production Production Production 1 Production Production (bcf/day) (%) (bcf) (%) (%) week ending 9/23/ % % 0.6% week ending 9/30/ % % 0.8% week ending 10/7/ % % 1.0% week ending 10/14/ % % 1.2% week ending 10/21/ % % 1.4% week ending 10/28/ % % 1.5% week ending 11/4/ % % 1.7% week ending 11/10/ % % 1.8% week ending 11/18/ % % 1.9% week ending 11/23/ % % 2.0% week ending 12/02/ % % 2.1% week ending 12/09/ % % 2.1% December 12, % % 2.2% December 15, % % 2.2% December 19, % % 2.2% December 22, % % 2.3% December 29, % % 2.3% January 5, % % 2.4% January 9, % % 2.4% January 11, % % 2.4% January 25, % % 2.5% February 8, % % 2.6% February 22, % % 2.7% Note: 1 cumulative production is as of August 26, 2005 Source: Minerals Management Service
6 Shut-in Statistics Crude Oil Percent Total Percent Shut-in of Daily Cumulative of Annual Percent of Oil GOM Oil Shut-in Oil GOM Oil Annual US Date Production Production Production 1 Production Production (bbls/day) (%) (bbls) (%) (%) week ending 9/23/05 1,486, % 30,280, % 1.5% week ending 9/30/05 1,467, % 40,828, % 2.0% week ending 10/7/05 1,162, % 50,105, % 2.4% week ending 10/14/05 1,008, % 57,642, % 2.8% week ending 10/21/05 986, % 64,547, % 3.1% week ending 10/28/05 1,017, % 71,613, % 3.4% week ending 11/4/05 780, % 78,193, % 3.8% week ending 11/10/05 736, % 82,735, % 4.0% week ending 11/18/05 702, % 88,540, % 4.3% week ending 11/23/05 615, % 91,731, % 4.4% week ending 12/02/05 539, % 96,956, % 4.7% week ending 12/09/05 447, % 100,369, % 4.8% December 12, , % 101,693, % 4.9% December 15, , % 102,973, % 4.9% December 19, , % 104,648, % 5.0% December 22, , % 105,889, % 5.1% December 29, , % 108,775, % 5.2% January 5, , % 111,633, % 5.4% January 9, , % 113,246, % 5.4% January 11, , % 114,042, % 5.5% January 25, , % 119,356, % 5.7% February 8, , % 124,502, % 6.0% February 22, , % 129,590, % 6.2% Note: 1 cumulative production is as of August 26, 2005 Source: Minerals Management Service
7 Status of Louisiana Oil and Gas Production State Oil Production 32% Shut-in State Natural Gas Production 19% Shut-in 64,429 barrels per day remains shutin. This represents 31.7 percent of daily production 138,710 barrels per day has been restored. This represents 68.3 percent of daily production MMcf per day remains shut-in. This represents 18.8 percent of daily production Restored gas production is 1,814.5 MMcf per day. This represents 81.2 percent of daily production Note: As of February 26,2006. Source: Louisiana Department of Natural Resources
8 $18 $16 $14 $12 $10 $8 $6 $4 $2 $0 Henry Hub and Houston Ship Channel Hub Price ($/Mcf) Dec-04 Jan-05 Feb-05 Mar-05 Apr-05 May-05 Jun-05 Jul-05 Aug-05 Sep-05 Oct-05 Nov-05 Dec-05 Jan-06 Feb-06 Henry Hub Houston Ship Channel
9 $4.00 $3.50 $3.00 $2.50 $2.00 $1.50 $1.00 $0.50 $0.00 -$0.50 Henry Hub Less Houston Ship Channel Price Difference Dec-04 Jan-05 Feb-05 Mar-05 Apr-05 May-05 Jun-05 Jul-05 Aug-05 Sep-05 Oct-05 Nov-05 Dec-05 Jan-06 Feb-06
10 Total Immediate Refinery Impact Hurricane Katrina LA/MS/AL Gulf Coast Refiners (reduced runs and shutdowns) 2,528 mbbl/day 15% of US operating capacity Remaining US Operating Capacity 12,075 mbbl/day 70% of US operating capacity Port Arthur/Lake Charles (reduced runs and supply loss) 775 mbbl/day 5% of US operating capacity Midwest (reduced runs supplied by Capline Pipeline) 1,628 mbbl/day 10% of US operating capacity Hurricane Rita Port Arthur/Lake Charles (shutdowns and damaged facilities) 1,715 mbbl/day 10% of US operating capacity Houston/Texas City (shutdowns and damaged facilities) 2,292 mbbl/d 13.5% of US operating capacity Remaining US Operating Capacity 11,954 mbbl/day 70% of US operating capacity Corpus Christi (shutdown and reduced runs) 706 mbbl/day 4% of US operating capacity Midwest (reduced runs from supply loss) 338 mbbl/day 2% of US operating capacity Total Refinery Impact 4,931 mbbl/day 30% of US operating capacity Total Refinery Impact 5,052 mbbl/day 30% of US operating capacity Source: Energy Information Administration, Department of Energy
11 Gasoline Price Increases August 30, 2005 to September 6, Source: American Petroleum Institute Regional Changes in Gasoline Prices (cents per gallon) 60.1 Mid-Atlantic 54.9 Northeast 51 South Atlantic 46.9 Midwest 39.5 South 38.5 Mountain 25.3 West 44.7 US Colonial / Plantation Pipeline Systems < > 50 55
12 Number of Natural Gas Processing Facilities Out Outages at gas processing facilities throughout all of south Louisiana was one of the more unique aspects of the combined hurricanes. Capacity Throughput (MMcf/d) (MMcf/d) Mississippi and Alabama Plants BP Pascagoula 1, DEFS Mobile Bay RDS Yellowhammer Total 1, ,175.0 East Louisiana Plants DYN Venice 1, EPD Toca 1, DYN Yscloskey 1, ,343.0 Total 4, ,947.8 West Louisiana Plants DYN Barracuda BP Grand Chenier WMB Johnson Bayou EPD Sabine Pass DYN Stingray Total 1, ,036.0 Central Louisiana Plants DYN Lowry EPD Cow Island AHC Sea Robin EPD Calumet 1, Norcen Patterson I DUK Patterson II EPD Pelican Total 4, ,669.8 Grand Total 12, ,828.6 Assumed Total GOM Production 10,000.0 Percent of Total 78.3% Source: LMOGA
13 Current Status of Natural Gas Plants in the Coastal Gulf Region 23% of pre-storm gas processing capacity is still shut-in 27% of pre-storm gas processing volumes are not flowing Pre Hurricane Post Hurricanes Bcf per day Capacity Note: Data are for plants with capacity equal to or greater than 100 MMcf per day, in the coastal counties of Texas, Louisiana, Mississippi and Alabama. Source: Energy Information Administration, Department of Energy Flow
14 Energy Capacity Offline: Current and Forecast
15 Estimated Return of Existing Crude Production Shut-ins have reached a difficult plateau trend much like Hurricane Ivan Lost production thousand bbls per day 1,800 1,600 1,400 1,200 1, Ivan Rita Ivan - % of Total GOM Rita - % of Total GOM 100% 90% 80% 70% 60% 50% 40% 30% 20% percent of total GOM landfall Note: Shut-in statistics for Ivan were no longer reported after 150 days. The latest shut-in statistics for Katrina and Rita were published on February 22, Source: Minerals Management Service 10% 0% 150 days after Rita s landfall is 21-Feb-06
16 Forecast versus New Forecast Crude Oil 7 Shut in production will total million barrels by the end of the third quarter Cumulative shut in for through 2005 totals million barrels, while cumulative shut in for the first three quarters of 2006 total 83.1 million barrels 43 % of total impact yet to be experienced MMBbls per day EIA Short-Term Outlook in September 2005 Current CES Outlook EIA Actual (Q3 & Q4 2005) EIA Short-Term Outlook in February 2006 CES Outlook from 9/28/05 Q Q Q Q Q Q Note: Assuming recovery of bcf per day for 150 days.
17 Estimated Return of Existing Natural Gas Production Lost production bcf per day Shut-ins have reached a difficult plateau trend much like Hurricane Ivan Ivan Rita Ivan - % of Total GOM Rita - % of Total GOM 100% 90% 80% 70% 60% 50% 40% 30% 20% 10% percent of total GOM 0 landfall Note: Shut-in statistics for Ivan were no longer reported after 150 days. The latest shut-in statistics for Katrina and Rita were published on February 22, Source: Minerals Management Service 0% 150 days after Rita s landfall is 21-Feb-06
18 Forecast versus New Forecast Natural Gas 6 Shut in production will total bcf by the end of the third quarter Cumulative shut in for through 2005 totals bcf, while cumulative shut in for the first three quarters of 2006 total bcf tcf EIA Short-Term Outlook in September 2005 Current CES Outlook EIA Actual (Q3 & Q4 2005) EIA Short-Term Outlook in February 2006 CES Outlook from 9/28/05 Q Q Q Q Q Q Note: Assuming recovery of bcf per day for 150 days.
19 Estimated Decrease in Refining Production from both Katrina and Rita 6,000 Refining capacity should return to normal soon, but there will be a stubborn five percent of total capacity that has unknown return date not good for tight markets 100% 5,000 Total Lost Production Lost Production as a Percent of US Total Capacity 90% 80% thousand bbls per day 4,000 3,000 2,000 70% 60% 50% 40% 30% percent of US capacity 1,000 20% 10% 0 0% Landfall Source: Assumes 95 percent capacity factor; assumes 4 week recovery for facilities damaged by Rita. 214 days is March 31, 2006
20 Cumulative Refining Production 4,000 3,500 Impacts of Katrina and Rita result in a loss of 240 million barrels, or 4 percent of total, by the end of the year. This is equivalent to shutting down all US refineries for 14 days. Cumulative Production - Business as Usual Cumulative Production - After Katrina Cumulative Production - After Katrina and Rita 3,000 2,500 million bbls 2,000 1,500 1, Jun-05 Jul-05 Aug-05 Sep-05 Oct-05 Nov-05 Dec-05 Source: Assumes 95 percent capacity factor
21 Ongoing Production and Natural Gas Market Challenges
22 1,800 1,600 1,400 1,200 1, Source: Baker-Hughes Inc. Weekly Counts of Rotary Rigs in Operation Jan-99 Apr-99 Jul-99 Number of Operating Rigs Oct-99 Jan-00 Apr-00 Jul-00 Oct-00 Jan-01 Apr-01 Jul-01 Oct-01 Jan-02 Apr-02 Jul-02 Oct-02 Jan-03 Apr-03 Jul-03 Oct-03 Jan-04 Apr-04 Jul-04 Oct-04 Jan-05 Apr-05 Jul-05 Oct-05 Jan-06 Oil Gas Total 5-Year Average Total operating rigs are 36 percent above the 5-year average, and 21 percent above the previous peak in July 2001
23 U.S. Natural Gas Production and Monthly Rig Count (1997-Present) 1,600 1,400 Despite increased drilling efforts, production is falling; The US is seeing decreasing drilling productivity 3 percent increase in production (Aug-99 to Dec-01) 3 percent decrease in production 68 (Sep-04 to Nov-05) 67 1, Rig Count 1, percent increase in rigs (Apr-99 to Jul-01) 72 percent increase in rigs (Jan-03 to Nov-05) Production (Bcd/d) Rig Count Production (12-month moving average) 0 Jan-97 Jan-98 Jan-99 Jan-00 Jan-01 Jan-02 Jan-03 Jan-04 Jan Source: Energy Information Administration, Department of Energy; and Baker-Hughes Inc.
24 Natural Gas Productive Capacity and Utilization 60 Producers are at the limits of production capabilities 100% % Capacity (Bcf per day) % 85% 80% 75% Utilization (percent) % Note: This is an approximation. Source: EnergySeer.com

25 Resource Estimates Restricted Areas Estimated, Percentage Restricted High return frontier areas are off limits for new drilling and production activity. ANWR = 3.5 TCF ANS = 35 TCF Source: Independent Petroleum Association of America
26 Increase in Natural Gas Usage by Major Sector (1994 and 2004) Total Natural Gas Delivered to End Users Increase by Sector 21,000 20,000 19, Tcf 8.7 percent increase 20.6 Tcf Electric Power 94.5% Residential 1.3% Commercial 4.2% 18,000 17,000 16,000 15, Note: Industrial consumption decreased by 11% Source: Energy Information Administration, Department of Energy


27 Existing and Proposed LNG Terminals Source: Federal Energy Regulatory Commission
28 Background on LNG
29 Properties of LNG Liquefied natural gas (LNG) is natural gas that has been turned into a liquid by cooling it to a temperature of -256 F It consists of primarily methane (typically, at least 90 percent) LNG is odorless, colorless, non-corrosive and non-toxic Liquefying natural gas reduces its volume by a factor of 610. The weight of LNG is 45 percent of that of water
30 Natural Gas Reserves by Country (2004) Considerable reserves around the world just not in the areas where the gas is needed Rest of World 22% Total World Reserves of 6,806 Tcf Russia 28% Iraq 2% Venezuela 2% Nigeria 3% Algeria 3% United States 3% United Arab Emirates 3% Saudi Arabia 4% Source: Energy Information Administration, Department of Energy Qatar 15% Iran 15%


31 Economic Sharing in the LNG Chain Regasification terminals are one small portion of the development of an overall LNG project Gas Producer $0.5 to $1.0 billion $ $1.00 / MMBtu 23% of total cost Liquefaction $0.8 to $1.0 billion $ $1.00 / MMBtu 28% of total cost Shipping* $0.6 to $1.2 billion $ $1.60 / MMBtu 35% of total cost Receiving Terminal $300-$400 million $ $0.50 / MMBtu 14% of total cost Cost out of Plant Total Investment: $2.2 to $3.6 billion $2.50 $3.50 / MMBtu Note: *depends upon the distance shipped Source: Cheniere LNG Industry Profile,
 OR to fuel over 20 percent of Georgia's industrial plants for 1month Assumptions: - One 1 LNG tanker")

32 LNG Schematic: Production to End-User to fuel over 70 percent of Georgia s natural gas fueled electric power plants for 1 month OR to fuel over 2 percent of Georgia s residential customers for 1 year (over 38,000 customers) OR to fuel over 20 percent of Georgia's industrial plants for 1month Assumptions: - One 1 LNG tanker carries approximately 125,000 to 138,000 cubic meters of LNG, which will provide about 2.6 to 2.8 bcf of natural gas - Average monthly power usage of 3.8 bcf; - Average monthly industrial usage of 4.24 MMcf Source: Energy Information Administration; Federal Energy Regulatory Commission; IELE, University of Houston; and Statoil.com.

33 Receiving Terminal LNG Gas Flow LNG Ship to Tanks Natural Gas LNG Tanks to Vaporizers Boiloff Compressors As LNG boils off, the gas is withdrawn from the tanks and compressed. Tank 1 Tank 2 Tank 3 As gas is required, pumps inside the tanks transfer LNG to the plant vaporizers. The plant vaporizers warm the LNG until it vaporizes. Gas Pipeline
34 LNG Importers and Facilities
35 US LNG Facilities A number of small LNG facilities throughout the US are used for peak shaving or to meet the needs very areas isolated from storage and/or pipeline infrastructure Everett Cove Point Elba Island Marine Terminal Import (4) Storage (with liquefaction) (57) Storage (without liquefaction) (39) Stranded Utility (3) Vehicular Fuel (2) Nitrogen rejection unit or other special processing (5) Lake Charles Stranded Utility: A stranded local utility system is typically very small and too far from the pipeline grid to be economically connected. Nitrogen Rejection Unit: At NRU facilities, the entire gas stream is liquefied to remove impurities then regasified and sent on as pipeline-quality gas. Source: Energy Information Administration, Department of Energy.
36 US Imports as a Percent of Total Consumption 25% 3.5% Pipeline Imports Percent of Total Consumption (pipeline and total imports) 20% 15% 10% 5% Total Imports LNG Imports LNG imports have increased over 660 percent since 1998 and 185 percent since % 2.5% 2.0% 1.5% 1.0% Percent of Total Consumption (LNG) 0.5% 0% % Source: Energy Information Administration, Department of Energy.
37 Current US LNG Import Terminals Lake Charles, Louisiana 6.3 Bcf Storage Capacity Regasification Capacity: Peak: 1.2 Bcf per day Baseload: 1 Bcf per day Everett, Massachusetts 3.5 Bcf Storage Capacity Regasification Capacity: Peak: 885 MMcf per day Baseload: 710 MMcf per day Cove Point, Maryland 7.8 Bcf Storage Capacity Regasification Capacity: Peak: 1 Bcf per day Baseload: 750 MMcf per day Gulf Gateway Energy Bridge No Storage Capacity Regasification Capacity: Peak & Baseload: 500 MMcf per day Elba Island, Georgia 7.3 Bcf Storage Capacity Regasification Capacity: Peak: 1.2 Bcf per day Baseload: 1 Bcf per day Source: Energy Information Administration, Department of Energy
38 World Importers of LNG: Imports as Percent of Total Natural Gas Consumption (2003) U. S. 3% Italy 9% Turkey 22% Puerto Rico Greece 23% 100% Mexico 0.02% Belgium 22% France 21% Spain 63% Portugal 18% Japan 92 % S. Korea 100 % Taiwan 86% Central and South America 1% Source: Energy Information Administration, Department of Energy
39 Importance of LNG on Future US Supply Disposition
40 Natural Gas Production, Consumption and Imports ( ) 30 DOE forecasts that LNG will be an important component of our natural gas supplies Historic Projected 25 Consumption Net Imports 20 Tcf 15 Production 5 Natural Gas Net Imports, 2005, 2015, Tcf Pipeline Imports LNG Imports Source: Energy Information Administration, Department of Energy
41 Natural Gas Spot Price and Chemical Industry Employment $10.0 As gas prices go up, chemical industry employment goes down 1,050 $9.0 $8.0 1, Henry Hub Price ($/Mcf) $7.0 $6.0 $5.0 $4.0 $ Thousand Employees $ $1.0 $0.0 Henry Hub Spot Price Chemical Industry Employment Source: Bureau of Labor Statistics, US Department of Labor; and Federal Reserve Bank of St. Louis
42 Value of Net Exports of NAICS 325 Chemicals $25 In 2002 the US became a net importer of chemicals $20 $15 Trillion $ $10 $5 $ $5 -$10 Source: Office of Trade and Economic Analysis, Trade Development, International Trade Administration, U.S. Department of Commerce
43 World Natural Gas Prices for Industry ($US/MMBtu) Industries may be forced to other countries where natural gas can be considerably cheaper U. S. $5.32 Mexico $4.12 Cuba $3.34 Venezuela $0.65 Argentina $1.09 Netherlands $4.25 Slovakia $3.35 W. Europe $4.12 N. Africa $0.40 S. Africa $5.36 Middle East $0. 60 Russia $0.80 China $6.85 Indonesia $1.13 Australia $3.42 Source: Energy Information Administration

44 U.S. and Canadian Natural Gas Supply LNG provides 14% of the U.S. supply of natural gas by Source: National Petroleum Council
45 Planned LNG Capacity Additions and Expansions Sendout Capacity (Bcf/d) Proposed - Potential Sites Proposed - Under Review Approved Existing Capacity Note: New capacity includes terminals that have been approved, or are pending approval. Source: FERC and various tradepress and company websites
46 Price and Usage Outlook
47 Forecast for Energy Commodity Prices Natural Gas Futures Post Storm-Winter Significant futures prices for winter natural gas post-hurricane $16 $ Actual Futures $12 $10 $ per Mcf $8 $6 $4 $2 $0 Nov Dec Jan Feb Mar Apr May Jun Jul Aug Sep Oct Note: Prices recorded on October 11, 2005 Source: Federal Reserve Bank of St. Louis; and Nymex.com
48 Forecast for Energy Commodity Prices Natural Gas Futures Prices have moderated significantly due to mild winter and strong storage position $16 $ Actual Futures $12 $10 $ per Mcf $8 $6 $4 $2 $0 Apr May Jun Jul Aug Sep Oct Nov Dec Jan Feb Mar Note: Futures prices recorded on February 27, 2006 Source: Federal Reserve Bank of St. Louis; and Nymex.com
49 Weekly Natural Gas Injections Relative to Prior Year and 5-Year Average What impact have high prices had on industrial activity? Net Injection 2004 Net Injection 5-Year Average Net Injection Big surges indicate Industrial demand destruction? 80 bcf Weeks (Injection Season Starts in April) Source: Energy Information Administration, Department of Energy
50 Weekly Natural Gas Withdrawals Relative to Prior Year and 5-Year Average Withdrawals 2004 Withdrawals 5-Year Average Withdrawals 150 bcf Weeks (Withdrawal Season Starts in November) Source: Energy Information Administration, Department of Energy
51 Petroleum and Coal Products Refineries Jan-86 Jan-87 Production Index Jan-88 Jan-89 Jan-90 Jan-91 Jan-92 Jan-93 Jan-94 Jan-95 Jan-96 Jan-97 Jan-98 Jan-99 Jan-00 Jan-01 Jan-02 Jan-03 Jan-04 Jan-05 Jan-06 Center for Petrochemical and Refinery Industrial Production Indices Hurricane-related or price-related demand destruction?
52 Industrial Production Index Appears to be strong post-hurricane rebound in industrial activity After correction, industry (overall) has been increasing despite increases in natural gas prices since $14 $12 Production Index $10 $8 $6 $4 Henry Hub Price ($/Mcf) $2 90 Jan-01 Jul-01 Jan-02 Jul-02 Jan-03 Jul-03 Jan-04 Jul-04 Jan-05 Jul-05 Jan-06 $0
53 Industrial Production Indices Energy Intensive Industries 130 Subsector analysis shows that since correction, energy intensive sectors have all been flat to increasing Production Indices Food, Beverage and Tobacco Chemical sector increases Paper 70 despite high prices Petroleum and Coal Products Chemicals Primary Metal 60 Jan-98 Jan-99 Jan-00 Jan-01 Jan-02 Jan-03 Jan-04 Jan-05 Jan-06 Source: Federal Reserve
54 800 Decrease in Industrial Gas Consumption Industrial Natural Gas Usage and Industrial Activity: Demand Destruction or Fuel Switching? Pick up in production activity Industrial Consumption (Bcf) Change in Index 300 Industrial Consumption Change in Industrial Production Index 200 Jan-01 Jul-01 Jan-02 Jul-02 Jan-03 Jul-03 Jan-04 Jul-04 Jan-05 Jul
55 Power Generation Natural Gas Usage Electric Power Consumption (Bcf) Gas-fired generation becoming important source of winter gas demand 2005 has been big year for gas-fired power generation Jan Feb Mar Apr May Jun Jul Aug Sep Oct Nov Dec

56 2006 Summer Forecast by Region Source: 2006 Almanac
57 Dr. William Gray s December Hurricane Forecasts - Colorado State University December Named Total Major First Forecast Storms Hurricanes Hurricanes Source: Scoreboard Analysts Pull Back Forecasts as Gas Surplus Mounts, Natural Gas Week, January 30, 2006.
58 Natural Gas Week Scoreboard Company 4Q 2005 FY Q Q 2006 FY 2006 FY 2007 Raymond James $ $ 7.90 $ $ 9.75 $ $ RBC Capital Markets $ $ 8.07 UBS $ $ 8.60 $ 9.42 $ 8.50 $ 9.50 Morgan Stanley $ $ 8.50 $ $ 7.75 $ 8.50 $ 7.00 Buckingham Research Group $ $ 8.00 $ 7.00 $ 7.00 $ 7.00 Weeden & Co $ $ 8.75 $ $ RW Beck $ $ 8.37 $ $ 8.59 $ 9.00 $ 7.38 Jofree Energy Consulting $ $ 8.51 $ 8.91 $ 8.67 $ 9.21 $ 9.66 Prudential Securities $ $ 8.30 $ $ $ 9.75 The Gerdes Group $ 9.50 $ 7.00 $ 7.88 $ 8.00 Purvin & Gertz $ $ 8.35 $ 8.60 $ 9.10 $ 9.05 $ 8.35 Bear Sterns $ $ 7.98 $ $ 8.00 $ 8.90 $ 8.25 Merrill Lynch Global Securities $ $ 7.75 $ 9.00 $ 6.70 $ 6.75 $ 6.25 First Energy Capital $ $ 8.75 $ $ 9.75 $ $ 9.00 Petral Consulting $ $ 8.25 $ 7.20 $ 6.25 $ 7.00 $ 7.00 Banc of America Securities $ $ 8.45 $ 9.00 $ 7.25 $ 7.75 $ 7.00 Gelber Corp. $ $ $ 9.80 $ 7.86 Deutsche Bank Alex Brown $ $ 8.75 $ $ $ 9.00 $ 7.00 Stephen Smith Energy Associates $ $ 8.70 $ 9.10 $ 7.20 $ 8.25 $ 7.80 JPMorgan Chase $ $ 9.11 $ 9.10 $ 8.25 $ 9.00 $ 7.75 Energy Ventures Analysis $ $ 9.01 $ 8.89 $ 8.26 $ 8.52 $ 7.39 Credit Suisse $ 8.00 $ 7.50 $ 7.75 $ 6.50 US Energy Information Administration $ $ 8.88 $ $ 8.71 $ 8.98 $ 8.06 Average $ $ 8.45 $ 9.64 $ 8.35 $ 8.77 $ 8.01 Source: Scoreboard Analysts Pull Back Forecasts as Gas Surplus Mounts, Natural Gas Week, January 30, 2006.
59 Economic Outlook Short Run Impacts (Current to June, 2006) Mild winter has resulted in lower than anticipated demand. Economy generally strong running into this crisis and momentum will continue to carry. Continued mild weather will have bearish impact on natural gas prices through spring. Geopolitical concerns will drive crude (slight downward tendency). Attention to tropical season on both crude and natural gas. Longer Run Impacts: (6 months and beyond) Tropical activity could be concern (cyclical shift in weather trends) High prices are bad for energy sensitive industries will eventually show up in trade deficit numbers (chemicals, refining, and paper and pulp). Imports for energy (crude, natural gas) will pick up and have impacts on trade deficit. Potential crash in energy prices in future versus treadmill effect created by more hurricane activity (global warming vs 20-year cycle) global economic activity will decided where we go.
60 Questions, Comments, & Discussion
61 Examples of Energy Infrastructure Damage

62 Shell Mars Tension Leg Platform Source: Shell.com
63 Shell Mars Tension Leg Platform Source: Shell.com

64 Ocean Warwick Dauphin Island, AL Source: Rigzone.com

65 Semi-Sub Stuck Under Bridge North Mobile Bay Source: Rigzone.com

66 Venice Port, Supply & Crew Bases Source: LIOGA

67 Chevron Refinery Pascagoula, MS Source: Chevron
 Source: Air")
68 Air Products Facility Normal Day New Orleans, Louisiana (Intracoastal Drive) Source: Air Products

69 Air Products Facility During Hurricane Katrina New Orleans, Louisiana Source: Air Products

70 Air Products Facility Post Hurricane Katrina New Orleans, Louisiana Source: Air Products

71 Power Outages Generating Stations Entergy Patterson Source: Entergy

72 Power Outages Substation Damage Source: Entergy
73 Then, Along Comes Rita

74 Henry Hub, September 25, 2005 Source: LIOGA
75 Entergy Transmission Source: Entergy.com


76 Citgo Refinery Storage Tank Lake Charles, Louisiana Post-Rita Source: Citgo

77 Citgo Refinery Onsite Dock Lake Charles, Louisiana Post-Rita Source: Citgo

78 Citgo Refinery Cooling Tower Lake Charles, Louisiana Post-Rita Source: Citgo


79 Citgo Refinery Tent City Lake Charles, Louisiana Post-Rita Facility rental of $3.5 million for 3 weeks for 250 employees roughly $156 per day per person Source: Citgo


80 Natural Gas Pipeline Leak Source: MMS


81 Chevron Typhoon TLP Source: Chevron, Rigzone.com