Mapping emissions from residential wood combustion in Denmark
|
|
|
- Madeleine Dorsey
- 5 years ago
- Views:
Transcription
1 Mapping emissions from residential wood combustion in Denmark Real-world emissions from residential wood combustion Copenhagen Marlene Plejdrup & Ole-Kenneth Nielsen Department of Environmental Science Aarhus University
2 Outline Introduction Emission calculation methodology for RWC Wood consumption Appliance stock Emission factors Mapping of emissions from RWC Distribution key Uncertainties
3 Introduction (1) DCE, AU is responsible for preparing the national inventory of emissions to air in accordance with international obligations The national emission inventories are reported annually to EU and UN The national emission inventory covers 5 sectors: Energy Industrial processes Agriculture Land use Waste Energy covers all combustion, including residential wood combustion (RWC) in stoves and boilers
4 Introduction (2) RWC is a major source to air pollution in Denmark Especially for PM, dioxin and PAH, but also for some metals The inventories are subject to large uncertainties Share of national emission in 2013 Share of national emission in 2013 SO 2 2,5 % As 4,1 % NO x 1,9 % Cd 69,8 % NMVOC 9,2 % Cr 48,3 % CH 4 1,3 % Cu 2,9 % CO 22,9 % Hg 4,9 % PM ,1 % Pb 7,3 % HCB 5,7 % Zn 28,6 % PCDD/F 49,7 % PAH 66,5 %
5 Emission calculation methodology for RWC Denmark is obligated to follow international guidelines for calculation and reporting of emissions EMEP/EEA 2013 Guidebook IPCC 2006 Guidelines It is recommended to use well-documented national data if available Emission calculation methodology Emission = wood consumption * emission factor
6 Wood consumption Emissions calculations are based on the wood consumption included in the official national energy statistics published annually by the Danish energy agency (DEA) DEA carries out biennial surveys of RWC which form the basis for the statistics Denmark is obligated to use the national energy statistics for the national emission inventory In 2013 wood consumption in households was 21.9 PJ wood and 9.2 PJ wood pellets, corresponding approximately 1.4 mio. tonnes and 0.6 mio. tonnes
7 Appliance stock The inventory include 4 types of wood stoves, fireplaces, 4 types of wood boilers, and wood pellet boilers In 2015 the categories will be adjusted to take into account the updated wood stove act It is assumed that Denmark has wood stoves ~ fireplaces, and ~ wood boilers
8 BOILERS STOVES Marlene Plejdrup & Ole-Kenneth Nielsen Appliance stock in 2013 Stock in 2013 Wood consumption TJ Old stove Stove pre New stove Stove with DS mark Modern stove Stove conforming with Danish legislation (2008) Eco labelled / new advanced stove Other stove Fireplaces etc Old boilers with accumulation tank pre Old boilers without accumulation tank New boilers with accumulation tank post New boilers without accumulation tank Pellet boilers/stoves 9.185
9 Emission factors Emission factors (EF) are associated with large uncertainties and mainly based on international guidelines (EMEP/EEA) Most EFs decrease for newer technologies Emission factor (g/gj) NO x NMVOC CH 4 CO PM 2.5 BC PCDD/F Benzo(a) pyrene Old stove New stove Modern stove Eco labelled / new advanced stove Other stove Old boilers with accumulation tank Old boilers without accumulation tank New boilers with accumulation tank New boilers without accumulation tank Pellet boilers/stoves
10 Wood consumption and PM 2.5 emission
11 Mapping of emissions from RWC (1) Denmark is obligated to report the national emissions of air pollution, spatially distributed on a grid with a resolution of 50km x 50km From 2017 the resolution is increased to 0.1 x0.1 (~10km x10 km) Gridded emissions of high resolution (1km x 1 km) has been prepared for Denmark since 2010 The gridded emissions is used as input in air quality modelling The gridding methodology is continuously improved as new spatial data become available
12 Mapping of emissions from RWC (2) Based on the Building and dwelling register (BBR), a distribution key is prepared for mapping of RWC emissions The distribution key include the share of the national total emission to be allocated to each 1km x 1km grid cell
13 Distribution key Addresses with RWC is identified based on Building type Heating installation Fuel Supplementary heating Weighting factors are applied for Primary vs. supplementary RWC Stoves vs. boilers Building types Primary RWC Supplementary RWC Technology Building group Weighting factor Stove Single-family house 0.8 Stove Holiday house 0.2 Stove Apartment building 0.8 Boiler Single-family house 1 Boiler Holiday house 0.8 Boiler Apartment building 1 Stove Single-family house 0.4 Stove Holiday house 0.2 Stove Apartment building 0.08

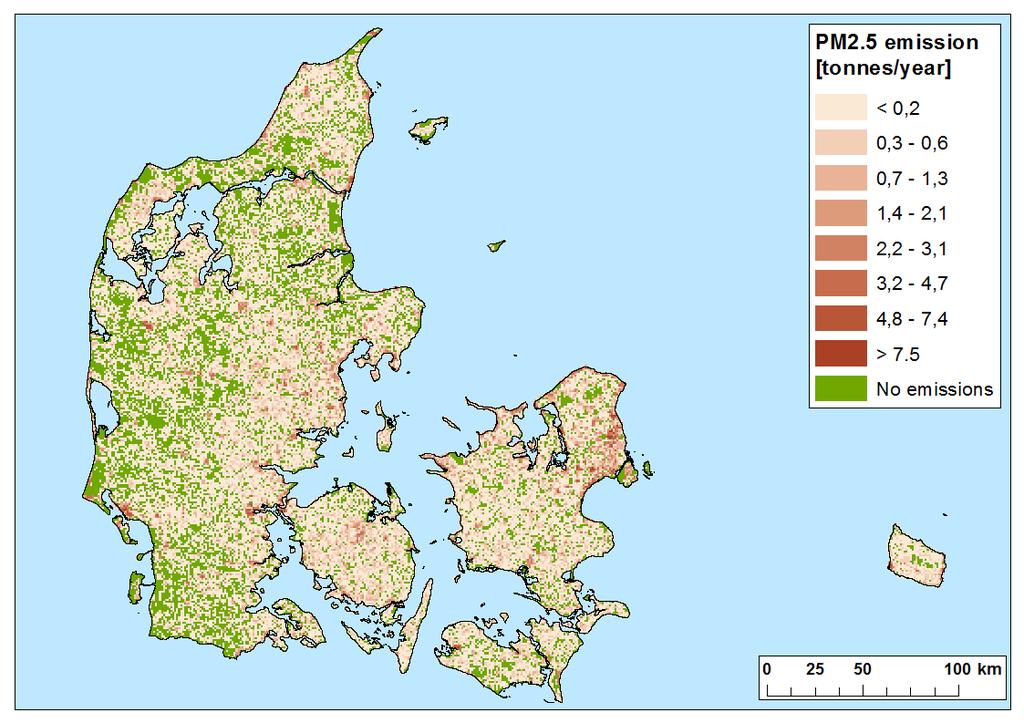
14 Gridded PM 2.5 emissions
15 Uncertainties Mapping is associated with large uncertainties Errors in registrations in BBR Number of appliances in Denmark Location of appliances No information on technology and age of appliances No information on wood consumption per appliance Fuels (wood, wet, waste etc.) User behaviour (top-down, insufficient air supply etc.) Annual variations (temperature, new occupants etc.)
16 Summary Large uncertainties on all parameters Regardless of effort RWC will always be an activity with significant uncertainties A considerable improvement would be a national register based on information from the chimney sweepers Would reduce the uncertainty of total number, age distribution, and location of stoves and boilers
17 Thank you for your attention