Stora Enso investor kit
|
|
|
- Meagan Atkinson
- 5 years ago
- Views:
Transcription
1 investor kit strategy and market environment, and financial performance
2 Disclaimer It should be noted that and its business are exposed to various risks and uncertainties and certain statements herein which are not historical facts, including, without limitation those regarding expectations for market growth and developments; expectations for growth and profitability; and statements preceded by believes, expects, anticipates, foresees, or similar expressions, are forward-looking statements. Since these statements are based on current plans, estimates and projections, they involve risks and uncertainties which may cause actual results to materially differ from those expressed in such forward-looking statements. Such factors include, but are not limited to: (1) operating factors such as continued success of manufacturing activities and the achievement of efficiencies therein, continued success of product development, acceptance of new products or services by the group s targeted customers, success of the existing and future collaboration arrangements, changes in business strategy or development plans or targets, changes in the degree of protection created by the group s patents and other intellectual property rights, the availability of capital on acceptable terms; (2) industry conditions, such as strength of product demand, intensity of competition, prevailing and future global market prices for the group s products and the pricing pressures thereto, price fluctuations in raw materials, financial condition of the customers and the competitors of the group, the potential introduction of competing products and technologies by competitors; and (3) general economic conditions, such as rates of economic growth in the group s principal geographic markets or fluctuations in exchange and interest rates. All statements are based on management s best assumptions and beliefs in light of the information currently available to it and assumes no obligation to publicly update or revise any forward-looking statement except to the extent legally required. 2


3 Content SECTION 1: STRATEGY SECTION 2: BUSINESSES SECTION 3: INNOVATIONS SECTION 4: FINANCIALS & GOVERNANCE SECTION 5: LATEST INTERIM REPORT Introduction Strategy Strategic targets Bioeconomy Forest assets Businesses and capacities Markets Innovation in packaging Innovation in Biomaterials Innovation in Wood Products Financial performance Balance sheet strength Cost structure Capital expenditure Dividend policy Ownership structure Management & the Board ADR programme 3

4 in brief Leading global provider of renewable solutions in packaging, biomaterials, wooden constructions and paper Sales EUR 10.0 billion in 2017 Operational EBIT EUR million in 2017 shares are listed on NASDAQ OMX Helsinki and Stockholm. In addition, the shares are traded in the USA as ADRs Some employees in 30 countries 4


5 Progress in a few snapshots Beihai Mill reached EBITDA break-even in Q4/2017 Transformation is nearly completed 8.5% Sales growth from previous year excluding the paper business 1.4 Net debt/ EBITDA further strengthened balance sheet EUR 0.41 Dividend 14.3% Operational ROCE excluding Beihai operations Varkaus kraftliner reached its designed capacity level in Q4/2017 5


6 Majority of the portfolio is aimed at growth group 2017: Sales MEUR / Operational EBIT MEUR / Operational ROCE 11.9% / Operational ROCE excluding Beihai 14.3% + Consumer Board Expansion of relative market share in profitable niches + Packaging Solutions Selective profitable growth Biomaterials Strengthening current business and creating new profitable growth Wood Products Accelerating growth Paper Strategy for maximum cash generation 6
7 We are well-positioned for profitable growth strength of our portfolio Sales 2017 EUR and % of group s sales Market growth Position Consumer Board BEUR 25% for virgin board: Europe 1.8%, North America 1.2%, Latin America 3.3%, China 4.3%, Rest of Asia 3.4%, Africa 2.5% #1 in LPB, FSB and CUK in Europe or the world Packaging Solutions BEUR 12% High quality SC fluting 1-3%; Kraftliner 2 3% excl. North Am; Testliner 3 4% Eastern Europe #6 in containerboard in Europe Biomaterials BEUR 15% Market pulp 2.3%; Fastest growth in tissue (3.2%) Widest pulp grades portfolio #1 in Europe in fluff + Wood 17% Global sawn softwood 2 3%, 1.7 BEUR Products European new construction 3.5% - 29% Paper 2.9 BEUR Declining 3 5% annually #2 in Europe #1 in Europe and #4 in the world in supplying wooden construction material 7


8 Our road to success in the bioeconomy Introducing Addressing Delivering Generating xxxx xxxx new products xxxx superior xxxx and services ROCE attractive end-use segments sustainable profitable growth 8
9 Our transformation strategy continues delivering sustainable profitable growth Innovation Focus on biobased materials and chemicals, digitalisation, intelligent packaging and new packaging solutions. Customer insight Developing offerings according to customers requirements to create value and growth, with sales excellence. Sustainable profitable growth Motivated employees Focus on inspiring leadership, good communication, performance management and target setting. Structured processes Clear roles and responsibilities, standardised and harmonised working methods, operational excellence. Dividend To distribute 50% of EPS over the cycle CAGR 11% Strategic growth investments Capex at or below depreciation and depletion* over the business cycle Cash flow from operations Strong balance sheet Net debt to operational EBITDA target reduced from 3x to <2x Sustainable profitable growth Business and CAPEX driven by ROCE 9 *Operational decrease in the value of biological assets
10 Profitable growth Improving sales and innovation Montes del Plata Mill investment Beihai Mill investment Varkaus Mill conversion Murów sawmill investment Varkaus LVL investment Imatra de-bottlenecking Sunila bio-refinery Innovation Centre Helsinki Innovation Centre Stockholm NXP JDA Launch of first MFC product Intelligent packaging Launches of: Performa Brilliance by CKB Nude by Natura Life by Fibre Cup Multicopy Zero by FlyoBrite by Bio-based lignin Lineo by Biocomposites - DuraSense by Product & Sales Management, S&OP, CRM Accelerator programme Asset transformation Innovation & customer focus 10
11 Developing further in the bioeconomy PRODUCT / TECHNOLOGY CUSTOMER USE EXAMPLES R&D PILOTING SCALING FULLY ADOPTED BY MARKETS ADOPTED BY MARKETS 1. BIO-BASED CHEMICALS INDUSTRIAL INTERMEDIATES Lignin Xylose Biomass polymers Dissolving pulp Modified fibres Replace phenol Sweetener, personal care Replace oil-based plastic Textiles, packaging Performance chemicals REPLACING FOSSIL MATERIALS IN PRODUCTS 2. ENABLING 3. INNOVATIONS OF NEW CONSUMER EXPERIENCES 11 Micro-fibrillated cellulose (MFC) Biocomposites Lignin carbon fibre Building systems Modified wood Nano cellulose Digitalisation Biobarriers in food cartons Light-weight board Strengthening liner Compounding wood fibre with polymers Lightweight structures, energy storage, transportation High rise buildings Cladding, decking Transparent / electronic programmable / foam / spheres Material with in-built monitoring and tracking capabilities for intelligent packaging


12 These are our drivers for accelerating renewable growth In % of our sales came from new products and services High-quality containerboards Value added services in corrugated packaging Intelligent packaging Building components and systems Bio barriers Long-term target 15% of our sales is expected to come from new products and services Biocomposites Next generation liquid and food packaging Future bio-based chemicals 12
13 Strategic targets in good progress still more potential Group strategic targets Q3 17 Q3 18 Dividend To distribute 50% of EPS over the cycle Growth* To grow faster than the relevant market 11.1% (YoY) 3.6% (YoY)** Net debt to operational EBITDA <2.0x Fixed costs to sales <20% 23.8% 23.3% Debt to equity <60% 43% 34% Operational ROCE >13% 13.9% 16.7% Divisional strategic targets Q3 17 Q3 18 Consumer Board Operational ROOC > 20% 17.7% 10.3% Packaging Solutions Operational ROOC > 20% 22.4% 30.4% Biomaterials Operational ROOC > 15% 14.8% 20.9% Wood Products Operational ROOC > 20% 21.3% 31.6% Paper Cash flow after investing activities to sales > 7% 0.8% 8.3% * Excluding Paper ** Excluding Paper and Puumerkki 13
14 Capacities by grade Grade Capacity t Consumer Board Containerboards Corrugated Packaging (Mm 2 ) Grade Capacity t Newsprint Uncoated Magazine (SC) Sawn goods 5.6 Mm3 Coated Magazine 250 Total Magazine Paper Short-fibre pulp 900 Long-fibre pulp 600 Fluff pulp 250 Dissolving pulp 150 Unbleached kraft pulp 50 Net market pulp Coated Fine Uncoated Fine Total Fine Paper Paper Total

15 Global position capacity and biological asset allocation Board capacity by country 2018 Paper capacity by country 2018 Chemical Pulp capacity by country 2017 Finland 49% Finland 43% Finland 54% Finland 17% Finland 30% Biological assets by country as at Dec 2017 Total assets by country as at Dec 2017 Sweden 28% Sweden 28% Sweden 22% Sweden 70% Sweden 23% Poland 5% Poland 2% Poland 14% Germany 16% Germany 3% Brazil 4% Brazil 3% Brazil 10% China 9% China China 3% 3% China China 10% 5% China 11% Other countries 10% Other countries 10% Uruguay 14% Uruguay 5% Uruguay 12% 15
16 We are perfectly positioned to benefit from the megatrends Global warming Growing middle class Eco awareness Changing lifestyles Increasing demand for raw material that is renewable, reusable and fossil free Urbanisation Growing population Digitalisation 16


17 The renewable materials growth company Everything that s made with fossil-based materials today can be made from a tree tomorrow 17

18 Bioeconomy 100 % utilised renewable raw material The smallest pieces of wood are used to make particleboard and chipboard, or can be used as biofuel. Small trunk parts are used to make paper and paperboard. We are innovating to develop tomorrow s products made of tree Thicker parts of the trunk are sawn. Sawmill by-products are used to make paper and particle board. 30% of the wood can be used for sawn products. 70% for pulp and paper. 18
19 MEUR Forests are a strategic asset for the future Biological assets Dec 2017 Biological assets 3.3 BEUR SCA 3.2 BEUR Holmen 1.8 BEUR UPM 1.6 BEUR Klabin 1.0 BEUR SCA Holmen UPM Klabin Exchange rates, European central bank 31 Dec 2017 SEK/EUR BRL/EUR
 (54) (48) (51) (48) Finland 20.8 13.5 Brazil 3.4 2.0 Uruguay 7.6 2.3 China 5.1 0.")
20 We control ~30% of our wood raw material a critical advantage in the bioeconomy s forest assets* Pulpwood plantation availability and wood cost (36) (49) (30) (40) (56) (71) million m 3 sub Standing stock Annual procurement Sweden (30) (54) (48) (51) (48) Finland Brazil Uruguay China Potential for wood supply expansion Wood supply restrictions for expansion ( ) Wood cost (USD/m3/sob) at mill - hardwood Consumption, million m 3 sub (solid under bark) Supply from own sources based on ownership, % Long-term supply contracts, % Purchased, % Sold externally of annual harvesting, % 20 * Sweden includes s share of Bergvik Skog and Finland s share of Tornator. Brazil and Uruguay with 50% share.
 Tornator, Finland 600 000 ha of land in Finland, 60 000 ha in Estonia, and 12 000 ha in Romania (ownership 41%) Guangxi, Southern China (leased) 83")
21 Forest assets Northern and Southern hemisphere Fair value of 3.3 BEUR forest areas as Bergvik Skog, Sweden 2.3 million ha of land in Sweden, (ownership of 50%) Tornator, Finland ha of land in Finland, ha in Estonia, and ha in Romania (ownership 41%) Guangxi, Southern China (leased) ha of land of which ha planted Note: Fair value of Biological assets and Group s indirect share of forest assets is as of 31 Dec 2017, in total MEUR 21 Veracel plantations, Brazil ha of land of which ha eucalyptus plantations (ownership of 50%) Montes del Plata, Uruguay ha of land of which ha planted (ownership of 50%) In addition, leased plantations: - Laos: trial plantation, ha - Russia: ha

22 to acquire forest assets of Bergvik Skog Binding agreement signed, transaction to be completed in H To secure our competitive raw material supply in the long term would transform 50% ownership to approximately 70% of the value of the forest assets in Bergvik Väst Financial impacts estimate for Bergvik Väst consolidated as a subsidiary Cash out effect of 200 MEUR Debt would increase by 800 MEUR Net debt to operational EBITDA ratio would increase by 0.5 Capital employed would increase by 1 BEUR resulting a decrease in ROCE of 1%-point 22
23 Direct ownership of the forests in Sweden Unit s 49% holding of Bergvik Skog in Sweden s Swedish forests after transaction Ha (gross land) Ha ( 000) Ha (productive forest) Ha ( 000) Forest cubic meters (m 3 fo) m 3 fo (million) Forest cubic meters / ha (productive f) m 3 fo/ha IFRS value* (Bio Assets + Land) MEUR IFRS value*/ha (productive forest) EUR/ha IFRS value*/m 3 fo EUR/m 3 fo Values calculated with LRF Konsult s statistics** Unit s 49% holding of Bergvik Skog in Sweden s Swedish forests after transaction Value/m 3 fo EUR/m 3 fo Value of the timber (m 3 fo) MEUR * IFRS Value based on 31 Dec 2017 valuation. **LRF Konsult s market statistics for forest property prices. These reference prices are applicable for small-size lands. Calculation for is referential and based on LRF s price for Mellersta (445 SEK/m 3 fo) and applied for all properties. FX rate of (European central bank, 31 Dec 2017) applied to all SEK currencies. 23


24 Group 2013 Q1-Q3/2018 Note: * Excluding paper and Barcelona Mill. 24


25 Financial performance - divisions Sales, EBITDA margins, EBIT margins and ROOC Sales Operational EBIT margin Operational EBITDA margin Operational ROOC, 4Q rolling 25
26 Our formula for success continues Sustainable profitable growth 4 6%* Strong cash flow generation Capex ~3 BEUR** Dividend ~50% of EPS Net debt to operational EBITDA <2.0x Debt to equity <60% * Excluding Paper ** Next five years 26


27 We have several attractive profitable growth options 27
28 Divisions

29 Consumer Board The ambition of the Consumer Board division is to be the global benchmark in high-quality virgin fibre cartonboard and the preferred partner to customers and brand owners in the premium enduse packaging and graphical segments A wide board and barrier coating selection suitable for the design and optimisation of packaging for liquid, food, pharmaceutical and luxury goods Serves converters and brand owners globally Expanding in growth markets to meet rising demand for high-quality, functional and safe packaging 29


30 Consumer Board geared towards growth Divisional strategic target Q3/17 Q3/18 Consumer Board Operational ROOC > 20% 17.7% 10.3% Sample product categories Liquid Packaging: Natura Food Service Board: Cupforma, Tamfold General Packaging and graphical board: CKB, Trayforma, Performa, Ensocoat, Tambrite Chocolate and confectionary Cosmetics and luxury Pharmaceuticals Food Packaging Drinks, wines and spirits Cigarette board: Koppar Speciality paper: Lumiflex, LumiLabel Main competitors include BillerudKorsnäs, Metsä Board, Klabin and International Paper 30


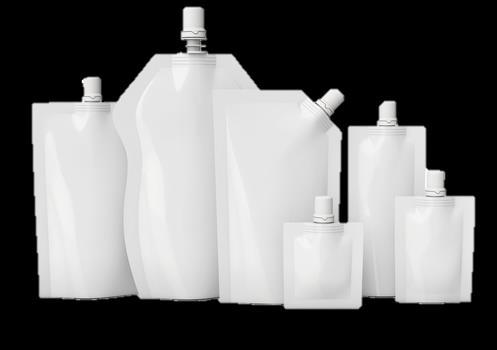


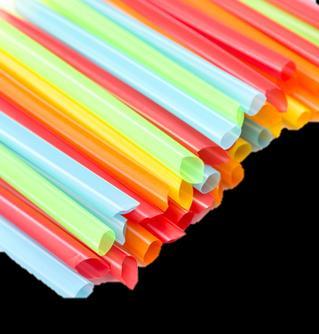

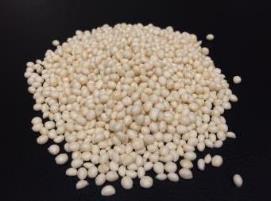
31 BIOCOMPOSITES BIO-BARRIERS AND FILMS Our target is 25% of sales from new products and services REPLACING PE-FILMS IN CUPS POUCHES FOR LOW TO MEDIUM SHELF LIFE LIDS REPLACING ALUMINIUM FOIL POUCHES WITH HIGH BARRIER PROPERTIES GLOBAL MARKET SIZE ~80 BEUR STRAWS CAPS, CLOSURES & PACKAGING COMPONENTS RIGID CONTAINERS TRAYS CAPS WITH HINGES TUBES ~25 BEUR Source: SmithersPira, internal analysis 31


32 Geographical exposure Consumer Board Production Facilities Sales Worldwide sales network R&D: Karlstad, Sweden and Imatra, Finland Sweden Fors Mill Sweden Skoghall Mill Finland Imatra Mill Finland Ingerois Mill China Beihai Mill Grade Capacity t Consumer Board
33 2.6% CAGR until 2030 for virgin fibre board grades +1.8% (5.3 mt) +1.2% (6.9 mt) +4.3% (7.3 mt) +3.3% (1.4 mt) +2.5% (0.2 mt) +3.4% (3.3 mt) Virgin fibre board grades: Coated Unbleached Kraft (CUK) Solid Bleached Sulphate (SBS) Liquid Packaging Board (LPB) Folding Box Board (FBB) Food Service Boards (FSB) Source: Pöyry 33
34 We have a strong position with global customers Top 10 customers account for 53% of sales and 60% of EBITDA Market share per product vs. competitors Market position Relative market share CUK SE Europe kt 1 131% SBS SE 1 103% LPB SE 1 110% FBB SE 2 56% CUK SE Global kt 5 13% LPB SE 1 110% SBS SE 7 23% FBB SE 5 29% Coated Unbleached Kraft (CUK), Solid Bleached Sulphate (SBS), Liquid Packaging Board (LPB), Folding Box Board (FBB) SE = Source:, Pöyry 34
35 China demand continues to grow driven by urbanization China urban population Million people % p.a China s packaged food market growth to maintain growth momentum driven by: 573 Urbanization Increasing income Approximately 780 million urban population today; 1 billion urban population by Source: IHS global insights 35

36 China continues to be one of the fastest-growing markets Chinese consumption today matches US in 1920s Nominal Private Consumption (USD, Tn) 18 Middle class and urbanisation driving the change Growth Private Consumption Source: BCG Source: McKinsey, as of Jan

37 Packaging Solutions Packaging Solutions provides fibre-based board materials and corrugated packaging products and services designed for a wide array of applications Our renewable high-end packaging solutions serve leading converters, brand owners, and retailers across multiple industries looking to optimise performance and drive innovation Modern light-weight containerboard offering Vertically integrated board production and converting Customer-centric solutions including design, packaging automation and support Grade Capacity t Containerboards Corrugated Packaging (Mm 2 ) 37


38 Packaging Solutions geared towards growth Packaging Solutions Divisional strategic target Operational ROOC > 20% Q3/17 Q3/ % 30.4% Sample product categories Containerboards: AvantFlute Recycled, AvantFlute SC, AvantKraft, AvantLiner Recycled Corrugated Packaging: Flexo-printed packaging, Offset printed packaging, Protective packaging Main competitors for containerboards include Mondi, Prinzhorn, BillerudKorsnäs and SCA and for corrugated packaging Smurfit Kappa and DS Smith 38


39 Geographical exposure Packaging Solutions Production Facilities Sales Russia Arzamas Balabanovo Lukhovitsy Sweden Jönköping Skene Vikingstad Estonia Tallinn Finland Heinola Kristiinankaupunki Lahti Varkaus Latvia Riga Lithuania Kaunas Poland Lodz Mosina Ostroleka Tychy Beijing Shanghai Dongguan 39


40 We have strong market position and growth in our home packaging markets Europe China Using virgin fibre boards from Beihai and Europe Nordics Nordics 0.7 BEUR 0 1% CAGR #1 107%* Poland & Baltics 1.5 BEUR 3 5% CAGR #2 85%* Corrugated packaging Source: analysis Note: CAGR * Relative market share, measured as a share of largest competitor Russia Russia 1.7 BEUR 3% CAGR #4 62%* China Russia 1.8 BEUR 5 6% CAGR #5 ~20%* Corrugated & consumer packaging 40


 0.")
 1.")
* 1.")
41 Strong position and growth in our home box markets Key box segments: Food Retail Industrial goods E-commerce Consumer electronics Key box markets: Nordics (#1) 0.7 BEUR 1 2% CAGR Poland & Baltics (#2) 1.9 BEUR 3 5% CAGR Russia (#5) 2.4 BEUR 3% CAGR China (#3)* 1.8 BEUR 7% CAGR *Position in rigid box market 41

42 E-commerce is driving growth in packaging E-commerce packaging by materials (Global market value share, 2017) 1% 3% 15% 80% Corrugated packaging growth in E-commerce ~15% CAGR ( ) ~33 BEUR market value globally and ~6 BEUR in Europe in 2021 ~13 BEUR market value added in E-commerce segment globally until 2021 Corrugated Protective mailers Flexibles Cushioning Note: Market values for Global and Europe (Western, Central and Eastern) in ,85 USD/EUR average exchange rate used in calculations. Source: Statista 2018; Smithers Pira Future of e-commerce packaging to
43 Containerboard net balance Testliner. Recycled fluting, tonnes SC Fluting capacity tonnes Kraftliner Capacity tonnes Containerboard Production tonnes Internal consumption tonnes External purchases tonnes Balance ~ tonnes 43
44 Corrugated packaging is also growing in Europe Kraftliner global (mt) Recycled containerboard Europe (mt) Global CAGR 1-2% kt CAGR + 2 % North America Global excl. NA kt CAGR 2-3 % 44 SC Fluting global market size (mt) Source: kt Global CAGR 1 % CAGR 1% Pöyry, Risi, ICCA, analysis North America Global excl. NA Corrugated boxes packaging* (mt) kt CAGR 1-4 % *) Sweden, Finland, Poland, Russia, Baltic

45 Biomaterials Biomaterials offers a wide variety of pulp grades to meet the demands of paper, board, tissue, textile and hygiene product producers End uses: printing and writing papers, specialty papers, graphic papers, packaging paperboards and tissue Fluff pulp primarily used in diapers and hygiene products Dissolving pulp for textiles We also develop new ways to maximise the value extractable from the wood as well as other kinds of lignocellulosic biomasses. The extracted sugars and lignin hold potential for use in a range of applications 45

 and Select (Hardwood).")

46 Biomaterials geared towards growth Divisional strategic target Q3/17 Q3/18 Biomaterials Operational ROOC > 15% 14.8% 20.9% Sample product categories: Paper, packaging and tissue production: Supreme (Softwood), Perform (Hardwood) and Select (Hardwood). Fluff pulp for hygiene products; diapers, and feminine care products: Care Dissolving pulp for viscose fabrics e.g textiles but also fine applications in the food and pharmaceutical industries: Pure By-products: tall oil, turpentine, lignin (adhesive for construction and cosmetics industries) Main competitors include UPM, Metsä Fibre, Södra, Fibria and Suzano 46
47 Biomaterials worldwide Grade Capacity t Short-fibre pulp 900 Long-fibre pulp 600 Fluff pulp 250 Dissolving pulp 150 Net market pulp Skutskär Capacity: 540kt/a Enocell Capacity: 490kt/a Sunila Capacity: 375kt/a Montes del Plata Capacity: 1.4Mt/a, For Mt Veracel Capacity: 1.1Mt/a Shared Ownership (50%) Biomaterials Mills 47
 Paper Specialty: 29 Mt market, growing 2.")
48 Demand for all pulp grades is growing by 2.3% Textiles, nonwovens 107 Mt market, growing 3%/y 6.6 Mt market pulp (dissolving) Carton board 47 Mt market, growing 2.0%/y 5.3 Mt market pulp Hygiene 590 billions of converted unit, growing 3.5%/y 6.2 Mt market pulp (fluff) Paper Specialty: 29 Mt market, growing 2.0%/y 9 Mt market pulp Pulp consumption increase (Mt) Tissue 36 Mt market, growing 3.2%/y 22 Mt market pulp Graphic: 101 Mt market, declining -1.0%/y 17 Mt market pulp Graphic paper Growing segments Digitalisation Urbanisation Growing middle class Global warming Eco awareness Changing lifestyles Growing population 48 Source: Pöyry Consulting Group, Hawkins Wright, Smithers Pira, RISI
49 Balanced market expected in pulp Hardwood and softwood average capacity growth (Mt/year) Mt/y (90% ratios) Mt/y Announced capacity growth : 2.8 Mt (0.56 Mt/year) Cash cost CIF Europe (USD/tonne) Best in class Cash cost by country Solid Not sustainable Pulp (softwood and hardwood) delivered cost Cumulative capacity, thousand tonnes/y Softwood 0.8Mt Source: Hawkins Wright (April 2018) Hardwood 2.0Mt Pulp demand : Mt/year (2.5% CAGR) No new major projects announced 49
50 Megatrends support the demand for virgin pulp in China To 2030: Urbanisation Growing middle class 58% 70% (+200 million people) Changing lifestyles 5 trillion 9.6 trillion (private consumption in USD) Eco awareness From 14 kg to 21 kg per capita consumption / +10 Mt of hardwood and softwood 60% 90% (safe sanitation services) Ban on imported recovered fibre 50 Source: World Bank, UN Global Goals, Morgan Stanley Research, RISI,


51 We continue with our strategic focus areas Maximise value from eucalyptus pulp Continue to improve production efficiency Constantly improve the cost competitiveness of Montes del Plata Differentiate our Nordic pulp business Reduce exposure in softwood Grow in fluff and dissolving pulp Continue to improve production efficiency Innovate on pulp applications with current customers Generate profitable growth from innovation platforms Build and develop strong business on: Improved pulp properties Regenerated cellulose and MFC Lignin Bio-based chemicals Extraction and separation technologies 51

 42% Softwood Hardwood Fluff/dissolving 43%")
52 We are differentiating our pulp mix Maximize value from eucalyptus pulp Today Target % 15% 37% 42% Improve competitiveness of our Nordic mills (Fluff and dissolving) 42% Softwood Hardwood Fluff/dissolving 43% 52
53 Innovation is key for sustainable profitable growth Product platforms 1. Improved pulp properties 2. Regenerated cellulose & MFC 3. Lignin 4. Bio-based chemicals Technology platform for extraction & separation 53
54 Creating value from renewable, reusable and fossil free materials Innovation Platforms Value proposition End markets Time to market Market Potential: Size / value Improved pulp properties Increased material efficiency and performance Specialty papers, hygiene fibre-based packaging Continuous 2.6 Mt / 1.4 BEUR Regenerated cellulose Novel sustainable material from cellulose Textile, and as film material in packaging Mt / 35 BEUR MFC Increased material efficiency and performance Specialty papers, coatings, cosmetics, and as film material in packaging Mt / 1.6 BEUR Lignin Replace fossil-based materials Resins and adhesives Carbon fibre Carbons for energy storage Mt / 1.7 BEUR Bio-based chemicals Replace fossil-based materials for plastics Packaging Mt / 2.5 BEUR 54 Sources: Hawkins Wright, The Fiber Year 2018, EMBS, Smithers Pira, Transparency market research, Price Hanna consultants, Composites Marktbericht, Plastics Insight, experts


55 Wood Products Products Services E-tools Cross Laminated Timber - CLT Laminated Veneer Lumber - LVL Construction beams Panel systems Building Systems Modular systems MySupply Pellet webshop E-business Industrial components Biocomposites Walls, floor, roofs etc. Building Components BIM Digital tools CLT360 Calculatis Classic sawn Classic Planed Pellets Integrated distribution concept 55

56 The wood used removed tonnes of CO 2 from the atmosphere..and it equals annual emissions of over 500 passenger cars. 56 International House Sydney, Australia Photo: LendLease

57 Strong and light without losing flexibility in design Millimetre precision using latest technology 57 Head above Water London, England


")
* Industrial")

 Value added")
58 Wood Products accelerating growth Wood Products Divisional strategic target Operational ROOC > 20% Q3/17 Q3/ % 31.6% Sample product categories: CLT (Cross laminated timber) Construction beams* LVL (Laminated Veneer Lumber)* Industrial components* Classic sawn Pellets* Building Solutions* Main competitors include Schweighofer, SCA and Metsä Wood *) Value added products = Building Components and Systems products 58

59 Our operations well positioned in Europe Wood Products 4 Finland 2 Russia employees Sweden Latvia Estonia Production units 20 EUR 1.7 billion Netherlands Czech Germany 3 Austria 1 Lithuania Poland 5.6 Mm Grade Capacity Sawn goods 5.6 Mm 3 Further processing 2.6 Mm 3 60 Sales CLTto m 3 countries LVL m 3 Pellets t 59 X Number of mills
60 Getting the right log is critical for profitability in Wood Products Customer demand Sawing pattern Log pricing Cutting Purchasing $ Demand flow Material flow 60


61 Biocomposites will generate further growth First time a truly cost-competitive material compared to general purpose plastics Revenue creation from totally new production stream Development in 2018 Production line in Hylte inaugurated Next investments ongoing Competence Centre under progress Market introduction ongoing DuraSense by brand launched First commercial deliveries with brand owners: ie Orthex and H&M Cooperation with NorDan to develop biocomposite materials for 3D printing ongoing 61


62 The leading provider of innovative wood based solutions Building a foundation Selected growth 2017 Profitable growth for total division Saved 50 MEUR Created a lean base IMPLEMENTED Increased the annual growth of added value products with 15% Started Business Process Development program (BPD) based on digitalisation IMPLEMENTED ROOC > 20% Target 10% annual growth in sales Continue focus on BPD and digitalisation Launch new products and services ONGOING 62

63 Paper Paper division provides best-in-class paper solutions for print media and office use The wide selection covers papers made from virgin wood and recycled fibres Customers: publishers, retailers, printing houses, merchants, converters and office suppliers End uses: newspapers and supplements, books, magazines, advertising, note books, art books, office 63

, Coated papers (Brands: e.")

64 Paper geared to cash generation Paper Divisional strategic target Cash flow after investing activities to sales >7% Q3/17 Q3/18 0.8% 8.3% Sample product categories Paper selection for print media: Newsprint and book papers, Uncoated mechanical papers (SC), Coated papers (Brands: e.g Nova, InnoPress) Paper selection for office use: transactional needs, office printing, writing and educational needs (Brands: e.g 4CC, MultiCopy, Zoom) Main competitors include UPM, Sappi, Norske Skog, Holmen and International Paper 64
65 Paper worldwide Grade Capacity t Newsprint Uncoated Magazine (SC) Coated Magazine 250 Total Magazine Paper Coated Fine Uncoated Fine Total Fine Paper Paper Total
66 Since 2013 we have transformed our Paper business -17% -33% -21% -82% +20% Paper demand in Europe Our production capacity Our deliveries Our accidents Customer satisfaction* Optimising profitability and cash flow: Focus on the right product and customer segments Pricing excellence Variable and fixed cost control High operational efficiency and capacity utilisation Focused investments Working capital reduction Innovation and digitalisation Change 2013 Q3/2018 *) Percentage points in NPS 66


67 We are delivering on our transformation strategy Sales excluding Paper growing 4.5% CAGR while Paper sales are decreasing 67
68 Innovations 68


69 Innovations a few snapshots 69
70 Innovation in packaging Advancing the renewable packaging industry with innovations Microfibrillated cellulose (MFC) Biobarrier coatings Biocomposites Intelligent packaging Design driven innovation 70


71 We see many new opportunities to replace fossil-based materials Lignin-based products Lineo TM by Carbon fibre Carbon for energy storage Biocomposites DuraSense TM by for wood-based biocomposites Less fossil-based materials with higher share of fibre Liquid packaging MFC Source reduction MFC films Functional barriers for paper and board packaging Market size 1.2 BEUR Growth ~20%/a EBITDA 30 50% Market size 7 BEUR Growth ~15%/a EBITDA 20 30% Market size 1.5 BEUR Growth ~5%/a EBITDA >20% 71

72 Iceland Foods chooses our Trayforma to replace plastics Iceland Foods, the UK s leading specialist retailer in the frozen food category, launched the first plastic-free pledge for its own brand products for a UK supermarket Target is to be plastic-free by 2023 through an overhaul of their entire product range Ready meals packed in paperboard trays Trayforma TM by food-safe and suitable for cooking at high temperatures in ovens and microwaves food trays 72


73 Micro-fibrillated cellulose improves product properties and can replace fossil-based materials Today MFC is used to make more durable, lighter, highquality packaging products Future potential Barrier coating solutions for grease and oxygen barriers Biodegradable replacement for aluminium foil Carrier for example in cosmetics 3D printing 73


74 Biocomposites gradually replacing plastic Use in products, such as disposable cutlery, furniture, as well as storage and logistics goods Raw material for markets where plastics dominate Can reduce the consumption of fossil-based plastic by up to 60% Always a better alternative than fossil-based plastic Reduce the carbon footprint of a product up to 80% Target market 4.5 Mt 1-5 years 74


75 Intelligent Packaging Consumer Engagement Brand Protection Supply chain management 75


76 Intelligent packaging commercialised New value creation Supply chain management Consumer Engagement Brand and counterfeit protection Partners Microsoft Azure cloud solution NXP Microchips Impinj Reader hardware and microchips Around ten pilots with large multinational customers Two commercial rollouts signed and more expected within next 12 months 8. Apps & installations 7. Analysis 6. Connectivity 5. Integration 1. Solution design 2. Package design 3. Tag design 4. Personalisation The Intelligent Packaging solution components 76

 performs cycle count of items in floor storage Forklifts with")


77 Digitizing supply chains for better visibility SUPPLIER 7 Shipping QC with RFIDreader gate verifies that correct RFID-tagged packages are loaded on the truck avoiding incorrect shipments WAREHOUSE REGIONAL WAREHOUSE LOCAL SERVICE VAN Automated inventory management with RFIDgates that auto-register which RFID-tagged items enter the warehouse at inbound and leave the warehouse at outbound Automated counting and scanning as RFID reader scans contents of box with RFID-tagged items, useful in receiving and picking Automated cycle count with handheld RFID-reader (or even a drone with an RFID-reader) performs cycle count of items in floor storage Forklifts with RFID-scanners enable sensing of pick/putaway locations quality controls that correct packages are picked 1 2 WAREHOUSE GLOBAL Dispatch navigation with RFIDreaders in the ceiling identify items in the dispatch area and lights guide workers to correct boxes Packaging validation with RFID-reader in pack stations verifies content of package being built verifies pack completion and warns if line items are missing 8 CONSIGNMENT STOCK Smart container with RFIDreaders at the door that register which RFID-tagged items enter and leave the container Returns management 9 RFID-reader in trunk of van keeps automated inventory count and tracks RFID-tagged equipment Anti-tamper protection of goods with sealed tag and/or unique code to identify genuine product Stock location management RFID readers on shelves sense which RFID-tagged items 77 are placed 30 November on the 2018 shelves 5 Returns management with RFID tags also on return flow from customers or other warehouses to enable full integration with other use cases 10


78 Our product offering: Tag portfolio Tag integration solution Connectivity platform solutions Professional services 78


79 From great packaging design to 3D shapes and value addition 79


80 Innovative and award-winning design Leak-tight renewable and 100% recyclable packaging for fresh fish WorldStar packaging award Sustainability award by World Packaging Organisation Original design replacing traditional pressed pulp packaging for eggs Best packaging and label award for Food at ProdExtraPack 80
81 Innovation in Biomaterials Pulp applications Cellulose modification and pulp process by-products Developing the extraction technology Further development of sugars 81


82 From wood to renewable products Extraction and separation technologies Cellulose and hemicellulose Sugars Lignin Lignin, biochemicals, bioplastics, regenerated cellulose, pulp etc 82

83 Innovation is key for sustainable profitable growth Product platforms 1. Improved pulp properties 2. Regenerated cellulose & MFC 3. Lignin 4. Bio-based chemicals Technology platform for extraction & separation 83


84 Platform 1: improving pulp properties for existing products Fluff pulp Hygiene and health, growing by 3.6% per year Life expectancy and increased disposable income in developing countries Improve fluff pulp properties to increase customer value Dissolving pulp Pulp Dissolving pulp to textiles is a 6.1 Mt market, growing 6.8% per year The increase of cellulosic fibre in textiles is driven by global brand owners Improve quality to be able to differentiate in the value chain Pulp for specialty papers Source: Smithers Pira, Hawkins Wright Flexible packaging, labels, security, décor, among others 28 Mt market, growing 1.8% per year Fibre improvements, special additives, sustainable coatings & barriers, source reduction and other innovation opportunities 84
85 Platform 2: Developing new technologies for using wood fibre in textiles, non-woven and specialty papers Regenerated cellulose Participate in the development of new technologies for using wood fibre in textile Growing interest from global brand owners increases demand for renewable fibres Opportunity to leverage on existing assets to enter this new market MFC MFC has potential to be used in specialty papers and non-woven MFC is a versatile material with potential to work as strength enhancer, additive, binder and barrier material has a long history in the research of MFC and has a demonstration plant in Imatra, Finland Source: 85
,")


86 Platform 3: Lignin big opportunities in many markets Phenol replacement Phenolic resins is a 2.8 Mt market, growing at 4% CAGR It replaces phenol in adhesives for plywood, OSB (oriented strand board), laminates, LVL and other wood construction materials The carbon footprint for lignin is roughly 1/10 of the carbon footprint of phenol Carbon fibre Lignin Light-weight high performance composites Kt market, growing at 9 12% CAGR Low-carbon-footprint carbon fibre is unoccupied market space Energy storage Source:, Carbon Composites, IDTechEx, LuxResearch, Markets and Research, Zion Research 86 Substitution of conventional hard carbon anode materials in energy storage, namely Li-Ion Batteries and Supercapacitors Market growing on average by 20% CAGR Key applications: portable consumer electronics, power tools, electrical vehicles, stationary applications and back-up systems


87 Renewable Lineo TM by can replace fossil-based materials Wood-based lignin is a renewable, nontoxic, traceable material Environment benefit, for example, in carbon fibres, energy storage and mechanical forest industry Today as a replacement for oil-based phenolic materials in glues for example in plywood and paper lamination Lignin makes up 20-30% of round wood Market size; 3Mt for Phenol replacement 87

 market")

88 Platform 4: Bio-based chemicals replacing fossil-based materials Bioplastics and intermediates C5 and C6 sugars from wood Source: PwC, Kline and Industry experts Growing interest in packaging/bottling markets for renewable solutions Reduction on carbon footprint and enhanced properties are key target areas Market clearly favoring second generation biomass as the raw material source It is a very populated market place, thus, strategic alliances will be crucial to win in this industry Xylose Key application is the xylitol (sweetener) market (approximately 120 Kt at 4 6% CAGR) Compared to C6 sugars it still is a rather undeveloped market, mainly due to lack of pure xylose availability. This is changing with the biorefinery concepts Growing interest and developments taking place in the market well positioned to be a frontrunner here 88
89 Innovation in Wood Products Product innovations Building Systems Digitalisation 89


")
 Building Solutions")

90 From a classic sawn producer to a leading provider of innovative wood-based solutions Classic sawn Cross Laminated Timber (CLT) Laminated Veneer Lumber (LVL) Building Solutions Industrial components Construction beams Pellets Online services and e-business 90


, or use a direct link")
91 Building Systems driving growth Residential multi storey panel construction Residential multi storey modular construction Find the film from s YouTube page (youtube.com/storaenso), or use a direct link youtube.com/watch?v=3ei9hhp_t5k 91


92 New ways of improving efficiency through digitalisation Forest categorisation & log value Cloud Buyer takes pictures Pictures to cloud service Calculation ProCalc data - Value of logs Quality class Value for sawmills Pricing proposal for buyer Results 92
93 Digitalisation in Wood Products Intelligent products Digital customer interaction Market information Scan each single product Markets Products Automate, robotise and mobilise production Wood Products end-to-end Digitalisation IndustriesCustomers Competitors Supplier Product demand forecast based on market Simulate production, based on demand and log info Scan each single log Optimised raw material specification based on demand Individualisation of leach log and digital data transfer to mill Trees cut based on profit optimisation Forest categorisation based on collected info 93
94 Group s financial performance, dividend policy, ownership and top management 94

95 Financial performance - Group 95
96 Cost structure 2017 % of costs 12% 11% 14% 6% 7% 34% Logistics and commissions Fibre Chemicals and fillers Energy Material Personnel Depreciation Other 7% 9% 96

97 Active capex management at or below depreciation Maintenance capex Strategic capex Biological capex Capex estimate for 2019 Depreciation and operational decrease in the value of biological assets *Guidance for Does not include Leases (IFRS 16 to be adopted in 2019) 97
98 Large number of opportunities prioritised through robust capital allocation Systematic approach on Group capex (>10MEUR) Investment Working Group headed by CFO reviews all the proposals to ensure quality and prioritisation Alignment with the strategy and financial and sustainability targets Selective investments to strategic projects in winning markets and products New cash flow modelling tool helps asset prioritisation with years perspective Divisional financial targets Consumer Board Operational ROOC > 20% Packaging Solutions Operational ROOC > 20% Biomaterials Operational ROOC > 15% Strategy Financial targets Winning markets and products Wood Products Operational ROOC > 20% Paper Cash flow after capex to sales > 7% 98

99 Targeted ROOC is driving CAPEX allocation Capex forecast in 2018 * Operational ROOC target ** Cash flow after investing activities to sales target 99

100 Year-on-year net debt/ebitda 100
101 Maturity profile Q
102 Green aspects in funding and reporting Revolving Credit Facility with a green aspect Pricing incudes sustainability component based on ability to reduce greenhouse gas emissions. Green Bond Framework A loan-format to support sustainability-focused fixed income investors and to report environmental impacts. Sustainable Finance strategy The aim is to influence and develop the financial markets and to secure funding partners with sustainability agenda. Climate-related financial disclosure CFO support for better disclosure of climate risks and opportunities based on recommendations by the Financial Stability Board s Task Force on Climate-related Financial Disclosures (TCFD). Integrated reporting The World Business Council for Sustainable Development (WBCSD) Redefining Value Board and programme: work on international reporting frameworks, materiality assessment standards, and data assurance methodologies. 102

103 dividend policy Strive to pay stable dividends linked to the long-term performance Half of the EPS over the cycle 103
104 Ownership Distribution as of 30 September 2018 % of shares % of votes % of shares held Solidium Oy* 10.7% 27.3% FAM AB 10.2% 27.3% Social Insurance Institution of Finland (KELA) 3.2% 10.1% Finnish institutions (excl. Solidium and KELA) 11.4% 8.5% Swedish institutions (excl. FAM) 4.1% 4.3% Finnish private shareholders 3.8% 2.4% Swedish private shareholders 3.0% 2.1% ADR holders 2.1% 0.7% Under nominee names (non-finnish/non-swedish shareholders) 51.5% 17.2% * Entirely owned by the Finnish State 104
105 Major Shareholders as of 30 September 2018 By voting power A shares R shares % of shares % of votes 1 Solidium Oyj* FAM AB** Social Insurance Institution of Finland (KELA) Varma Mutual Pension Insurance Company Ilmarinen Mutual Pension Company MB-Bolangen i Vetlanda AB (incl. Stiftelsen Seydlitz Småland) Erik Johan Ljungberg's Education Foundation Swedbank Robur Funds Bergslaget's Healthcare Foundation The State Pension Fund Nordea Investment Fund Keva (Local Government Pensions Institution) Investment Fund OP Suomi Elo Mutual Pension Insurance Company SEB Investment Management Unionen (Swedish trade union) Schweizerische Nationalbank Lannebo Funds S-Stock Oy Investment Fund Säästöpankki Kotimaa largest total *Entirely owned by the Finnish State. **As confirmed to. List has been compiled by the company, based upon shareholder information from Euroclear Finland Oy and Euroclear Sweden AB share registers and a database managed by Citibank, N.A. (as the company's ADR agent bank). This information includes only direct registered holdings, thus certain holdings (which may be substantial) of ordinary shares and ADRs held in nominee or brokerage accounts can not be included. The list is therefore incomplete. 105
106 Group Leadership Team CEO Karl-Henrik Sundström CFO Seppo Parvi HR Malin Bendz Consumer Board Annica Bresky Sourcing Johanna Hagelberg Paper Kati ter Horst Communication Ulrika Lilja Legal Per Lyrvall Biomaterials Markus Mannström Sustainability Noel Morrin Packaging Solutions Gilles van Nieuwenhuyzen Wood Products Jari Suominen 106


107 Board of Directors Jorma Eloranta since April 2016 Chairman Hans Stråberg since April 2009 Vice chairman Anne Brunila since April 2013 Elisabet Fleuriot since April 2013 Hock Goh since April 2012 Christiane Kuehne since April 2017 Antti Mäkinen since March 2018 Richard Nilsson since April 2014 Göran Sandberg since April

108 ESG indices and other external recognition in
109 Sponsored ADR Programme has established a sponsored Level I ADR programme in the US. The ADRs trade on the premier tier of Over-The-Counter ( OTC ) market in the US. Details are as follows: Ticker Symbol CUSIP Ratio ADR depositary SEOAY 86210M106 1 ADR : 1 Ordinary Shares Citibank Share price information or Please contact the Citibank s dedicated ADR broker desks: Scott Pollak (New York) Mike Woods (London) Tel: Tel: scott.h.pollak@citi.com michael.woods@citi.com 109
110 Another quarter of profitable growth Financial results for Q CEO Karl-Henrik Sundström CFO Seppo Parvi 26 October 2018
 Favourable prices and active product mix management EPS increased by 12.9% to 0.27 (0.")
111 Another quarter of profitable growth Q year-on-year Sales MEUR, +3.0%, 7 th consecutive quarter of growth Sales growth excluding divested Puumerkki was +4.7% Operational EBIT +23% to 358 MEUR EBIT margin 13.8% (11.6%) Favourable prices and active product mix management EPS increased by 12.9% to 0.27 (0.24) EUR Strong cash flow from operations was 457 MEUR (430 MEUR), after investing activities 319 MEUR (283 MEUR) Continued balance sheet improvement and net debt to operational EBITDA ratio improved significantly to 1.1 (1.6) Operational ROCE at 16.7% (13.9%), well above strategic target of 13% for the fifth consecutive quarter 111
112 Visible strength of the portfolio Record performance in three divisions Operational EBIT Q3 y-o-y * Change % Q3/18-Q3/17 112
113 Fifth consecutive quarter above the strategic target of 13% Operational ROCE 113

114 Latest transformation steps New announced investments Upgrading and expanding the corrugated packaging plant in Riga, Latvia. Project to be completed in New Competence Centre for biocomposites and additional production capacity in Sweden and Gasum to build a biogas plant at Stora Enso s Nymölla paper mill in Sweden Bergvik Skog restructuring On-going progress Main restructuring expected to be finalised in H No negative effect on 2019 wood sourcing expected Oulu conversion feasibility study ongoing 114
115 Transformation journey Growth businesses 70% of sales and 82% of operational EBIT Sales 2006 Sales Q3/2018-3% 21% 30% 30% 1% 25% 70% 70% 12% Operational EBIT % 15% 16% Operational EBIT Q3/2018 Consumer Board Packaging Solutions 1 Biomaterials Wood Products Paper 2 Other & eliminations -3% 35% 38% 18% 1% 14% 82% 1 In 2006 included in Consumer Board 2 In 2006 includes merchants 13% 19% 62% 6% 35% 115
116 Performance clearly improving Summary financials Q Change% Change% EUR million Q3/18 Q3/17 Q3/18- Q3/17 Q2/18 Q3/18- Q2/18 Sales % % Operational EBITDA % % Operational EBITDA margin 19.4% 17.2% 17.5% Operational EBIT % % Operational EBIT margin 13.8% 11.6% 12.3% Profit before tax excl. IAC % % EPS excl. IAC, EUR % % EPS (basic), EUR % % Operational ROCE 16.7% 13.9% 20.1% 15.5% 7.7% Cash Flow from Operations % % Net debt/last 12 months operational EBITDA


117 Consumer Board Sales growth continues Q3 y-o-y Sales increased slightly to record-high Q3 of 648 MEUR Increased volumes and first price increases visible Supported by the ramp-up of Beihai Mill operations Operational EBIT decreased 36 MEUR to 50 MEUR Significantly higher variable costs, especially for pulp, chemicals and wood were only partly offset by improved sales prices and fixed costs management Operational ROOC declined to 10.3% Successful rebuild of a machine at Imatra Mills in Finland for industrial production of MFC for barrier film production. Ramp-up will start during Q4. 117

118 Packaging Solutions Another all-time high quarter Q3 y-o-y Sales +4% to record high Q3 of 330 MEUR Continued active sales mix management supported by continued good price development in European operations Operational EBIT increased another 20 MEUR to an all-time high of 68 MEUR Strong financial performance partly offset by lower deliveries and higher raw material costs for corrugated units Operational ROOC also hit an all-time high level of 30.4% and clearly above the strategic target of 20% 9 MEUR investment to upgrade and expand the corrugated packaging plant in Riga, Latvia 118

119 Biomaterials Strong pulp market continues Q3 y-o-y Sales +9% to another all-time high of 413 MEUR Higher sales prices partly offset by lower sales volumes, negatively impacted mainly by maintenance at Sunila pulp mill in Finland Operational EBIT also at all-time high level of 125 MEUR, increase of 37 MEUR, despite a maintenance shutdown at Sunila Mill reducing volumes Higher pulp prices partly offset by higher variable costs Operational ROOC increased to a new all-time high of 20.9%, which is clearly above the strategic target of 15% Lineo TM by won Best Product Innovation at the ICIS Innovation Awards ICIS is the world s largest petrochemical market information provider. 119


120 Wood Products Wood-based building continues to grow Q3 y-o-y Sales excluding the divested Puumerkki increased 6.4% Operational EBIT +64% to record high Q3 Better prices and mix, as well as volume growth, supported by Murów sawmill and Varkaus LVL investments Operational ROOC continued at record high level of 31.6%, clearly above strategic target of 20% Business portfolio development 7 MEUR investment in building a Competence Centre for biocomposites in Sweden and the Finnish start-up TRÄ Group to develop innovative digital services for wooden buildings and Orthex launched a new range of kitchen utensils made from biocomposite. The 98% bio-based material used to replace fossil-based plastic is made from spruce and sugarcane. 120

% achieved on the back of better profitability and Gasum to build a biogas plant at Nymölla paper mill")
121 Paper Solid profitability and cash flow Q3 y-o-y Sales increased +7% to 779 MEUR Clearly higher sales prices in all grades and a better mix Operational EBIT increased 125% to 65 MEUR Good market balance continues Cash flow after investing activities to sales ratio 8.3 (0.8)% achieved on the back of better profitability and Gasum to build a biogas plant at Nymölla paper mill in Sweden. Total investment for 5 MEUR. 121

122 Outlook for Q Compared to Q Sales are estimated to be slightly higher than the amount of MEUR recorded in Q3/2018 Operational EBIT is expected to be in line with or somewhat lower than the 358 MEUR recorded in Q3/2018 A negative 10 MEUR impact on operational EBIT is expected due to production restrictions at uncoated fine paper mill in Nymölla, Sweden. This is because water at a near by lake, which supplies water for the mill operations, is at too low level. The impact of annual maintenance shutdowns is expected to be similar to Q3/2018. These impacts are included in the above outlook. Annual maintenance Q Q Consumer Board Skoghall and Fors mills Imatra and Ingerois mills Packaging Solutions - Ostrołęka Mill Biomaterials Montes del Plata and Skutskär mills Sunila Mill Paper - Veitsiluoto Mill 122

123 Another quarter of profitable growth Visible strength of the portfolio Seventh consecutive quarter of sales growth Fifth consecutive quarter of double digit operational EBIT margin. Q3 YoY operational EBIT margin improved 2.2 percentage points. Fifth consecutive quarter of operational ROCE well above the strategic target of 13% Balance sheet continues to strengthen Operational EBIT expected to be clearly higher in 2018 compared to 2017 Moving from asset transformation to innovation and sales transformation continues successfully 123


124