CLIMATE CHANGE ASSESSMENT OVER THE ASSINIBOINE DELTA AQUIFER
|
|
|
- Spencer Stanley
- 5 years ago
- Views:
Transcription
1 CLIMATE CHANGE ASSESSMENT OVER THE ASSINIBOINE DELTA AQUIFER Allan Woodbury 1, Ken Snelgrove 2, Youssef Loukili 1 and Sitotaw Yirdaw-Zeleke 1 1 Department of Civil Engineering, University of Manitoba and 2 Memorial University, Newfoundland
2 Acknowlgements Gaywood Matile, Greg Keller: Manitoba Geological Survey Ted Horbulyk, University Calgary Manitoba Water Stewardship Funding: Drought Research Initiative Canadian Water Network Manitoba Climate Change Action Fund
3 Who is DRI? Co-leads: Ron Stewart (McGill) & John Pomeroy (Sask) Investigators: Bonsal (Sask/NHRC), Bullock (Man), Gyakum (McGill), Hanesiak (Man), Hayashi (Calg), Leighton (McGill), Lin (McGill), Pietroniro (Sask/NHRC), Snelgrove (Mem), Strong (Alta), van der Kamp (Sask/NHRC), Wheaton (Sask/SRC), Woodbury (Man) Collaborators: Boer (MSC), Cayas (Ouranos), Derome (McGill), Donaldson (MSC), Granger (NHRC), Johnston (SRC), Martz (Sask), Prowse (NWRI), Raddatz (Man), Ritchie (MSC), Shabbar (MSC), Sills (MSC), Szeto (MSC), Wittrock (SRC), Papakyriakou (Man)
4
")
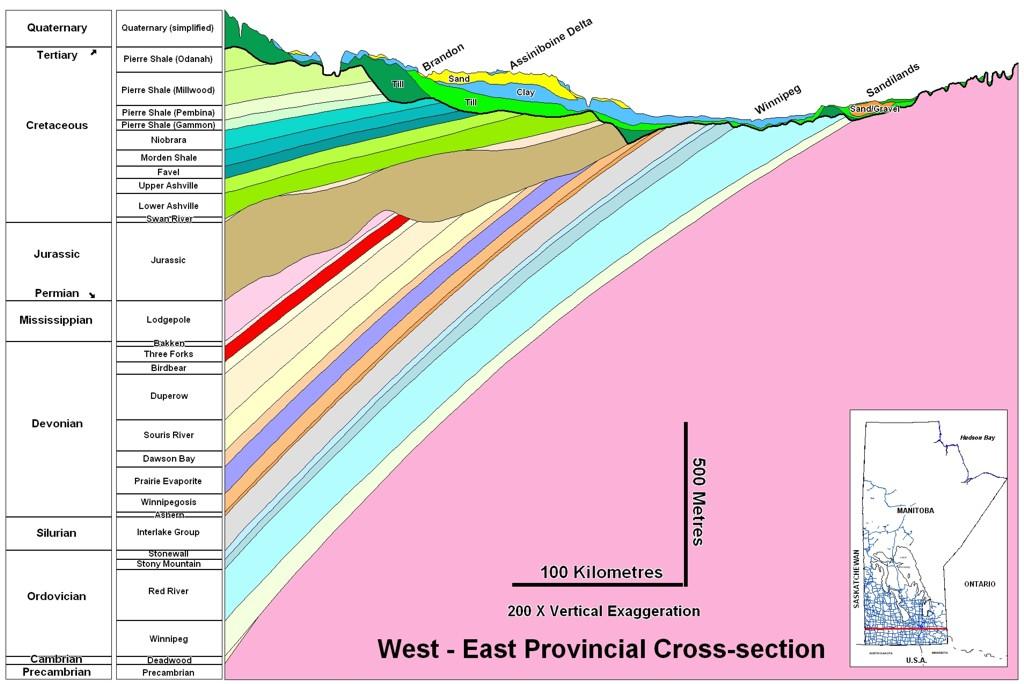
5 Source: Majorowicz and Safanda (2005)
6 Overview 1. Objectives and background 2. Hydrogeology of the ADA 3. Groundwater modelling (MODFLOW) 4. Land surface modelling (CLASS) 5. Atmospheric modelling (MM5) 6. Coupling strategy 7. Software working tools 8. Field data required 9. Initial simulations and conclusions

7 Objectives Climate change impacts and adaptations for the ADA Couple atmosphere, surface and groundwater models

8 Provide : 1. Lower boundary condition for the atmospheric model 2. Management schemes for sustainability of water quantity / quality 3. Prediction of pollution stemmed from human practices over ADA
9 Prelude How do we deal with climate change now? Source: Fetter (2001, 4 th ed)

, 638-648.")
10 University of Waterloo Water Budget HELP3 MODFLOW M.I. Jyrkama, J.F. Sykes, and S.D. Normani, Recharge Estimation for Transient Ground Water Modeling. Ground Water, 40(6),

11 Laural Creek Results Courtesy of M.I. Jyrkama Impact of recharge boundary condition on groundwater flow Simulated vs. observed water levels at a monitoring well
12 Enhancements WatCLASS Development Motivation for adding streamflow to atmospheric models Coupling WATFLOOD and CLASS (Snelgrove, 2002) Results BOREAS Tower simulations Point Scale BOREAS Study Areas Headwater Scale Mackenzie River Atmospheric Domain
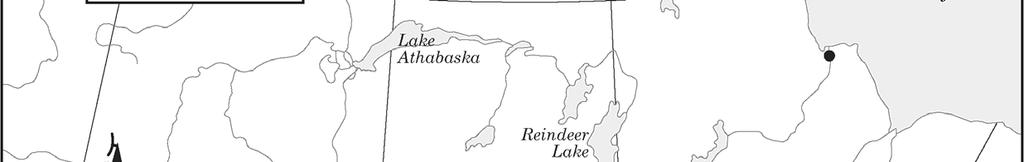
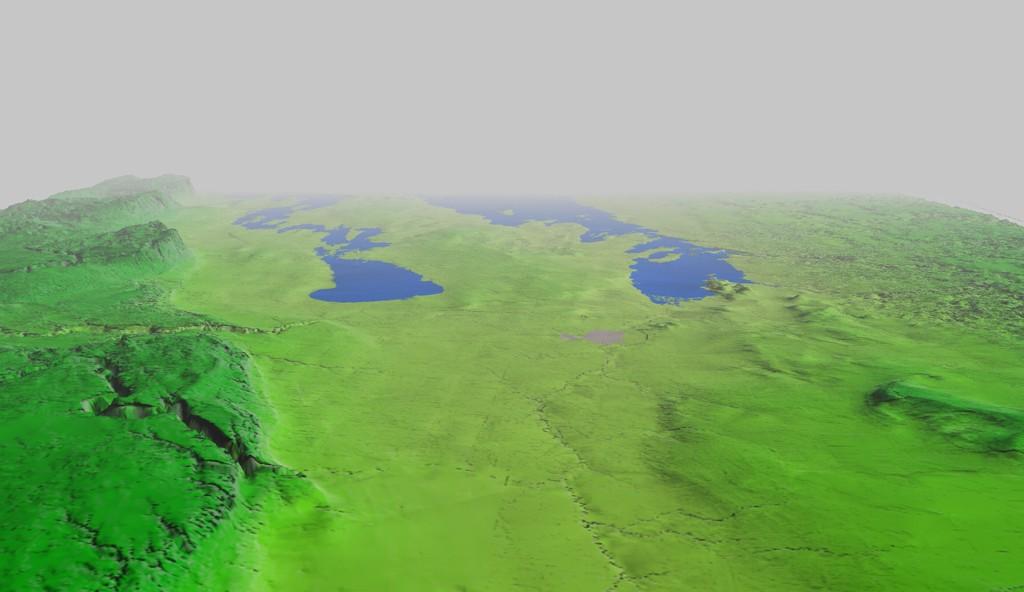
13 ADA Hydrogeology
14
15
16
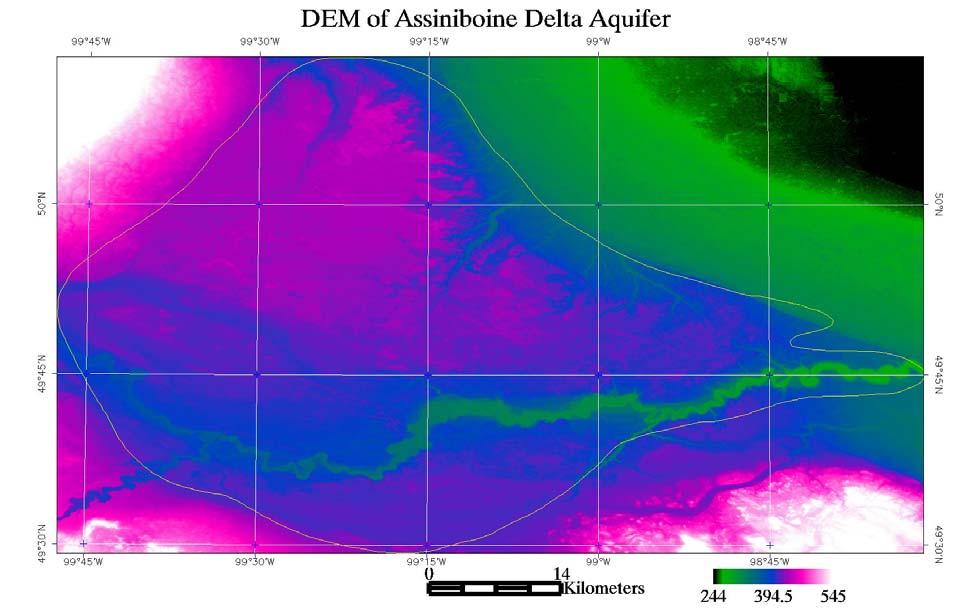
17 Sand and Gravel Isopach of the Assiniboine Delta Aquifer (ft) Bedrock m Hydraulic Conductivity: m/d Specific yield: L.H. Frost and F.W. Render, 2002
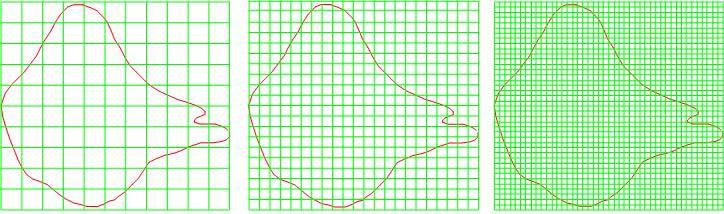
18 Groundwater: MODFLOW
19 MODFLOW model test Drawdown(m) Discharge (m^3/d)
20 Land Surface Scheme (Class) Second Generation Land Surface Scheme SENSIBLE EXCHANGE RADIATIVE EXCHANGE IR up r a MOISTURE EXCHANGE Evaporation Aerodynamic resistance ( r a ) Interception α veg Transpiration T c Canopy Temperature and humidity Leaves LAI Stomata Wind Leaf Drip Fraction vegetation cover & LAI Fn ( temperature & season) Snow IR up IR down r s ( light sensitivity changes r s ) Stems SAI Infiltration Surface α soil Runoff Fn ( soil wetness) T g Surface Soil Temperature Upper layer wetness Upper soil layer Lower Soil Temperature T gb Root Distribution Fn ( vegetation type) Full column wetness Full soil column Subsurface Runoff
21 Improved CLASS Soil Column Current CLASS Model θ 1 Surface Excess θ 1 WatCLASS θ 2 θ 2 θ 3 Drainage θ 3 Drainage
22 Improved CLASS Soil Column Current CLASS Model θ 1 Surface Excess θ 1 WatCLASS θ 2 θ 2 θ 3 θ 3 Time t=0 Drainage Drainage
23 Improved CLASS Soil Column Current CLASS Model θ 1 Surface Excess θ 1 WatCLASS θ 2 θ 2 θ 3 Time t=t 1 Drainage θ 3 Drainage
24 Improved CLASS Soil Column Current CLASS Model θ 1 Surface Excess θ 1 WatCLASS θ 2 θ 2 Time t=t 2 θ 3 Drainage θ 3 Drainage
25 Distributed Water Balance A L A L A L A L A L A L =A B A L A L A L Hydrologic P-E vs. no snow simulated streamflow Atmosphere (A) mm of water P-E Oct-95 Nov-95 Dec-95 Jan-96 Feb-96 Mar-96 Apr-96 May-96 Jun-96 Jul-96 Aug-96 Sep-96 Date Land Surface (L) Channel Network (C) Q L Q L Q L Q L Q L Outflow = Q L, Runoff = R L Outflow Q B,Runoff R B =Q B /A B
 mm of water 25 20 15 10 5 0 P-E -5-10 Oct-95 Nov-95 Dec-95 Jan-96 Feb-96 Mar-96 Apr-96 May-96 Jun-96 Jul-96 Aug-96 Sep-96 Date Land Surface (L)")
26 Distributed Water Balance A L A L A L A L A L A L =A B A L A L A L Hydrologic P-E vs. no snow simulated streamflow Atmosphere (A) mm of water P-E Oct-95 Nov-95 Dec-95 Jan-96 Feb-96 Mar-96 Apr-96 May-96 Jun-96 Jul-96 Aug-96 Sep-96 Date Land Surface (L) Channel Network (C) Q L Q L Q L Q L Q L Outflow = Q L, Runoff = R L Outflow Q B,Runoff R B =Q B /A B Groundwater (G)
27 Atmospheric Models GCM3 200 km grid Climate Models CRCM4 45 km grid Weather Model GEM 15 km grid Land Surface Hydrology Models CLASS, ISBA, WATCLASS 15 km grid Hydrological Process Models CPM, CRHM 1 km grid
 Reanalysis II data has been")
28 Atmospheric Modelling ( MM5 ) Domain set-up for MM5 run Center of the Course Domain: 54 O North, 98 O West Domain/ Grid dist. Grids E-W Grids N-S D01/90 Km D02/30 Km D03/10 Km National Center for Environmental Prediction (NCEP) Reanalysis II data has been used to drive the model.

29 Model Output : Animated Hourly Temperature output: From 00Z01MAY2004 to 00Z02MAY2004

30 Model Output : Animated Hourly Relative Humidity output: From 00Z01MAY2004 to 00Z02MAY2004
31 Coupling Strategy MM5 CLASS MODFLOW

32 Parallelized / coupled modelling environment Models Observation MCT
33 Modelling Strategy Process Studies Integrated Modelling Level 0 GEM/RCM GCM WATFLOOD Level 1 GEM/RCM GCM CLASS WATFLOOD WatCLASS Level 2 GEM/RCM GCM WATFLOOD CLASS Level 3 GEM/RCM GCM CLASS with hydrology? WatROUTE Ground Water Process Studies
34 Software Working Tools Basics Numerical / hydrological modeling Computational analysis and optimization High performance computing Development MODFLOW : 70,000 code lines CLASS : 10,000 code lines Code structure analysis Scientific / industrial programming GIS : ArcView, ArcInfo, etc.
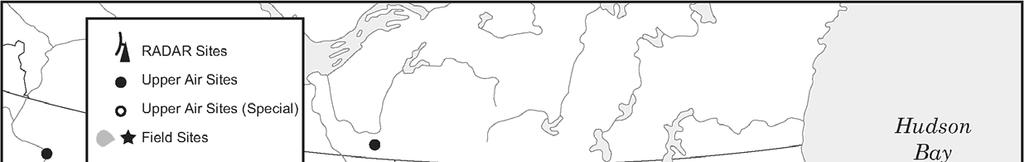
35 Field Data Required Land-Surface, Streams Groundwater Vegetation type Surface Soils Precipitation, Temperature Wind velocity, Humidity Radiation (long/shrt waves) Pressure Stream flow Snow depth Soil moisture Statigraphy Well Observations Pumping test Soil Samples Transmissivity Time series heads Evaporation and Runoff
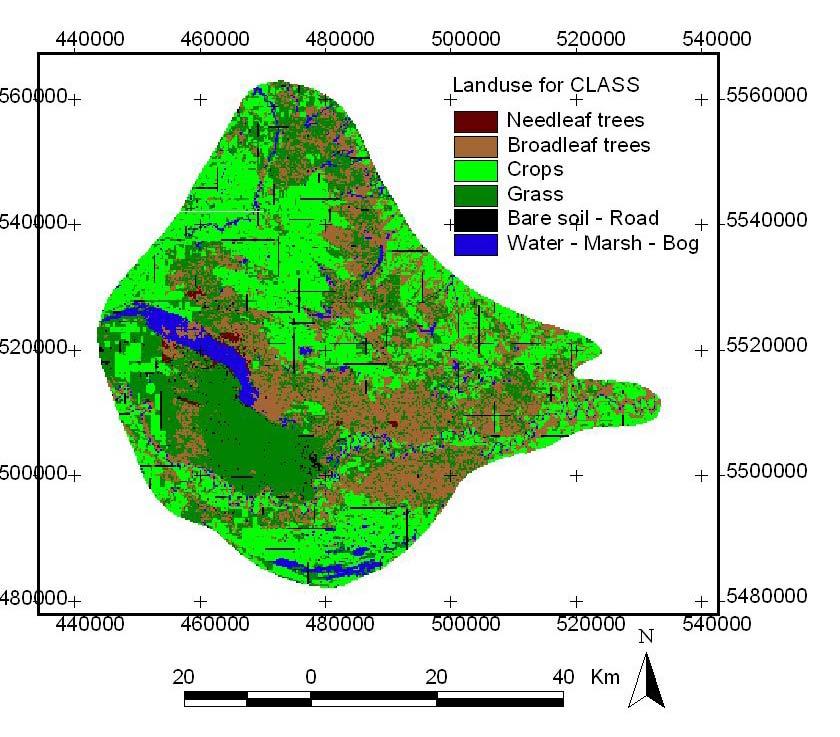
36 Land Use
37 Initial Coupled Simulations Modflow mesh CLASS layers,,,,,, +, _ ^ ^ ^^ ^ ^ ^ ^ ^^^^ ^^^^ v v ^ ^ v v v ^ * * * * * * * v v * * v v * * * * * v v * v h^ (1) (2) (3) d^0 d * 1 h* + d h + 2, d, 1 h o o o o o o o o o o o oo o o o o o o o v _ d _ 2 h d v h v 3 o o o o Groundwater flow o d o 3 h o 1,40E-03 1,20E-03 1,00E-03 8,00E-04 6,00E-04 4,00E-04 2,00E-04 0,00E+00 Recharge to deep water table Recharge to shallow water table Coupling Modflow with 7 CLASS runs. Recharge affected according to mean head below
38 0,0028 0,0028 0,0024 0,0024 0,002 0,002 0,0016 0,0012 0,0008 0, Bare soil Needleaf trees Broadleaf trees Crops Grass Mean vegetation ,0016 0,0012 0,0008 0,0004 Mean vegetation Drainage from Layer 2 (left) and Layer 3 (right) in m/day, for different soil coverage Bare soil Needleef trees Broadleaf trees Crops Grass Modflow Bare soil Needleaf trees Broadleaf trees Crops Grass Mean vegetation Increase of deep water table according to recharge from Layer 3, for different soil coverage
39 Future Work Compare coupled MODCLASS model to carefully controlled field observations Obtain necessary data for Assiniboine Delta Aquifer RCM and look at climate change scenarios Imbed economics and policy alternatives
40 Conclusions Early versions of a linked atmosphere (MM5), land-surface scheme (CLASS), stream flow (WATFLOOD) and groundwater (MODFLOW) MODCLASS? Incompatibility of codes
41 Novelty of Research Aspects of internet technologies High resolution numerical simulations Scientific questions Societal impacts, economic analysis Integration of disciplines Maximize impact