MRG Bernalillo to Belen GRR
|
|
|
- Brooke Armstrong
- 5 years ago
- Views:
Transcription
1 MRG Bernalillo to Belen GRR Appendix H Hydrology and Hydraulics July 2017 Albuquerque District South Pacific Division
2 Rio Grande Floodway Bernalillo to Belen, Mt. View - Isleta to Belen Unit Bernalillo and Valencia Counties, NM Table of Contents 1.0. Introduction 1.1. Scope of Hydrology and Hydraulics (H&H) Study 1.2. Project Area 2. Previous Hydrology, Hydraulic, and Sediment Analysis 3.0. Hydrology 3.1. Purpose of Hydrology Study 3.2. Overview of Hydrology in the Project Area Hydrology at Albuquerque Summary of Hydrologic Analysis in the Project Area Independence of Flooding Sources 3.3. Flood Events from Regulated Areas 3.4. Flood Flows from Unregulated Areas - Albuquerque and Upstream 3.5. Flood Flows from Rainfall Runoff Events in the Project Area Watershed Characteristics of the South Diversion Channel Previous Hydrologic Studies for the Tijeras Arroyo Factors in the Tijeras Arroyo Hydrology Methods of Evaluating the SDC/ Tijeras Arroyo Hydrology Flood Frequency Analyses Hydrologic Models from Previous Studies Flood Frequency for the Tijeras Arroyo at its Confluence with the SDC Volume of Flooding on the Tijeras Arroyo 3.6. Routing of Flood Components through the Project Area The FLO-2D Flood Routing Model Hydrographs Used for Routing Results of FLO-2D Flood Routing for the Without-Project Condition Results of FLO-2D Flood Routing for the With-Project Condition 3.7. Combined Frequency in the Project Area Without-Project Combined Frequency With-Project Combined Frequency 4.0. Hydraulic Analysis 4.1. Overview of Hydraulic Analysis 4.2. Without-Project Hydraulic Analysis Without-Project Hydraulic Models Without-Project FLO-2D Flood Routing Model Assumptions 4.3. With-Project Hydraulic Analysis 5.0. Sediment Analysis 5.1. Methodology for Aggradation/Degradation Analysis 5.2. Conclusions 6.0. Risk and Uncertainty 6.1. Without-Project Hydraulic Risk 6.2. With-Project Hydraulic Risk 7.0. Delineation of Inundation Mapping 7.1. Without Project Inundation Mapping 3
3 7.2. Tentative Selected Plan Inundation Mapping 7.3. Residual With-Project Inundation Mapping 8.0. Interior Drainage Analysis Attachments 1. References Also located at end of Report 2. Middle Rio Grande Flow Frequency Study, (HEC, June 2006) 3. Belen Reach FLO-2D Model Grid Expansion, (Mussetter Engineering, Inc., dated June 2006) 4. Middle Rio Grande Flood Control Hydraulic Modeling Services Preliminary Report on FLO- 2D Model Development between the I-25 Bridge and Belen, (Tetra Tech, Inc., Dec. 2006) 5. Sediment-Transport and Scour Analysis of Tijeras Arroyo for Design of University Boulevard Bridge Crossing conducted by Mussetter Engineering, Inc. dated December Middle Rio Grande, Bernalillo to Belen Flood Control Study, H&H Certifications 7. Inundation Mapping 8. FLO-2D MRG Model Runs 9. HEC-RAS MRG Model 10. HEC-FDA MRG Model 11. Geotechnical Memorandum 12. MRG Map Book 13. Residual Inundation Mapping 14. Interior Drainage Analysis 4
4 Figures 1. Map of Project Area 2. Albuquerque Watershed 3. Average Annual Precipitation in New Mexico (NRCS) 4. Combined Peak Flow Frequency Curve for the Rio Grande at the Albuquerque Gage, from the 2006 HEC Report 5. Flood Flow Frequency for Gage , Tijeras Arroyo near Albuquerque, Located at its Confluence with the SDC 6. Hydrographs at the Albuquerque Gage for Flood Events from Regulated Areas Upstream of Albuquerque (Provided to the Albuquerque District by the HEC as Supplemental Information to the HEC 2006 Report) 7. Dimensionless Hydrograph at the Albuquerque Gage for Flood Events from Unregulated Areas Upstream of Albuquerque (Provided to the Albuquerque District by the HEC as Supplemental Information to the HEC 2006 Report) 8. South Diversion Channel and Tijeras Arroyo Watersheds 9. Isopluvials of the 100-Year 6-Hour Precipitation Depth in Inches for New Mexico, from NOAA Atlas Peak Flood Frequencies for Tijeras Arroyo at Gage , Tijeras Arroyo North of Kirtland AFB, from Four Agencies 11. Composite Flood Frequency Curve for the Tijeras Arroyo at its Confluence with the SDC 12. Frequency Flood Hydrographs from the Tijeras Arroyo 13. Rio Grande at Albuquerque Routed Without-Project Flood Hydrographs from the Controlled Upstream Area 14. Rio Grande at Albuquerque Routed Without-Project Flood Hydrographs from the Uncontrolled Upstream Area 15. Rio Grande at Albuquerque Routed Without-Project Flood Hydrographs from the Tijeras Arroyo 16. FLO-2D Without-Project Routing of 1% Chance Flooding from the Three Independent Flooding Sources 17. Combined Frequency Curve at Cross Section 1, the Rio Bravo Bridge in Albuquerque 18. Combined Frequency Curve at Cross Section 2, the South Diversion Channel 19. Combined Frequency Curve at Cross Section 3, the End of the West Side Albuquerque Levee 20. Combined Frequency Curve at Cross Section 4, I-25 Bridge 21. Combined Frequency Curve at Cross Sections 5 to 12, Isleta Railroad Bridge to Belen 22. Average Yearly Sedimentation 5
5 Tables 1. Record of Instantaneous Peak Flows for the Rio Grande and the Tijeras Arroyo 2. Peak Flood Flows for the Rio Grande at Albuquerque (at Central Avenue) both from Upstream Regulated Areas and Upstream Unregulated Areas 3. Hydrologic Model Results from Studies on the Tijeras Arroyo 4. Peak Flood Flows Entering the Rio Grande from the Tijeras Arroyo 5. Comparison of Point Precipitation Frequencies for Different Duration Storm Events 6. Correspondence of Annual Maximum One-Day Flows with Annual Instantaneous Peak Flows at Gages on Tijeras Arroyo 7. Cross Sections Used in Analyzing the Project Area Downstream of the Albuquerque Gage 8. Without-Project Flood Peaks After Routing - Albuquerque Floods from Regulated Areas Upstream 9. Without-Project Flood Peaks After Routing - Albuquerque Floods from Unregulated Areas Upstream 10. Without-Project Flood Peaks After Routing - Floods from the Tijeras Arroyo 11. Cross Sections Used in Analyzing the Project Area Downstream of the Albuquerque Gage for the With-Project Condition 12. Current With-project Condition (2008) Flood Peaks after Routing - Albuquerque Floods from Regulated Areas 13. Current With-project Condition (2008) Flood Peaks after Routing - Albuquerque Floods from Unregulated Areas 14. Current With-project Condition (2008) Flood Peaks after Routing - Floods from the Tijeras Arroyo 15. Without-Project Combined Frequency Analysis Multiple Discrete Event Method at Cross Section 1, the Rio Bravo Bridge at Albuquerque 16. Without-Project Probability of Flood Flows at Cross Section 1, the Rio Bravo Bridge at Albuquerque 17. Without-Project Combined Frequency Analysis Multiple Discrete Event Method at Cross Section 2, the South Diversion Channel 18. Without-Project Probability of Flood Flows at Cross Section 2, the South Diversion Channel 19. Without-Project Combined Frequency Analysis Multiple Discrete Event Method at Cross Section 3, the End of the West Side Albuquerque Levee 20. Without-Project Probability of Flood Flows at Cross Section 3, the End of the West Side Albuquerque Levee 21. Without-Project Combined Frequency Analysis Multiple Discrete Event Method at Cross Section 4, I-25 Bridge 22. Without-Project Probability of Flood Flows at Cross Section 4, I-25 Bridge 23. Without-Project Combined Frequency Analysis Multiple Discrete Event Method at Cross Section 5, Isleta Railroad Bridge 24. Without-Project Probability of Flood Flows at Cross Section 5, Isleta Railroad Bridge 25. Without-Project Combined Frequency Analysis Multiple Discrete Event Method at Cross Section 6, Isleta Bridge 26. Without-Project Probability of Flood Flows at Cross Section 6, Isleta Bridge 27. Without-Project Combined Frequency Analysis Multiple Discrete Event Method at Cross Section 7, Bosque Farms 28. Without-Project Probability of Flood Flows at Cross Section 7, Bosque Farms 29. Without-Project Combined Frequency Analysis Multiple Discrete Event Method at Cross Section 8, Bridge at Los Lunas 30. Without-Project Probability of Flood Flows at Cross Section 8, Bridge at Los Lunas 31. Without-Project Combined Frequency Analysis Multiple Discrete Event Method at Cross Section 9, Intermediate Location between Los Lunas and Belen 6
6 32. Without-Project Probability of Flood Flows at Cross Section 9, Intermediate Location between Los Lunas and Belen 33. Without-Project Combined Frequency Analysis Multiple Discrete Event Method at Cross Section 10, Bridge at Belen 34. Without-Project Probability of Flood Flows at Cross Section 10, Bridge at Belen 35. Without-Project Combined Frequency Analysis Multiple Discrete Event Method at Cross Section 11, Belen Railroad Bridge 36. Without-Project Probability of Flood Flows at Cross Section 11, Belen Railroad Bridge 37. Without-Project Combined Frequency Analysis Multiple Discrete Event Method at Cross Section 12, Downstream End of Project Area 38. Without-Project Probability of Flood Flows at Cross Section 12, Downstream End of Project Area 39. Cross Sections Used in Analyzing the With Project Levee from the SDC through Belen 40. Without-project Flood Peaks after Routing - Floods from the Tijeras Arroyo 41. Middle Rio Grande Comparison of Modeled Elevations to Measured Water Surface Elevations of May 2005 (NAVD 88) - Flow approx cfs to 6000 cfs 42. Hydraulic Parameters Varied for the Risk Analysis Hydraulic Models 43. Risk Analysis Results for the Channel Water Surface Elevations (WSEL) 44. Risk Analysis Results for the Right (West) Overbank Floodplain WSEL 45. Risk Analysis Results for the Left (East) Overbank Floodplain WSEL 46. Hydraulic Parameters Varied for the With-Project Risk Analysis in the HEC-RAS Model 7
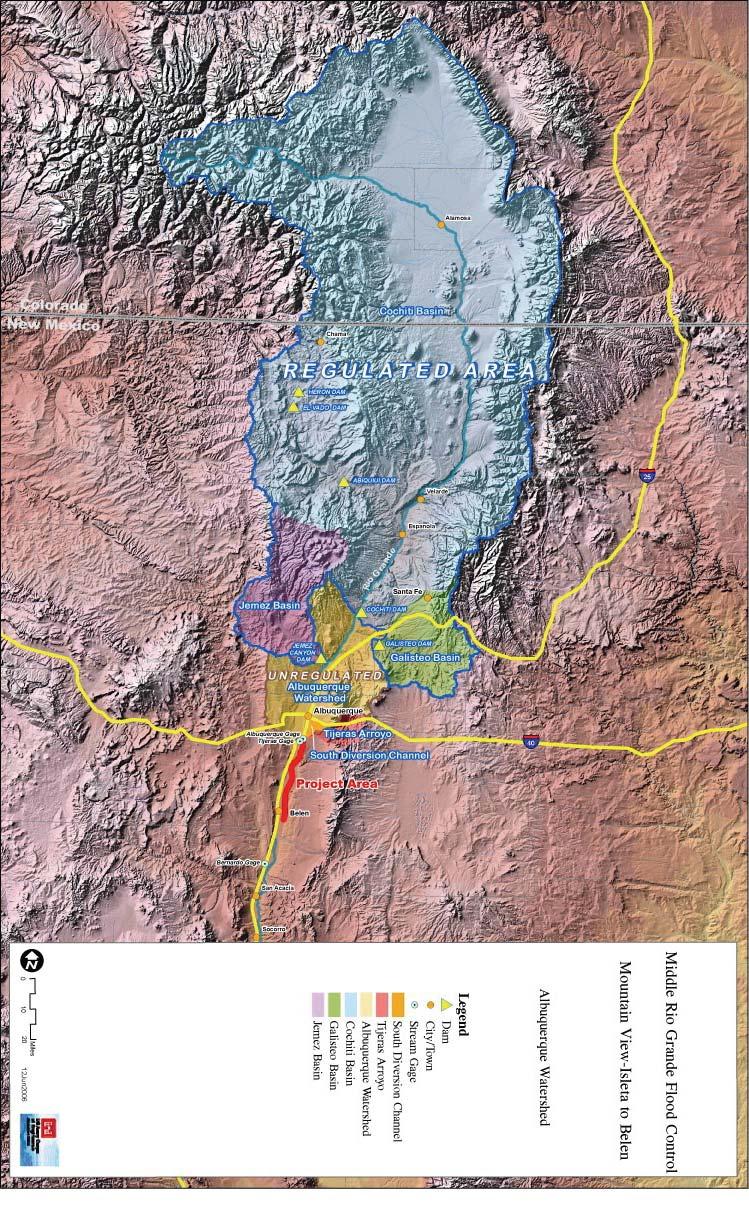
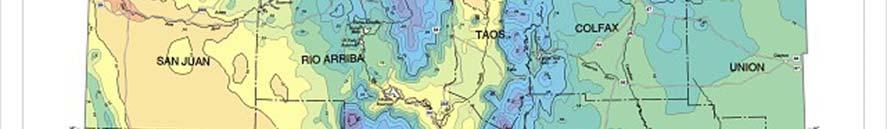
7 1.0. Introduction The Middle Rio Grande Flood Control Project was authorized in the Water Resources Development Act of The current feasibility study for this project will evaluate flood control alternatives for the Rio Grande in the project area which includes the three southern units (Mountain View, Isleta, and Belen) located in Bernalillo and Valencia counties, New Mexico Scope of Hydrology and Hydraulics (H&H) Study. An evaluation of hydrology and hydraulics provides an estimate of potential for flooding in a given area. The flood peaks, volume and duration that can be expected, along with the corresponding river depths and velocities, are part of the information that these analyses provide. Sediment movement is a significant factor in the Rio Grande, and so that is included. Hydrology and hydraulics have been addressed in past studies. However, there are now both new data and improved analytic techniques available for use in analyzing the H&H. Given the present capability, it was decided to revise the hydrology, and also the hydraulic and sediment analyses. The H&H analysis addresses both with- and without-project conditions. The differences between them allow an evaluation of the benefits of providing proposed project features. The with-project analysis includes the details of the proposed design, so that specific design features can be evaluated. Both with- and without-project evaluations include present conditions and future conditions (with projected sedimentation). Future conditions are estimated to be 50 years from present Project Area. The project area begins in the Rio Grande floodway just south of the Albuquerque city limits, at the South Diversion Channel. It extends downstream for 35 river miles. The downstream limit of the project area is the Rio Grande floodway 5 river miles south of the Highway 47 Bridge at Belen. The study area includes several small rural communities on both sides of the Rio Grande between Albuquerque and Belen, most of which are unincorporated. Pajarito, Los Padillas, Isleta Pueblo, Los Lentes, Los Lunas, Los Chavez, Belen, Bacaville, Jarales, and Pueblitos are located on the west bank of the Rio Grande; Mountain View, Bosque Farms, Peralta, Valencia, Tome, Adelino, La Constancia, and Madrone are located on the east bank of the Rio Grande. Figure 1 shows the project area and Figure 2 shows the watershed upstream of the project area, including major subwatersheds. For more detailed mapping of the project area showing significant project features see Attachment 12 MRG Map Book. 8
8 Figure 1 - Project Area 9

9 2.0. Previous Hydrology, Hydraulic and Sediment Analyses 10
10 The flooding problems along the Middle Rio Grande between Bernalillo and Belen, New Mexico are documented in a 1979 feasibility report. In that report, seven reaches or 'units' were evaluated. These included Bernalillo, Corrales, Albuquerque, Isleta, Mountain View, and Belen East and West units. The 1979 feasibility report recommended no action for the Albuquerque Unit since the existing levees were in good condition and provided flood protection up to and including 42,000 cfs and no action for the Bernalillo Unit because it was not economically justified. Levees to reduce the flood threat for the other five units were found to be economically justified and authorized for construction in the Water Resources Development Act of A General Design Memorandum (GDM) for these five units was also completed in In this document, it was determined that the Mountain View and Isleta Units were no longer economically justified and were dropped at the completion of the GDM from further design or analysis. A detailed Interior Drainage Analysis was also included as part of the 1986 GDM and will be provided for consideration and inclusion in this document. Because the Middle Rio Grande Conservancy District (MRGCD), sponsor for these projects, had limited financial capability, design activities for the Corrales Unit continued, with the Belen East and West units being placed on hold until the Corrales Unit was completed. A Limited Reevaluation Report (LRR) for the Corrales Unit was completed in Construction of the Corrales Unit began in 1996 and was completed in During the course of the Limited Reevaluation Report study for the Belen East and West units, several events occurred that impacted the study and have resulted in expanding the scope of the Belen Limited Reevaluation Report study. The following paragraphs summarize these events. Endangered Species Status: In 1994 the Southwestern Willow Flycatcher and the Rio Grande Silvery Minnow, both of which inhabit the study area, were added to the Federal Endangered Species List under the provisions of the Endangered Species Act. Additionally, the study reach is within designated critical habitat for both species As a result, the United States Fish and Wildlife Service has repeatedly requested that the Corps of Engineers evaluate the impacts of Corps of Engineers projects (units) on a total project basis and not by individual units. Rio Grande Basin Hydrologic Computations: In 1994 and 1995, while conducting the Espanola, New Mexico, feasibility investigations, a revised method of computing the hydrologic outputs of watersheds within the middle Rio Grande valley was developed. This method identifies not only the impacts due to peak flood discharges, but also the impacts due to long duration, spring runoff flood events. As a result, alternatives under consideration in the middle valley must include features to mitigate against both these water resource impacts. Because the authorized plan essentially addressed only impacts due to peak flood discharges, additional analyses and design are now required. Sponsor Financial Capabilities: In 1998, as separate limited reevaluation studies were being finalized for the Belen East and West units, and the San Acacia to Bosque del Apache, Rio Grande Floodway projects, the MRGCD made a decision to proceed with the San Acacia project before the Belen project. This decision was largely due to their financial capabilities. It therefore became necessary to focus on the completion of the San Acacia GRR and delay the completion of the GRR studies for the Belen units. Cost Analysis: The authorized project included five units (Corrales, Mountain View, Isleta, Belen East and Belen West). While the General Design Memorandum was being completed for the project in 1986, the Mountain View and Isleta Units were dropped from further consideration because changes in cost rendered them economically infeasible. The benefit/cost ratios dropped to 0.7:1 for Mountain View and 0.9:1 for Isleta West. With the completion of the construction of the Corrales Unit in 1997, and analyzing the actual costs of the Corrales Unit, the local sponsor believes that the Mountain View and 11
11 Isleta Units would be economically justified. The District also believes this to be true. Preliminary analysis indicates that both the Mountain View and Isleta Units would be economically justified. The Middle Rio Grande Conservancy District has requested by a letter dated December 3, 1997 that the Albuquerque District undertake studies to include the Mountain View and Isleta Units as originally authorized. As discussed earlier, the Albuquerque District of the Corps of Engineers has previously studied flood protection for the project area. The hydrologic and hydraulic analyses that have been performed, and the sedimentation issues analyzed, have used the most up-to-date hydraulic models that were available, whether HEC-2 or HEC-RAS. Sediment is a topic of great relevance to the project area. Reports on this topic include: US Army Corps of Engineers, Rio Grande and Tributaries, New Mexico. U.S. Army Corps of Engineers, Sediment Yield Analysis from Rio Grande Tributary Basins between Cochiti Dam and Elephant Butte Reservoir, prepared by Resource Technology, Inc. Additionally, the USACE Upper Rio Grande Water Operations Project (URGWOP) is presently evaluating sediment in the project area as it relates to reservoir operations. 3.0 Hydrology 3.1. Purpose of Hydrology Study The purpose of the hydrology study is to estimate frequency flows in the Rio Grande through the project area. Some of the applications are: The hydrology will be used to evaluate the potential of flooding with and without a proposed flood control levee in the project area. The hydrology will be used as the basis for with- and without-project floodplains. Economic benefits for flood frequency events will be estimated based on the hydrology. Figure 2 is a map that shows the Albuquerque watershed together with major subwatersheds. Figure 3 shows the annual average precipitation in New Mexico. The Hydrologic Analysis presented herein has undergone independent technical review (ITR) and has been certified by the Albuquerque District U.S. Army Corps of Engineers. Copies of the ITR Certification are included as Attachment 6. Figure 2 - Albuquerque Watershed 12
12 13

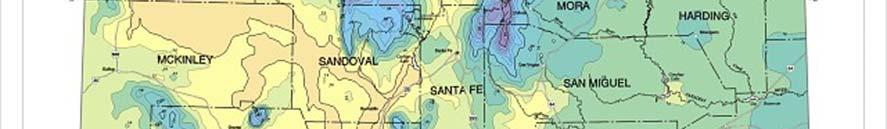
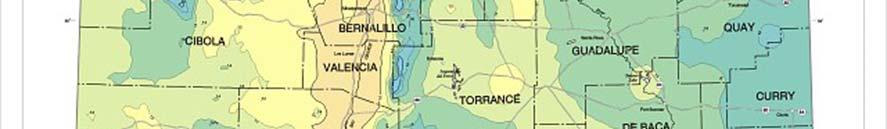

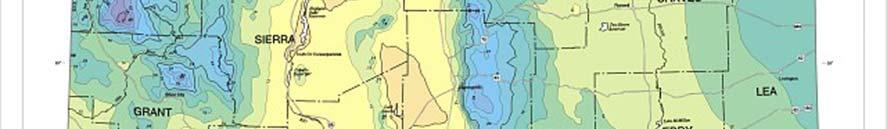
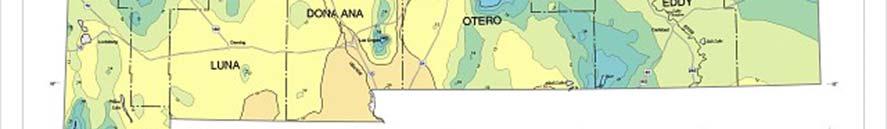
13 Figure 3 - Average Annual Precipitation in New Mexico (NRCS) 14
14 3.2. Overview of Hydrology in the Project Area Hydrology at Albuquerque The Rio Grande watershed upstream of Albuquerque is comprised of 17,440 square miles, of which 16,535 square miles is regulated by dams. Cochiti Dam is 48 river miles upstream of Albuquerque at the gage, and it directly regulates the Rio Grande upstream of the Albuquerque gage. The area of the Cochiti Dam watershed is 14,900 square miles. The dam is located on the Cochiti Pueblo in Sandoval County, NM. The Jemez Canyon Dam, also in Sandoval County, NM, controls 1034 square miles of the Jemez River watershed. The Jemez River confluence with the Rio Grande is 25 river miles upstream of the Albuquerque gage. The Jemez Canyon Dam is presently operated as a dry dam, though it has had a permanent pool for approximately half of the 44 years it has been in service. Galisteo Dam is a dry dam that controls 600 square miles of the Galisteo Creek watershed. Galisteo Creek enters the Rio Grande 46.5 miles upstream of Albuquerque. Downstream of these structures, another 900 square miles are unregulated and also contribute directly to flooding in the Rio Grande floodway in Albuquerque. The Middle Rio Grande Flow Frequency Study (2006 HEC report) is a study of flood frequencies for the Rio Grande in Albuquerque. The location in Albuquerque for this hydrology is the Rio Grande at the Central Avenue Bridge, where the Albuquerque gage is located. The HEC Middle Rio Grande flow frequency is a combined frequency based on Regulated flood flows from the reservoirs upstream of Albuquerque, predominantly snowmelt floods, and Flood flows from unregulated local areas downstream of the reservoirs, primarily from rainfall runoff. This study was done in 2006 by the Hydrologic Engineering Center (HEC), and the results were used to develop the Rio Grande hydrology in the project area. Figure 4 is the combined frequency curve for the Rio Grande at the Albuquerque gage. The Albuquerque levee was designed prior to Cochiti Dam being constructed. The design flow for the Albuquerque levee was 42,000 cfs. The present day probability of a flow of 42,000 cfs is significantly different than it was before the dams were put into operation. The probability of a flood flow of 42,000 cfs was determined by extrapolating it from the combined frequency curve. It is , and the return period is 5,950 years. 15
15 Figure 4 - Combined Peak Flow Frequency Curve for the Rio Grande at the Albuquerque Gage, from the 2006 HEC Report Percent Chance Exceedance Flow (1,000 cfs) Exceedance interval in years Local Runoff Curve Snowmelt Curve Combined Curve MIDDLE RIO GRANDE RIVER RIO GRANDE RIO GRANDE AT ALBUQUERQUE Combined Frequency Curve U.S ARMY CORPS OF ENGINEERS 16
16 Summary of Hydrologic Analysis in the Project Area There are three potential sources of Rio Grande flooding in the project area downstream of Albuquerque. They are: Flood events in the regulated area upstream of Albuquerque, as identified in the 2006 HEC report. Rainfall-runoff flood events in the unregulated area upstream of Albuquerque, as identified in the 2006 HEC report. Rainfall-runoff flood events from the project area, downstream of Albuquerque. A single inflow to the Rio Grande, the South Diversion Channel (SDC) south of Albuquerque, provides the only potential for significant local inflow between the Albuquerque gage and the downstream end of the project area. Snowmelt events from tributaries are not a factor downstream of Cochiti, Galisteo and Jemez Canyon Dams. The tributary areas are relatively small (typically less than 200 square miles), and all have significant variability in the range of elevations present. For example, the elevation of the Tijeras Arroyo at its downstream gage is 5000 ft. NGVD 1929 and the drainage area is 128 square miles. The elevation in the highest part of the Tijeras Arroyo watershed exceeds 9,500 feet. The snowpack that can accumulate during winter and spring months at high elevations are exposed to warmer temperatures over a period of months depending on their elevation. Rapid warming is not normally experienced over the whole range of elevations. The result for small watersheds is very slow snowmelt over a period of months that does not produce runoff of significance. Individual flood flow frequencies are available for each of the three flooding sources. These frequencies are explained further in sections 3.2.3, 3.2.4, and below. The independence of the three flooding sources is discussed in section It is necessary to evaluate both with- and without-project conditions in order to meet Corps of Engineers requirements for feasibility level evaluation. In this study, flood flows from the three sources of flooding were routed separately downstream through the project area, in order to estimate their individual contributions to flooding in the project area. There are two separate scenarios for flood routing. One represents without-project conditions, which in this case is without a flood control project. It is assumed that the spoil bank levees, which are not engineered levees, will uniformly fail throughout the area. The second scenario represents with-project conditions, which in this case is assumed to be an engineered levee high enough to contain flooding. For each of the two flood routing scenarios, estimated flooding from each of the three sources was evaluated at selected locations. Then they could be combined to estimate the total flood flow frequency at each location for without-project and with-project conditions Independence of Flooding Sources Although it is not necessary for these flooding sources to be independent, when they are, it simplifies application of the combined probability equation. It was established in the 2006 HEC report that the two sources of flooding at the Albuquerque gage (flooding from regulated areas above dams and the unregulated rainfall runoff flooding) are independent of one another. In the project area, downstream of the Albuquerque gage on the Rio Grande, flow from the third source, the SDC, must also be considered. Table 1 provides data that indicate that flooding from the SDC is independent of flooding in the Rio Grande. The record of instantaneous peak flows is given for years that have gage data for 17
17 Table 1 - Record of Instantaneous Peak Flows for the Rio Grande and the Tijeras Arroyo Water Year Gage Tijeras Arroyo at the SDC Gage Rio Grande in Albuquerque Date of Peak Peak Q (cfs) Date of Peak Peak Q (cfs) Difference in Dates of Peak Flow in Days /12/ /18/ /26/ /11/ /27/ /25/ /18/ /20/ /5/ N/A /30/ ~ /24/ No Data N/A /15/ /14/ /14/ /23/ /22/ ~ /30/ ~ /4/ /28/ /25/ /19/ /17/ /2/ /24/ /10/ /2/ /3/ No Data No Data 6/17/ N/A 1970 No Data No Data 10/23/ N/A 1971 No Data No Data 7/27/ N/A /18/ /15/ /9/ /14/ /9/ /1/ /12/ /24/ /19/ /21/ /14/ /18/ /6/ /24/ /17/ /1/ /14/ /14/ /11/ /21/ /1/ /2/ /29/ /10/ /7/ /28/ /15/ /24/ /25/ /11/ /22/ /24/ /9/ /9/ /2/ /25/ /14/ /29/ /24/ /7/ /11/ /29/ /20/ /7/ /20/ /11/ /22/ /25/ /28/ /27/ /28/ /8/ /26/ /9/ /3/ /28/ /3/ /20/ /23/ /22/ /19/ /10/ /21/ /21/ No Data No Data 4/3/ N/A 18
18 both the Tijeras Arroyo gage at the SDC and the Albuquerque gage. The difference calculation between the dates of the peaks is shown in days, to establish which flows are coincident. The frequencies of the flooding events given above were established graphically, in order to check the significance of coincident flows. The combined frequency curve from the 2006 HEC report for the Rio Grande at the Albuquerque gage, shown previously in Figure 4, was used to estimate frequency of Albuquerque flows. A graph of the USGS flood frequency analysis for the Tijeras Arroyo gage at the SDC, shown in Figure 5, was used to estimate the frequency of floods on the Tijeras Arroyo. More information about flood frequency studies for the Tijeras Arroyo is given in Section The 50-year record displayed in Table 1 indicates that there are only three dates on which instantaneous peak flows have occurred on both the Rio Grande at Albuquerque gage and the Tijeras Arroyo gage. 8/14/1980. The flow on the Rio Grande peaked at 7600 cfs, approximately equivalent to a 25% chance flood event. The flow from the Tijeras Arroyo peaked at 980 cfs, approximately the 40% chance flood event. 7/9/1988. The flow on the Rio Grande peaked at 4820 cfs, less than the 50% chance flood event. The flow from the Tijeras Arroyo peaked at 2930 cfs, approximately the 1.5% chance flood event. 3/21/2003. The flow on the Rio Grande peaked at 1880 cfs, less than the 50% chance flood event. The flow from the Tijeras Arroyo peaked at 331 cfs, also less than the 50% chance flood event. Of these coincident flows, only one from the Tijeras Arroyo is greater than the 20% chance flood event and it coincides with a flow that is less than the 50% chance event on the Rio Grande. None of the coincident flows on the Rio Grande is greater than a 20% chance flood event; therefore coincident flows are not a significant factor in serious flood events. It follows that flooding from the Tijeras Arroyo can be considered to be independent of flooding in the Rio Grande Flood Events from Regulated Areas The 2006 HEC report includes a frequency analysis for floods from regulated areas contributing to Rio Grande flooding at the Albuquerque gage. These are predominantly snowmelt flood events. Table 2 includes flood peaks associated with the frequency flood events. Hydrographs for these floods are plotted in Figure 6. These hydrographs were provided to the Albuquerque District by the HEC for use in flood routing models Flood Flows from Unregulated Areas - Albuquerque and Upstream The 2006 HEC hydrology for Albuquerque includes a frequency analysis for floods from unregulated areas contributing to Rio Grande flooding at the Albuquerque gage. These floods are associated with rainfall runoff events. Table 2 includes flood peaks from unregulated areas associated with the frequency flood events. Figure 7 is the HEC dimensionless hydrograph for floods from unregulated areas upstream of Albuquerque. It was provided to the Albuquerque District by the HEC together with the 2006 HEC report Flood Flows from Rainfall Runoff Events in the Project Area Watershed Characteristics of the South Diversion Channel The South Diversion Channel (SDC) is the only major arroyo that directly enters the Rio Grande between the Albuquerque gage at Central Avenue and the downstream study limit. Flow from 19
19 other tributaries to the Rio Grande through the study area is blocked by levees and does not reach the river. Figure 5. USGS Flood Flow Frequency for Gage , Tijeras Arroyo near Albuquerque, Located at its Confluence with the SDC Percent Chance Exceedence Flow (100 cfs) The SDC enters the Rio Grande from the east immediately south of Albuquerque. The SDC includes 2 separate drainage areas. The South Diversion Channel watershed proper is 11 square miles, and is not of adequate size to affect the hydrology of the river. The Tijeras Arroyo drainage area is 128 square miles. A map of the SDC and Tijeras Arroyo watersheds is provided in Figure 8. The Tijeras Arroyo watershed is a fan-shaped area lying to the southeast of Albuquerque. The arroyo is 28 miles in length. The upstream portion of the Tijeras Arroyo begins on the east side of the mountains, follows the fault line between the Sandia and Manzano mountains and emerges as a canyon onto a broad, sloping plain, or mesa, near Kirtland Air Force Base (KAFB). Mountainous uplands comprise 20
20 approximately 60% of the area of the Tijeras Arroyo watershed. The channel between the upstream border of KAFB to the upstream limit of the Village of Tijeras is 11.6 miles in length and its slope is approximately.016. Table 2 - Peak Flood Flows for the Rio Grande Gage in Albuquerque (at Central Avenue) both from Upstream Regulated Areas and Upstream Unregulated Areas Return Period (Years) % Chance Exceedance Flood Events from Regulated Areas- Peak Flows in cfs Flood Events from Unregulated Areas- Peak Flows in cfs Figure 6. Hydrographs at the Albuquerque Gage for Flood Events from Regulated Areas Upstream of Albuquerque (Provided to the Albuquerque District by the HEC as Supplemental Information to the HEC 2006 Report) 21
21 Figure 7. Dimensionless Hydrograph at the Albuquerque Gage for Flood Events from Unregulated Areas Upstream of Albuquerque (Provided to the Albuquerque District by the HEC as Supplemental Information to the HEC 2006 Report) 22

22 Figure 8. South Diversion Channel (SDC) and Tijeras Arroyo Watersheds Approximately 13 stream miles are located on the mesa. The mesa is considerably flatter than the reach upstream, and the average slope of the channel is.009. The Tijeras Arroyo valley is generally about 2,000 feet in width, with a channel that is deep and narrow in some reaches and wide, shallow, and poorly defined in others. Figure 9 shows the 100-year 6-hour isopluvials for New Mexico from NOAA Atlas 14. The Tijeras Arroyo watershed is predominantly semiarid. Average annual precipitation varies from 7 inches at the lowest elevations (4930 ft.) to 18.1 inches at Sandia Park (elevation 7000 ft.) Approximately half of the precipitation occurs from July to September in the form of brief but intense thunderstorms. It is these thunderstorms that produce peak local flows, and are the storms of interest for the SDC hydrology. 23

23 H&H Appendix H Figure 9. Isopluvials of the 100-Year 6-Hour Precipitation Depth in Inches for New Mexico, from NOAA Atlas 14 24
24 Previous Hydrologic Studies for the Tijeras Arroyo Previous hydrologic studies that have been performed for the Tijeras Arroyo include: Albuquerque Metropolitan Arroyo Flood Control Authority, Tijeras Arroyo Drainage Management Plan, prepared by Bovay Engineers, Inc. City of Albuquerque, Tijeras Arroyo Drainage Management Plan Phase I, prepared by Leedshill Herkenhoff, Inc. City of Albuquerque, Tijeras Arroyo Drainage Management Plan Phase II, prepared by Leedshill Herkenhoff, Inc. Federal Emergency Management Agency, Flood Insurance Study, Bernalillo County, New Mexico, and Incorporated Areas. U.S. Army Corps of Engineers, Albuquerque Diversion Channels Project, Rio Grande and Tributaries, New Mexico, and Vicinity, Design Memorandum No. 2, (DM 2). U.S. Army Corps of Engineers, Albuquerque Diversion Channels Project, Rio Grande and Tributaries, New Mexico, Design Memorandum No. 1, Hydrology (DM 1). U.S. Army Corps of Engineers, Kirtland Air Force Base, New Mexico, Hydrology. U.S.G.S., Methods for Estimating Magnitude and Frequency of Floods in the Southwestern United States, Water-Supply Paper These hydrologic studies provide estimates for flood magnitudes based on several analytic methods. The USGS study is a flood frequency analysis based on gage data. The others use numeric hydrologic models. The studies have produced a range of results, though the hydrologic model results have been similar. Figure 10 shows frequencies that have been derived for the Tijeras Arroyo from previous studies. 25
25 Figure 10. Peak Flood Frequencies for Tijeras Arroyo at Gage , Tijeras Arroyo North of Kirtland AFB, from Four Agencies Percent Chance Exceedence Flow (1,000 cfs) Corps USGS City of Albq FEMA Factors in the Tijeras Arroyo Hydrology Floods in the Tijeras Arroyo typically produce flood hydrographs that peak quickly and are low in volume. As a flood moves through the watershed, marked attenuation of the peak occurs. Based on gage data, relatively high peaks come from the mountainous upstream area and attenuate on the mesa before reaching the confluence of the Tijeras Arroyo with the SDC. The 26-mile channel is unlined, other than a mile of the Tijeras Arroyo on the mesa that is concrete lined. Even so, channel losses through infiltration are not likely to be a major factor. Based on the limited data that is available for peak and one-day flood flows, flood flows are of short duration. Infiltration is time dependent. The time that is needed for infiltration to occur in the 26-mile channel is a limiting factor. Streams in the Albuquerque area generally produce large quantities of sediment. Several of the studies listed in Section 5.2 provide information about sediment in the Tijeras Arroyo watershed, as well as the hydrology of the watershed. 26
26 DM #1 (Corps of Engineers, 1956) states that the bed load coming from the Tijeras Arroyo at its confluence with the SDC is predominantly sand. According to DM #2 (Corps of Engineers, 1964), 36 acre-feet of sediment comes from the Tijeras Arroyo annually. A study was performed in 1994 by Resource Technology, Inc. (RTI) for the Corps of Engineers to analyze sediment yield in the Rio Grande tributary basins. RTI computed an average annual sediment load of 44.2 acre-feet for Tijeras Arroyo Methods of Evaluating the SDC/ Tijeras Arroyo Hydrology Hydrology of watersheds is often evaluated either with hydrologic models or by using frequency analysis. For the Albuquerque hydrology, the HEC evaluated the hydrology of local inflows between river gages as a group, based on river gage data. The SDC is the only local flow of significance, but even so its hydrology cannot be analyzed using that methodology. The nearest downstream gage with a meaningful period of record is located at Bernardo, 47 miles downstream from the confluence of the SDC with the Rio Grande. Significant flow attenuation is a factor in the reach, and prevents that data from being useful to analyze the SDC hydrology Flood Frequency Analyses As many as 9 stream gages have been in operation at various times in the Tijeras Arroyo watershed. Two of the gages in the watershed have records of instantaneous peaks that are adequate for flood frequency analyses. These are gages and The gage at the downstream end of Tijeras Arroyo and above its confluence with the SDC (gage ) is Tijeras Arroyo near Albuquerque, NM. A second gage within the Tijeras Arroyo watershed (gage , discontinued) is Tijeras Arroyo at Albuquerque, NM. Because the gage names are so similar, the gage numbers are used for reference in this report. The drainage area of Tijeras Arroyo immediately above its confluence with the SDC (gage ), is 128 square miles. It has 49 years of instantaneous peaks, as of January, The average elevation for the channel is 5,930 ft. At this stream gage, the 24-hour precipitation for the 10% chance storm event is 1.72 inches, based on point precipitation frequency estimate from NOAA Atlas 14. Because of flow losses and attenuation, this peak is less than the peak recorded flow 6 miles upstream. Based on approximately 50 years of gage records, the maximum recorded flow is 2,930 cfs. In its 1997 report, the USGS estimated the 1% chance flood flow to be 5,140 cfs. The drainage area of gage is 75 square miles. It has 51 years of recorded instantaneous peaks, as of January, The gage is located 6 miles upstream of the confluence of the Tijeras Arroyo and the SDC, at the mouth of Tijeras Canyon, where it captures runoff from the upstream mountainous areas. The average elevation for the channel is 6,380 ft. In close proximity to gage , at the Albuquerque Sunport (airport), the 24-hour precipitation for the 10% chance storm event is 1.74 inches, based on the point precipitation frequency estimate from NOAA Atlas 14. The maximum recorded flow at gage , based on approximately 50 years of gage records, is plotted in Figure 10, together with other agency flood frequency estimates for the same location. The 1% chance flood flow estimate from the 1997 USGS analysis is 11,500 cfs Hydrologic Models from Previous Studies In order to estimate frequency floods at the mouth of Tijeras Arroyo, HEC-1 models were used for the 1979 Corps of Engineers study and for the 1990 City of Albuquerque study of Tijeras Arroyo. The 2003 FEMA study used the AHYMO model. The 1979 Corps of Engineers study covers a 27
27 smaller drainage area than the others, stopping upstream of the confluence of Tijeras Arroyo with the SDC at the KAFB boundary. The study results compare well with each other for similar drainage areas. Table 3 provides results of these results. Major differences are: Inconsistencies are found in the two studies that extend to the mouth of Tijeras Arroyo at that location. Typically, estimated flows resulting from hydrologic models increase in the downstream direction, as do the model results from the 1990 City of Albuquerque study. The 2003 FEMA study resulted in lower peak flows downstream at the confluence with the SDC than the estimated peak flows 6 miles upstream at gage The reduction in flood peaks can be justified based on gage data. Dissimilarities are found in the model results for the 0.2% chance floods Flood Frequency for the Tijeras Arroyo at its Confluence with the SDC Because the hydrologic model results are reasonably consistent, it was concluded that a composite of the model results could be used to estimate Tijeras Arroyo flows entering the Rio Grande. The purpose of this study is to evaluate flood reduction alternatives for the Rio Grande. Table 4 shows peak flow frequency values for the Tijeras Arroyo that were used for this study. Figure 11 is a graph of the flood frequency adopted for use in this study Volume of Flooding on the Tijeras Arroyo The 1990 City of Albuquerque analysis provided flood hydrographs as well as peak flows. These are 6-hour hydrographs that correspond with the 6-hour design storm. The hydrographs are shown in Figure 12 for several frequencies. 28
28 Table 3 - Hydrologic Model Results from Studies on the Tijeras Arroyo Location Recurrence Interval Hydrologic Model Corps of Engineers (1979) North of Kirtland AFB City of Albuquerque (1990) Flow on the Tijeras Arroyo in cfs FEMA (2003) Mouth of Tijeras Arroyo City of Albuquerque (1990) FEMA (2003) HEC-1 HEC-1 AHYMO HEC-1 AHYMO Table 4 - Peak Flood Flows Entering the Rio Grande from the Tijeras Arroyo Recurrence Interval Peak Flow (CFS) Notes From the 1990 City of Albuquerque hydrology Graphical solution From the 1990 City of Albuquerque hydrology FEMA 2003 (coincides w graphical solution) From the 1990 City of Albuquerque hydrology Graphical solution From the 1979 Corps of Engineers hydrology It should be noted that all of the hydrologic models for the Tijeras Arroyo used 6-hour duration storms. The Albuquerque Airport is located on the northern border of the Tijeras Arroyo watershed, near its western edge. The point precipitation frequency estimates from NOAA Atlas 14 at the Albuquerque Airport were downloaded from the NWS Precipitation Frequency Data Server. Those precipitation frequency estimates are shown in Table 5 for the 6-hour, 12-hour, 24-hour and 48-hour storms, together with the percentage of change in precipitation as compared with the 6-hour storm event for the longer storms. As the storm duration increases, the increase in the amount of precipitation is fairly flat. Significant infiltration occurs over the Tijeras Arroyo watershed, but since infiltration is time-dependent, it is less of a factor in the volume of runoff for a 6-hour storm event than for a longer storm event. It can be concluded that the shorter duration 6-hour storm is appropriate to use as the design storm. In order to verify that the 6-hour hydrographs are appropriate for the FLO-2D frequency flood flow routing, the volume of historic flood hydrographs was evaluated to the extent possible. One-day flows are provided by the USGS for gage from 10/1/1982 through 9/30/2004. For gage these data are available from 4/1/1943 through 6/30/1949. The annual maximum oneday flows greater than 40 cfs are shown on Table 6, for both gages. Also shown are corresponding annual instantaneous peaks and ratios of annual instantaneous peaks to annual maximum one-day flows. 29
29 Figure 11. Composite Flood Frequency Curve for the Tijeras Arroyo at its Confluence with the SDC Percent Chance Exceedence Flow (1,000 cfs) Figure 12. Frequency Flood Hydrographs from the Tijeras Arroyo Frequency Hydrographs from the SDC Time (hrs) 500-Yr Q 100-Yr Q 10-Yr Q 2-Yr Q 50-Yr Q 30
30 Table 5 - Comparison of Point Precipitation Frequencies for Different Duration Storm Events Average Recurrence Interval (Years) Point Precipitation Frequency Estimates at the Albuquerque Airport Precipitation Frequency Estimate (Inches) % Change from 6-Hour Event 6 hour 12 hour 24 hour 48 hours 12 hour 24 hour 48 hours Table 6 - Correspondence of Annual Maximum One-Day Flows with Annual Instantaneous Peak Flows at Gages on Tijeras Arroyo Annual Peaks Corresponding to Mean Daily Peaks (Mean Daily Peaks Greater Than 40 CFS) Gage Day Flows Recorded from 4/1/1943 to 6/7/1949 Annual Max 1-Day Q Date of 1-D Max Q Inst Peak Q Date of Inst Peak Pk/1-d 240 9/27/ /19/ /19/ /22/ /22/ /19/ /11/ /31/ /4/ /4/ Gage Day Flows Recorded from 10/1/1982 to 9/30/2004 Annual Max 1-Day Q Date of 1-D Max Q Inst Peak Q Date of Inst Peak Pk/1-d 122 7/9/ /9/ /15/ /3/ /22/ /22/ /11/ /15/ /15/ /14/ /14/ /4/ /13/ /3/ /3/ /28/ /28/ /9/ /23/
31 Annual maximum one-day flows correspond with annual maximum one-day storm volumes. Figure 4 clearly shows that 1-day peak flows can be expected to be less than an order of magnitude of the corresponding instantaneous peaks. This suggests that flood events on Tijeras Arroyo can be expected to have short durations, and that a 6-hour hydrograph can therefore be used to represent flood flows from this watershed Routing of Flood Components through the Project Area The FLO-2D Flood Routing Model Frequency flood events for three sources of flooding (regulated and unregulated floods in Albuquerque and floods from the SDC) were routed downstream in the Rio Grande to evaluate the characteristics of these floods as they move through the project area. A map of the project area was previously shown in Figure 1. A FLO-2D model was used for routing. FLO-2D is a 2-dimensional unsteady flow numeric model that can be used to evaluate hydraulics in floodplains and open channels. It is used for several projects in the Middle Rio Grande and is well suited for modeling overbank flows. The FLO-2D model reach was the Rio Grande between the Rio Grande gage at Central Avenue in Albuquerque and the Rio Grande gage at Bernardo. The flood routing models are very conservative, in that losses from infiltration and evaporation are not included. Two model scenarios are provided. The without-project scenario for the hydrologic routing model represents existing conditions. The spoil bank levees were removed from the model, to reflect the Corps of Engineers assumption that non-engineered levees will not remain viable in a flooding situation. A second model scenario represents with-project conditions. It is essentially the same model, but the proposed levee is represented in the model data, to evaluate flood conditions with the proposed project. Cross sections extending across the floodplain were selected throughout the reach for evaluating the flood routing with the FLO-2D Model. This was done in order to evaluate the maximum flow passing a given section through the channel, the floodway, and the floodplain at a given time. The criteria for selecting cross section locations were based on the need to capture the hydraulic characteristics of the flooding. Cross sections used in this analysis are listed in Table Hydrographs Used for Routing The HEC, as part of the 2006 Middle Rio Grande Flow Frequency Study, provided hydrographs at the Albuquerque gage both for local unregulated flood events and floods from regulated areas. The flood hydrographs from the regulated areas are shown in Figure 5. They were patterned using hypothetical flood events. The flood hydrographs for the unregulated floods were based on dimensionless hydrographs that the HEC provided. The dimensionless hydrographs, plotted in Figure 6, were scaled to provide flood peaks that correlate with frequency flood flows for Albuquerque floods from unregulated upstream areas, shown in Table 2. Hydrographs used for routing flood flows from the Tijeras Arroyo are shown in Figure 11. See Section 5 for the derivation of these hydrographs. Normally, rainfall runoff events occur in the months of July through October. A flow of 500 cfs is typical in the Rio Grande during those months, and a steady flow of 500 cfs was used in the FLO-2D model as the base flow in the Rio Grande. The results of routing the flood flows were later used in a combined frequency at locations in the study reach. Before using the routing results in a combined frequency, the 500 cfs was subtracted from the flow at each cross section. 32
32 Table 7 - Cross Sections Used in Analyzing the Project Area Downstream of the Albuquerque Gage for the Without-Project Condition X-sec # Range River FLO-2D Line Mile Grid # Location Gage Central Ave. Bridge, Albuquerque Rio Bravo Bridge, Albuquerque Below Tijeras Arroyo Confluence (SDC) End of West Side Albuquerque Levee I-25 Bridge Isleta Railroad Bridge Isleta Bridge (Rt. 147) Bosque Farms Bridge at Los Lunas (Rt. 6) Los Chaves Bridge at Belen (Rt. 309) Belen RR Bridge Downstream end of project area Results of FLO-2D Flood Routing for the Without-Project Condition The FLO-2D routing results for the chosen cross sections are listed in Tables 8 through 10 and plotted in Figures 13 through 15. Snowmelt flooding is controlled, for the most part, by reservoirs. Reservoir releases from Cochiti Dam resulting from snowmelt flooding typically occur as a steady flow in the Rio Grande that can take place over a period of months. Present guidance for the magnitude of these reservoir releases is 7,000 cfs, though it has been higher at times in the past. The steady long-term portion of snowmelt floods has no significant attenuation. Flow over the spillway can also result from snowmelt floods coming from upstream of the reservoirs, and is expected to begin between the 1% chance and the 0.5% chance flood events. For the 0.5% and 0.02% chance regulated flow hydrographs spillway flow occurs in addition to reservoir releases, but unlike reservoir releases the flow is not controlled. Routing peak flow which comes from rainfall runoff events shows significant attenuation through the 35-mile study reach. One factor leading to the high amount of attenuation for the rainfall-runoff events is the relatively low volume of the high peak hydrographs. That is not the case for spillway flow. Figures 13 and 14 illustrate the differences in the flood routings for spillway flow (0.5% and 0.2% chance events in Figure 13) and rainfall-runoff flooding (Figure 14). It can be seen that the attenuation for spillway flow is gradual, where as for rainfall-runoff flooding attenuation is dramatic. Another of the causes for the attenuation is the large volume of storage available in the channel, which is wide and shallow. Widths typically range from 500 feet to about 600 feet, with flow depths on the order of 4 feet for the 10% chance flood event. Attenuation is also related to the large amount of flow in the floodplain and overbanks. There is significant storage in the overbanks, even for the with-project model. Overbank flow, because of vegetation in the overbanks, is slower than channel flow, and delays the portion of the flood peak that is not carried in the channel, thus reducing flood peaks. 33
33 Table 8 - Without-project Flood Peaks after Routing - Albuquerque Floods from Regulated Areas Upstream X-sec # Range Line River Mile 50% 20% 10% 2% 1% 0.5% 0.2% QP (cfs) QP (cfs) QP (cfs) QP (cfs) QP (cfs) QP (cfs) QP (cfs) Gage Table 9 - Without-project Flood Peaks after Routing- Albuquerque Floods from Unregulated Areas Upstream X-sec # Range Line River Mile 50% 20% 10% 2% 1% 0.5% 0.2% QP (cfs) QP (cfs) QP (cfs) QP (cfs) QP (cfs) QP (cfs) QP (cfs) Gage In the without-project scenario, there is another factor leading to attenuation of flood peaks. The floodway, between the levees, is generally elevated above the historic floodplain, due to deposition of sediment between the levees. The difference in elevation between the floodway and the historic floodplain is approximately 5 to 10 feet. Other than the Corrales to Albuquerque reach, most of the Rio Grande is bordered by spoil bank levees. In the without-project scenario, the spoil bank levees are assumed to fail and floodwaters are lost from the perched river to the lower floodplains. Their return to the river is greatly delayed or simply does not occur. This phenomenon greatly reduces the flood peaks. 34
34 Table 10 - Without-project Flood Peaks after Routing- Floods from the Tijeras Arroyo 2-YR 5-YR 10-YR 50-YR X-sec Range River QP QP QP QP YR QP YR QP # Line Mile (cfs) (cfs) (cfs) (cfs) (cfs) (cfs) 500- YR QP (cfs) Gage N/A N/A N/A N/A N/A N/A N/A N/A N/A N/A N/A N/A N/A N/A Figure 16 is a graph of the results of the without-project routing of 1% chance floods from the three sources of flooding in the project area. It illustrates the difference in attenuation for flooding from regulated areas, which are primarily steady flow snowmelt flood events, as opposed to flooding from rainfall runoff flood events. It also shows how floods from the three flooding sources can dominate flooding in the river at different locations. 35
35 Figure 13. Rio Grande at Albuquerque Routed Without-Project Flood Hydrographs from the Controlled Upstream Area Routed Peaks for Albuquerque Regulated Frequency Flood Events Flow (cfs) 2-YR QP 5-YR QP 10-YR QP 50-YR QP 100-YR QP 200-YR QP YR QP River Mile from the Albuquerque Gage (River Mile 183.4) through the Project Area Figure 14. Rio Grande at Albuquerque Without-Project Routed Flood Hydrographs from the Uncontrolled Upstream Area Routed Peaks for Albuquerque Unregulated Rainfall-Runoff Frequency Floods River Mile from the Albuquerque Gage (River Mile 183.4) through the Project Area 0 Flow (cfs) 2-YR QP 5-YR QP 10-YR QP 50-YR QP 100-YR QP 200-YR QP 500-YR QP 36
36 Figure 15. Rio Grande at Albuquerque Routed Without-Project Flood Hydrographs from the Tijeras Arroyo Routed Peaks for Tijeras Arroyo Frequency Flood Events River Mile from the Albuquerque Gage (River Mile 183.4) through the Project Area Flow (cfs) 2-YR QP 5-YR QP 10-YR QP 50-YR QP 100-YR QP 200-YR QP 500-YR QP Figure 16. FLO-2D Without-Project Routing of 1% Chance Flooding from the Three Independent Flooding Sources Routed 100-Year Frequency Flood Events through the Project Area Flow (cfs) 100-YR ABQ Unreg. Rainfall Floods 100-YR ABQ Regulat ed Floods 100-YR Tijeras Arroyo River Mile from the Albuquerque Gage (River Mile 183.4) through the Project Area 37
37 Results of FLO-2D Flood Routing for the With-Project Condition The FLO-2D routing was performed for both the current With-Project Condition (2008) and future With-Project Condition (2058). For the purposes of With-Project flood routing, engineered levees were assumed to exist for the entire length of the project in the same location as the existing Rio Grande setback spoil bank levees. This was considered to be the most conservative approach for flood routing to determine levee height. Levee height assumed for the With-Project Condition was set to elevation 5020 (over 100 ft. high) to insure overtopping cannot occur. Results of flood routing for the selected cross sections are listed in Tables 12 through 14 for the current With- Project Condition (2008). These cross sections were selected based on damage reaches and locations where attenuation would suggest a change in levee height and are given in Table 11. The MRG Levee Project will begin at cross section 3, the confluence of the Rio Grande with the South Diversion Channel (SDC) and continue downstream to a railroad crossing of the Rio Grande at the south end of Belen, NM. Snowmelt flooding is controlled, for the most part, by reservoirs. Reservoir releases from Cochiti Dam resulting from snowmelt flooding typically occur as a steady flow in the Rio Grande that can take place over a period of months. Present guidance for the magnitude of these reservoir releases is 7,000 cfs, though it has been higher at times in the recent past since Cochiti was operational in There is a future operational target of 10,000 cfs for these reservoir releases. The steady long-term portion of snowmelt floods has no significant attenuation through the project reach. Spillway flow can also result from snowmelt floods coming from upstream of the reservoirs, and is expected to begin between the 1% chance and the 0.5% chance flood events. Spillway flow occurs in addition to reservoir releases, but unlike reservoir releases the flow is not controlled. Spillway flow can also be of long duration resulting in no significant attenuation. Routing of rainfall runoff events from the unregulated areas, unlike the regulated flow, shows significant attenuation through the 30-mile project reach. One factor leading to the high amount of attenuation for the rainfall-runoff events is the relatively low volume of the peak hydrographs. Another of the causes for the attenuation is the large volume of storage available in the channel, which is wide and shallow. Widths typically range from 500 feet to about 4,000 feet, with flow depths on the order of 4 feet for the 10% chance flood event. There is significant storage in the overbanks, even for the with-project model. Overbank flow, because of vegetation in the overbanks, is slower than channel flow, and delays the portion of the flood peak that is not carried in the channel, thus reducing flood peaks. Table 11 - Cross Sections Used in Analyzing the Project Area Downstream of the Albuquerque Gage for the With-Project Condition X-sec # Range River FLO-2D Line Mile Grid # Location 1 - Gage Central Ave. Bridge, Albuquerque Rio Bravo Bridge, Albuquerque Below Tijeras Arroyo Confluence (SDC) I-25 Bridge Below Isleta Bridge (Rt. Isleta Diversion Bosque Farms Bridge at Los Lunas (Rt. 6) Los Chaves Bridge at Belen (Rt. 309) Belen RR Bridge 38
38 Table 12 - Current With-project Condition (2008) Flood Peaks after Routing - Albuquerque Floods from Regulated Areas 2-YR 5-YR 10-YR 20-YR 50-YR 100-YR YR X-sec River QP QP QP QP QP QP YR QP QP # Mile (cfs) (cfs) (cfs) (cfs) (cfs) (cfs) (cfs) (cfs) Gage Table 13 - Current With-project Condition (2008) Flood Peaks after Routing - Albuquerque Floods from Unregulated Areas 2-YR 5-YR 10-YR 20-YR 50-YR X-sec River QP QP QP QP QP YR QP YR QP YR QP # Mile (cfs) (cfs) (cfs) (cfs) (cfs) (cfs) (cfs) (cfs) 1-Gage Table 14 - Current With-project Condition (2008) Flood Peaks after Routing - Floods from the Tijeras Arroyo 2-YR 5-YR 10-YR 20-YR 50-YR X-sec River QP QP QP QP QP YR QP YR QP YR QP # Mile (cfs) (cfs) (cfs) (cfs) (cfs) (cfs) (cfs) (cfs) 1-Gage N/A N/A N/A N/A N/A N/A N/A N/A N/A N/A N/A N/A N/A N/A N/A N/A
39 3.7. Combined Frequency in the Project Area Without-Project Combined Frequency At any given location, the combined frequency equation using three sources of flooding is: PC = PX + PY + PZ - PX PY - PX PZ - PY PZ + PX PY PZ where PX = Probability of reaching a given elevation in the Rio Grande with a flood from the regulated area upstream of Albuquerque PY = Probability of reaching a given elevation in the Rio Grande with a flood from the unregulated area upstream of Albuquerque PZ = Probability of reaching a given elevation in the Rio Grande with a flood from the South Diversion Channel PC = Combined frequency by joint probability theorem Tables 11, 13, 15, 17, 19, 21, 23, 25, 27, 29, 31, and 33 show the derivation of the combined frequencies (with the associated stage) for each of the selected cross sections. Rating curves were used to convert the channel flood stage to channel flows. Channel flow was then correlated with total cross section flow across the channel, floodway and floodplain. Tables 12, 14, 16, 18, 20, 22, 24, 26, 28, 30, 32, and 34 show the combined frequencies at each of the selected cross sections. From the top of the reach downstream to the Isleta Railroad Bridge, at River Mile 172.6, river flooding is dominated by rainfall-runoff storm events, both local to Albuquerque (Tijeras Arroyo) and from the uncontrolled area upstream of Albuquerque. From the Isleta Railroad Bridge downstream, river flooding is dominated by large volume snowmelt floods that are controlled by the reservoirs upstream of Albuquerque. Figure 16 illustrates this phenomenon. Figure 13 illustrates one characteristic of the snowmelt-dominated floods, that the snowmelt flooding is essentially constant as it moves downstream. Because reservoir releases occur over an extended period of time, typically several months for snowmelt frequency floods, losses due to attenuation are virtually non-existent. Other losses, such as water diversion for irrigation, cannot be assumed because they do not always occur. For the purpose of hydrology, then, the flood flows from Isleta downstream do not vary. Therefore the same frequency curve was used for these cross sections. Frequency curves are plotted in Figures 17 through 21. For a few of the cross sections, the 0.2% chance flood flows were not derived directly from the routed flood elevations. In those locations the 0.2% chance flood flows were derived graphically, and show as projected frequencies in the plots. Figure 21 shows the frequency flood peaks from the Isleta Railroad Bridge downstream to the lower end of the project reach. Also plotted in Figure 21 are points from frequency flows at several cross sections in the lower reach, in order to illustrate the scatter in the routed flows. The cross section flows that are plotted in Figure 21 are located where there is no bridge or other structure to interfere with flood flows. 40
40 Table 15 - Without-Project Combined Frequency Analysis Multiple Discrete Event Method at Cross Section 1, the Rio Bravo Bridge in Albuquerque Elevation (NAVD 88) Probability of Reaching Elevation with Flooding from the Regulated Area Upstream of Albuquerque Probability of Reaching Elevation with Flooding from the Unregulated Area Upstream of Albuquerque Probability of Reaching Elevation with Flooding from the South Diversion Channel Combined Frequency by Joint Probability Theorem ~1 ~1 ~ ~ ~ ~ ~ ~ ~0.002 ~ Table 16 - Without-Project Probability of Flood Flows at Cross Section 1, the Rio Bravo Bridge in Albuquerque Q (cfs) Probability Table 17 - Without-Project Combined Frequency Analysis Multiple Discrete Event Method at Cross Section 2, the South Diversion Channel Elevation (NAVD 88) Probability of Reaching Elevation with Flooding from the Regulated Area Upstream of Albuquerque Probability of Reaching Elevation with Flooding from the Unregulated Area Upstream of Albuquerque Probability of Reaching Elevation with Flooding from the South Diversion Channel Combined Frequency by Joint Probability Theorem ~1 ~1 ~ ~ ~0 ~ ~0 ~ Table 18 - Without-Project Probability of Flood Flows at Cross Section 2, the South Diversion Channel Q (cfs) Probability
41 Table 19 - Without-Project Combined Frequency Analysis Multiple Discrete Event Method at Cross Section 3, the End of the West Side Albuquerque Levee Elevation (NAVD 88) Probability of Reaching Elevation with Flooding from the Regulated Area Upstream of Albuquerque Probability of Reaching Elevation with Flooding from the Unregulated Area Upstream of Albuquerque Probability of Reaching Elevation with Flooding from the South Diversion Channel Combined Frequency by Joint Probability Theorem ~1 ~1 ~ ~0 ~ ~0 ~ Table 20 - Without-Project Probability of Flood Flows at Cross Section 3, the End of the West Side Albuquerque Levee Q (cfs) Probability Table 21 - Without-Project Combined Frequency Analysis Multiple Discrete Event Method at Cross Section 4, I-25 Bridge Elevation (NAVD 88) Probability of Reaching Elevation with Flooding from the Regulated Area Upstream of Albuquerque Probability of Reaching Elevation with Flooding from the Unregulated Area Upstream of Albuquerque Probability of Reaching Elevation with Flooding from the South Diversion Channel Combined Frequency by Joint Probability Theorem ~1 ~1 ~ ~0 ~ Table 22 - Without-Project Probability of Flood Flows at Cross Section 4, I-25 Bridge Q (cfs) Probability
42 Table 23 - Without-Project Combined Frequency Analysis Multiple Discrete Event Method at Cross Section 5, Isleta Railroad Bridge Elevation (NAVD 88) Probability of Reaching Elevation with Flooding from the Regulated Area Upstream of Albuquerque Probability of Reaching Elevation with Flooding from the Unregulated Area Upstream of Albuquerque Probability of Reaching Elevation with Flooding from the South Diversion Channel Combined Frequency by Joint Probability Theorem ~1 ~1 ~ ~ ~0 ~ Table 24 - Without-Project Probability of Flood Flows at Cross Section 5, Isleta Railroad Bridge Q (cfs) Probability Table 25 - Without-Project Combined Frequency Analysis Multiple Discrete Event Method at Cross Section 6, Isleta Bridge Elevation (NAVD 88) Probability of Reaching Elevation with Flooding from the Regulated Area Upstream of Albuquerque Probability of Reaching Elevation with Flooding from the Unregulated Area Upstream of Albuquerque Probability of Reaching Elevation with Flooding from the South Diversion Channel Combined Frequency by Joint Probability Theorem ~1 ~1 ~ ~0 ~ ~0 ~ Table 26 - Without-Project Probability of Flood Flows at Cross Section 6, Isleta Bridge Q (cfs) Probability
43 Table 27 - Without-Project Combined Frequency Analysis Multiple Discrete Event Method at Cross Section 7, Bosque Farms Elevation (NAVD 88) Probability of Reaching Elevation with Flooding from the Regulated Area Upstream of Albuquerque Probability of Reaching Elevation with Flooding from the Unregulated Area Upstream of Albuquerque Probability of Reaching Elevation with Flooding from the South Diversion Channel Combined Frequency by Joint Probability Theorem ~1 ~1 ~ ~0 ~ ~0 ~ ~0 ~ Table 28 - Without-Project Probability of Flood Flows at Cross Section 7, Bosque Farms Q (cfs) Probability Table 29 - Without-Project Combined Frequency Analysis Multiple Discrete Event Method at Cross Section 8, Bridge at Los Lunas Elevation (NAVD 88) Probability of Reaching Elevation with Flooding from the Regulated Area Upstream of Albuquerque Probability of Reaching Elevation with Flooding from the Unregulated Area Upstream of Albuquerque Probability of Reaching Elevation with Flooding from the South Diversion Channel Combined Frequency by Joint Probability Theorem ~1 ~1 ~ ~0 ~ Table 30 - Without-Project Probability of Flood Flows at Cross Section 8, Bridge at Los Lunas Q (cfs) Probability
44 Table 31 - Without-Project Combined Frequency Analysis Multiple Discrete Event Method at Cross Section 9, Intermediate Location between Los Lunas and Belen Elevation (NAVD 88) Probability of Reaching Elevation with Flooding from the Regulated Area Upstream of Albuquerque Probability of Reaching Elevation with Flooding from the Unregulated Area Upstream of Albuquerque Probability of Reaching Elevation with Flooding from the South Diversion Channel Combined Frequency by Joint Probability Theorem ~1 ~1 ~ ~0 ~ Table 32 - Without-Project Probability of Flood Flows at Cross Section 9, Intermediate Location between Los Lunas and Belen Q (cfs) Probability Table 33 - Without-Project Combined Frequency Analysis Multiple Discrete Event Method at Cross Section 10, Bridge at Belen Elevation (NAVD 88) Probability of Reaching Elevation with Flooding from the Regulated Area Upstream of Albuquerque Probability of Reaching Elevation with Flooding from the Unregulated Area Upstream of Albuquerque Probability of Reaching Elevation with Flooding from the South Diversion Channel Combined Frequency by Joint Probability Theorem ~1 ~1 ~ ~0 ~ ~0 ~ ~0 ~ ~0 ~ Table 34 - Without-Project Probability of Flood Flows at Cross Section 9, Bridge at Belen Q (cfs) Probability
45 Table 35 - Without-Project Combined Frequency Analysis Multiple Discrete Event Method at Cross Section 11, Belen Railroad Bridge Elevation (NAVD 88) Probability of Reaching Elevation with Flooding from the Regulated Area Upstream of Albuquerque Probability of Reaching Elevation with Flooding from the Unregulated Area Upstream of Albuquerque Probability of Reaching Elevation with Flooding from the South Diversion Channel Combined Frequency by Joint Probability Theorem ~1 ~1 ~ ~0 ~ ~0 ~ ~0 ~ ~0 ~ ~0 ~ Table 36 - Without-Project Probability of Flood Flows at Cross Section 11, Belen Railroad Bridge Q (cfs) Probability Table 37 - Without-Project Combined Frequency Analysis Multiple Discrete Event Method at Cross Section 12, Downstream End of Project Area Elevation (NAVD 88) Probability of Reaching Elevation with Flooding from the Regulated Area Upstream of Albuquerque Probability of Reaching Elevation with Flooding from the Unregulated Area Upstream of Albuquerque Probability of Reaching Elevation with Flooding from the South Diversion Channel Combined Frequency by Joint Probability Theorem ~1 ~1 ~ ~0 ~ ~0 ~ ~0 ~ ~0 ~ ~0 ~ Table 38 - Without-Project Probability of Flood Flows at Cross Section 12, Downstream End of Project Area Q (cfs) Probability
46 Figure 17. Without-Project Combined Frequency Curve at Cross Section 1, the Rio Bravo Bridge in Albuquerque Percent Chance Exceedence Flow (1,000 cfs) Projected Frequency of Flood Flows Combined Frequency of Flood Flows Figure 18. Without-Project Combined Frequency Curve at Cross Section 2, the South Diversion Channel Percent Chance Exceedence Flow (1,000 cfs) Combined Frequency of Flood Flows 47
47 Figure 19. Without-Project Combined Frequency Curve at Cross Section 3, the End of the West Side Albuquerque Levee Percent Chance Exceedence Flow (1,000 cfs) Combined Frequency of Flood Flows Figure 20 - Without-Project Combined Frequency Curve at Cross Section 4, I-25 Bridge Percent Chance Exceedence Flow (1,000 cfs) Combined Frequency of Flood Flows 48
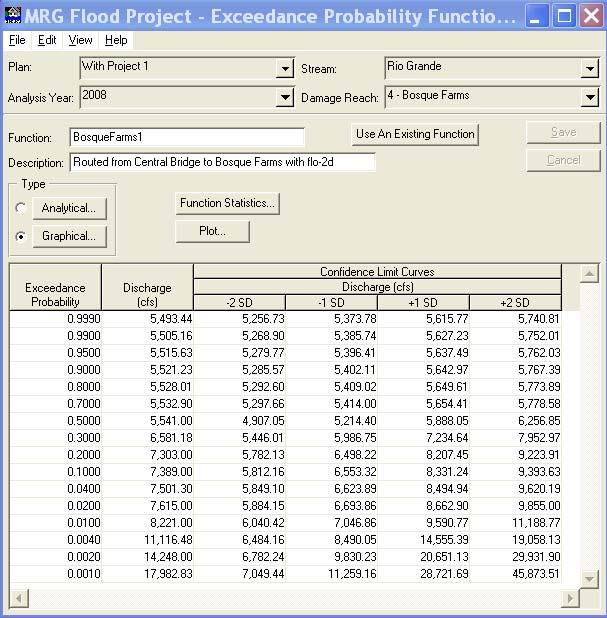
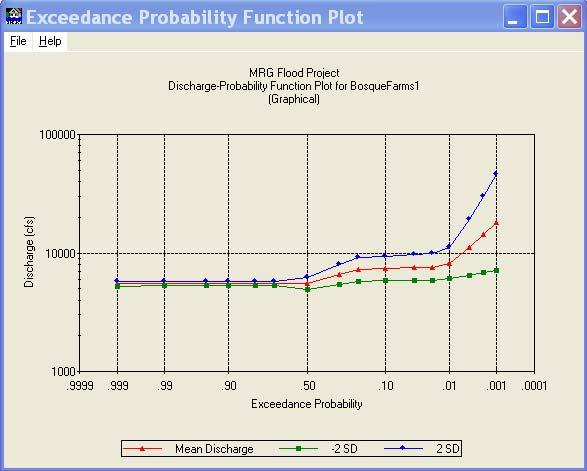
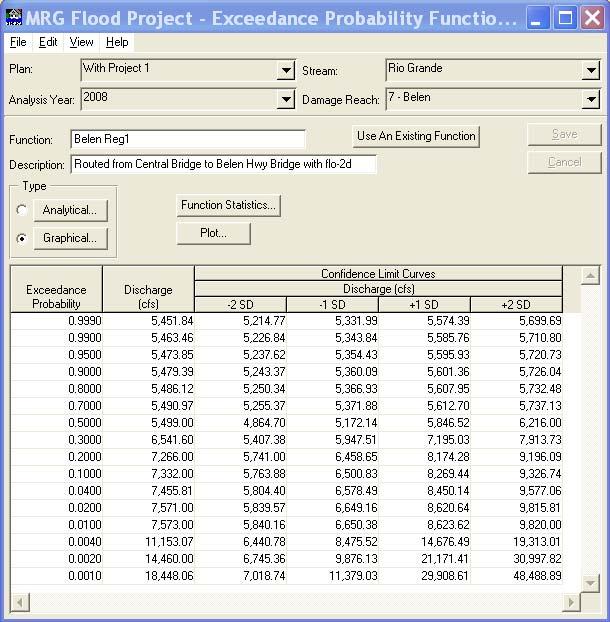
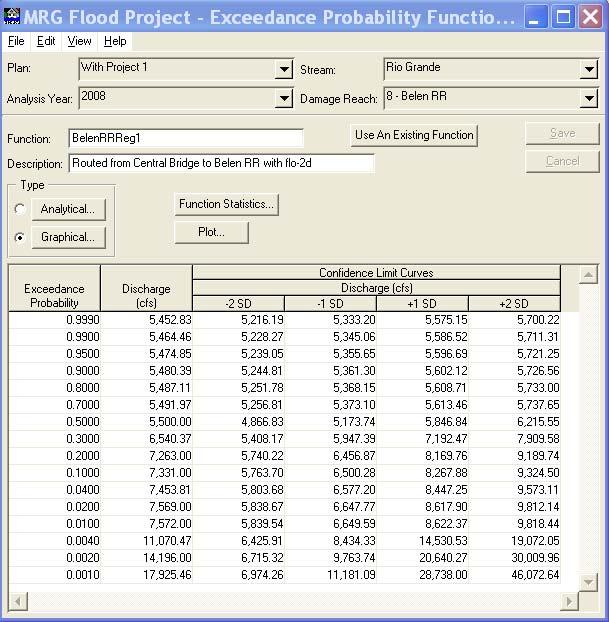
48 Figure 21. Without-Project Combined Frequency for Cross Sections 5 to 12; Isleta Railroad Bridge to Belen (Plotted Line). Note: Additional Points Shown in Graph Represent Scatter in Data. Percent Chance Exceedence Flow (1,000 cfs) Isleta RR Bridge Xsection 9 Combined Freq of Flood Flows D/S of Isleta RR Br Mos t D/S Xsec With-Project Combined Frequency The With-Project combined frequency analysis was performed using HEC-FDA for both current conditions (2008) and future conditions (2058). These results will be used by HEC-FDA to determine levee heights using the risk analysis for flood damage reduction studies. The MRG Levee Project will begin at the South Diversion Channel (cross section 3 / Damage Reach 1) and extend through Belen (cross section 10 / Damage Reach 8). These cross sections, damage reaches and levee reaches are identified in the following Table 39. Table 39 - Cross Sections Used in Analyzing the With-Project Levee from the SDC through Belen X-sec Range River FLO-2D Damage Location Levee Reach # Line Mile Grid # Reach Below Tijeras Arroyo Mountain View I-25 Bridge Isleta North Isleta Bridge Isleta South Bosque Farms Bosque Farms Los Lunas Bridge Los Lunas Los Chaves Los Chaves Belen Hwy Bridge Belen Belen RR Bridge Belen South 8 49
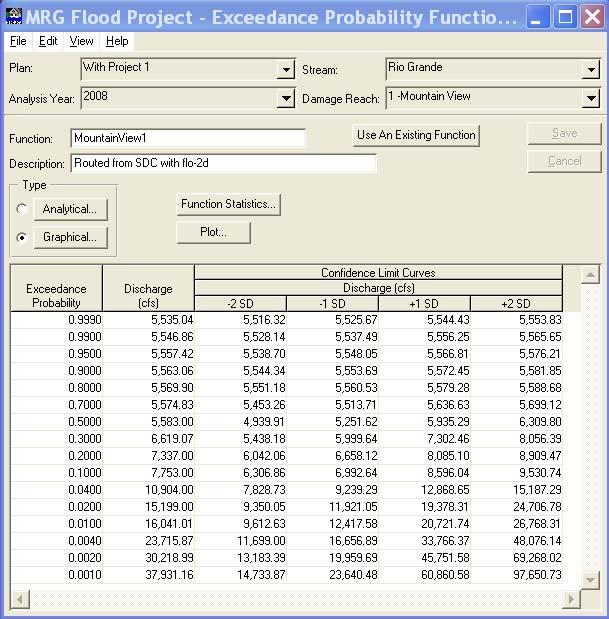
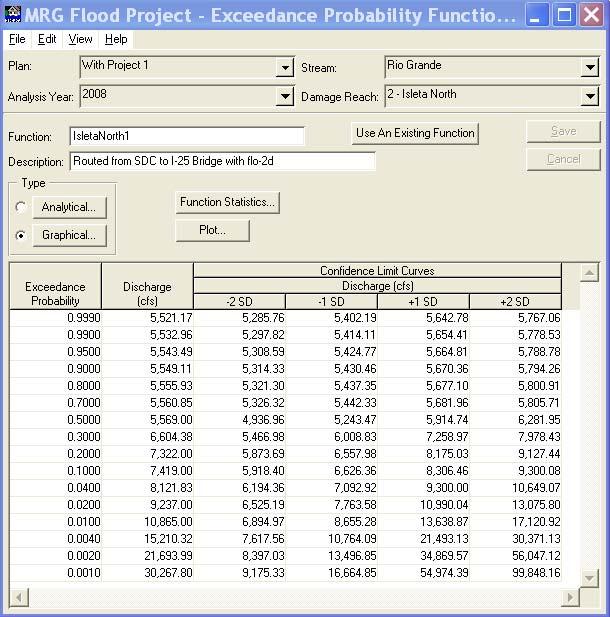
49 The routed flows used for the current With-Project Condition (2008) are shown in Table 40 and were taken from Tables 12, 13 & 14 based on the highest flow for each frequency event at each of the given cross sections. For the With-Project Condition, river flooding is generally dominated by rainfall-runoff storm events from the South Diversion Channel downstream to the Isleta Diversion (River Mile 169.3). From the Isleta Diversion downstream to the end of the project, river flooding is dominated by large volume snowmelt floods that are regulated by the reservoirs upstream of Albuquerque. The routed flows shown in Table 40 are also the discharge-probability inputs for the HEC-FDA program under the HydEng tab for the exceedance probability functions with uncertainty at each cross section for the current With-Project Condition (2008). Table 40 Current With-project Condition (2008) Flood Peaks after Routing - Floods from the Tijeras Arroyo X- sec # Levee Reach 2-YR QP (cfs) 5-YR QP (cfs) 10-YR QP (cfs) 20-YR QP (cfs) 50-YR QP (cfs) 100- YR QP (cfs) 200- YR QP (cfs) 500- YR QP (cfs) 3 Mt. View Isleta N Isleta S Bosque Farm Los Lunas Los Chaves Belen Belen South The Equivalent Record Length (N) was set at 15 years in the HEC-FDA program for the Mountain View Reach. The value for N was set at 15 years for this reach since the controlling flow for most frequencies comes from the Tijeras Arroyo. Tijeras Arroyo flows were determined through hydrologic modeling and then routed to the project reach. The Equivalent Record Length (N) was set at 10 years for all other levee reaches due to the longer distances of flow routing both from the Tijeras Arroyo and from the Albuquerque Gage. The record lengths given were used for both With- and Without-Project Conditions. Selections of values for the equivalent record length were determined after discussions with the Albuquerque District Hydrologist and were based on guidance given in EM At the time of this study the actual record length for the Albuquerque gage following the start of operations of Cochiti Dam was 27 years. Routing hydrographs downstream from the Albuquerque gage into the project reach has the effect of further reducing the equivalent record length. As the routing length increases, the flow rate is further attenuated. Since it was felt this introduces additional uncertainty, the equivalent record length was reduced to account for the increased routing lengths and additional uncertainty. Therefore equivalent record lengths were set at 10 to 15 years depending on the reach and routing length. The resulting confidence limit curves are given below for the current With-Project Condition (2008) HEC-FDA output for each levee reach. The output is given in both tabular form and plotted form for each levee reach. This analysis was conducted for both the current With-Project Condition (2008) and the future With-Project Condition (2058) and is included in the HEC-FDA Risk Analysis Program included in the H&H Appendix as Attachment
50 51
51 52
52 53
53 54
54 55
55 56
56 57
57 58
58 4.0. Hydraulic Analysis 4.1. Overview of Hydraulic Analysis. The hydraulic analysis is part of evaluating the potential of flooding and proposed actions to alleviate high water conditions. It is used in conjunction with the sediment analysis. Specific applications for the hydraulic analysis in the project area include: With and without project floodplains Input to economic analysis Input to risk assessment, used to determine damage-frequency relationships and design parameters such as levee heights Evaluation of design for the proposed project Evaluation of environmental impacts of the proposed project Estimate damages induced by proposed project Two numeric models were used for the hydraulic analysis. They are: HEC-RAS, the River Analysis System, was used to analyze hydraulics at bridges and will be used to aid in the with-project analysis and design. FLO-2D, a 2-dimensional hydraulic model, was used for the hydrologic routing and for the without-project analysis. It was also be used for the with-project hydrologic routing and design. The Flo-2D Model was used to develop the inundation mapping and provide inputs into the FDA Analysis for the without- project conditions (which included generation of the uncertainty for the without-project conditions). The Flo-2D Model was also used for routing hydrographs through the system for both with- and without- project conditions to determine flows at index points for the various project reaches. The Flo-2D Model had the ability to analyze the entire valley area as well as the area limited by the levees depending on the values set for levee height in the levee.dat file. The HEC-RAS Model was used for the with- project inputs into FDA for the determination of levee heights (which included generation of the uncertainty for the with-project conditions). The HEC-RAS Model was limited to the with- project condition for two reasons. The HEC-RAS cross sections did not extend beyond the levees and the HEC-RAS model did not attenuate hydrographs routed downstream. However, the HEC-RAS Model is approved for design (levee height determination) and is better suited for the with- project analysis once the flow is defined within the various project reaches. Model scenarios represent both with-project and without-project conditions. Both present and future conditions models are required for the with-project and without-project scenarios. The future conditions model represents the channel and floodplain 50 years into the future. Development of future conditions models is addressed in the section on sediment. Typical Rio Grande Cross Sections are shown below for both the With-Project Condition and the Without- Project Condition. The cross sections also show the perched channel condition of the Rio Grande above the surrounding floodplain. 59
 (Tetra Tech,")

59 Mapping is used to represent the terrain for the hydraulic models. All mapping was converted to vertical datum NAVD 1988 and horizontal datum New Mexico State Plane Central The FLO-2D model extends from Cochiti Dam to Elephant Butte Reservoir and was previously developed by the Corps to support the Upper Rio Grande Water Operations Planning Study (URGWOPS) (Tetra Tech, 2004). While the overall model extends from Cochiti Dam to Elephant Butte Reservoir, only the reach needed for this study was used. Cross sections for the models are surveyed. The most recent surveys have been supplied by various Federal and local agencies, who have shared their data freely with other agencies. A Corps project to study the Albuquerque levees, completed in 2007, contributed HEC- RAS models and surveys through Albuquerque to the Isleta Pueblo. A HEC-RAS model was developed from US bureau of Reclamation Range Line Data. A comparison was made between the elevations at specific locations along the project reach given in NGVD29 as compared to NAVD88 (using Corpscon6.0). The difference in 60
60 elevation (generally +2.4 to +2.5 for NAVD88) was then added for the appropriate reach in the HEC-RAS Model. The conversion in the HEC-RAS Model was made using the datum adjustment tool in the geometric data window. The cross sections used in the HEC-RAS Model were developed from Lidar Survey on a date when the Rio Grande was flowing at approximately 300 cfs. Therefore, the bottom of the channel shown is the water surface at 300 cfs. Since the comparison of measured flows with the modeled flows is favorable, it was determined that no adjustment to the cross sections were necessary. Additionally, large design flows will render this low flow condition of 300 cfs to be insignificant. This is also a likely base flow condition that would be present at the onset of a large storm event. See the comparison of modeled flows versus measured flows given below. A 250 foot Grid FLO-2D Model was developed in 2007 for the Upper Rio Grande Water Operations Planning Study which included recently surveyed sections and updated rating curves at bridges that were used for this study. TABLE 41 Middle Rio Grande Comparison of Modeled Elevations to Measured Water Surface Elevations of May 2005 (NAVD 88) - Flow approx cfs to 6000 cfs Measured Modeled Comparison of Approximate Date Endpoint Endpoint WSEL WSEL WSEL Modeled & Approximate River Sta. Rangeline Endpoint Surveyed Elevation Reading Reading Elevation Elevation Measured Location (HEC-RAS) WSEL's CO-37 LEP 5/25/ Rio Bravo Bridge AQ-567 REP 5/26/ AQ-582 LEP 5/27/ Tijeras Arroyo AQ-589 LEP 5/27/ AQ-595 LEP 5/27/ AQ-600 LEP 5/27/ AQ REP 5/26/ CO-38 REP 5/26/ AQ-621 LEP 5/27/ AQ REP 5/26/ I-25 Bridge AQ-643 LEP 5/27/ IS-658 LEP 5/27/ Isleta Diversion IS-684 REP 5/27/ CO-713 REP 5/27/ CO /25/ Los Lunas Bridge IS-741 LEP 5/25/ IS-752 LEP 5/25/ CO-765 REP 5/25/ IS-772 LEP 5/25/ LL-774 LEP 5/25/ LL-778 LEP 5/25/ IS-782 LEP 5/25/ CO-787 LEP 5/25/ IS-797 LEP 5/25/ Los Chaves IS-801 LEP 5/25/ CO-806 LEP 5/25/ IS-815 LEP 5/25/ CO-833 LEP 5/25/ IS-849 LEP 5/25/ CO REP 5/25/ Belen Hwy Bridge IS-872 LEP 5/25/ CO-877 LEP 5/25/ Belen RR Bridge IS-880 REP 5/25/ IS-887 IS-R-44 5/25/ Modeled Water Surface Elevation Determined with HEC-RAS Model using Manning's n value = for Channel Flow 61

61 4.2. Without-Project Hydraulic Analysis Without-Project Hydraulic Models The Rio Grande in the study area is characterized by setback spoil bank levees that contain the floodway. The setback levees have been in place for more than 50 years, and in that period of time sediment has deposited between them. As a result of these sediment deposits, the floodway has become elevated above the surrounding floodplain. The difference in elevation varies, but the floodway is elevated by as much as 5 to 10 feet above the surrounding floodplain in many locations. FLO-2D is a 2-dimensional hydraulic model. It was used for without-project conditions because of its ability to evaluate the flooding once flows leave the river channel and move onto the floodplain. The basis of the FLO-2D model in the project area was a widely used FLO-2D model that was modified to meet the analytic needs of this project. The URGWOPs FLO-2D model is used by several Federal and State agencies for the purpose of evaluating and coordinating reservoir releases. The model extends upstream and downstream of the project area on the Rio Grande. URGWOPs models the spoil bank levee in the project area as a viable levee. With-project conditions will include an engineered levee roughly in the alignment of the spoil bank levees. Therefore the with-project FLO-2D routing scenario is very similar to the URGWOPs scenario, because it represents existing conditions and with a levee in place. The URGWOPs FLO-2D model with the spoil bank levees removed was the basis for the without-project model. The Albuquerque District USACE, Geotechnical Branch made that determination which is documented in a memorandum. In the memorandum it was concluded that the Probable Failure Point (PFP) is designated as the elevation of a point at the toe of the existing levee just above the point where the water first breaks out of the river channel. The Geotechnical Memorandum is included in the H&H Appendix as Attachment
62 The FLO-2D URGWOPs model included Manning s n values based on field observations. It was calibrated using the best available flood data. Because the URGWOPs model is not used for high flows, it was not clear at the outset that the extent of the floodplain data for the URGWOPS model, represented by a grid, would be adequate to model flood flows. Mussetter Engineering, Inc., was contracted to evaluate whether the grid was adequate, or would need to be expanded to use for the Albuquerque to Belen reach of the Rio Grande. Mussetter Engineering concluded that the present URGWOPs grid was adequate. Their report is given in the H&H Appendix as Attachment 3. Other updates to the FLO-2D model are: The channel data were updated using the most recent cross section data in the Isleta reach, downstream of the I-25 Bridge and upstream of the bridge at Los Lunas. The hydraulic structures data were updated using rating curves from the most recent HEC-RAS and FLO-2D models. Two separate channel and floodplain datasets were produced representing present and future conditions. Estimates of projected sediment aggradation and degradation for a future conditions scenario are shown in the sediment section of this report. The channel data and floodplain data (within the floodway only) were adjusted using the future conditions aggradation and degradation estimates, in order to produce the future conditions scenario. Infiltration losses are not included. Evaporation losses are not included. Due to these updates, flows found in the hydraulic analysis do not precisely match those given previously in the Hydrology Analysis. However, the magnitudes are very similar and do not affect the conclusions. Most of these updates were made by Tetra-Tech under contract to the Albuquerque District USACE. Their report is given in Attachment Results of FLO-2D Flood Routing for the Without Project Condition Snowmelt flooding is controlled, for the most part, by reservoirs. Reservoir releases from Cochiti Dam resulting from snowmelt flooding typically occur as a steady flow in the Rio Grande that can take place over a period of months. Present guidance for the magnitude of these reservoir releases is 7,000 cfs, though it has been higher at times in the past. The steady long-term portion of snowmelt floods has no significant attenuation. Spillway flow can also result from snowmelt floods coming from upstream of the reservoirs, and is expected to begin at approximately the 0.5%-chance flood event. Spillway flow occurs in addition to reservoir releases, but unlike reservoir releases the flow is not controlled. Routing of rainfall runoff events from non-regulated areas results in significant attenuation through the study reach. One factor leading to the high amount of attenuation for the rainfallrunoff events is the relatively low volume of the high peak hydrographs. That is not the case for spillway flow. Attenuation for spillway flow is gradual, where as for rainfall-runoff flooding attenuation is dramatic. Another of the causes for the attenuation is the large volume of storage available in the channel, which is wide and shallow. Widths typically range from 500 feet to 600 feet, with flow depths on the order of 4 feet for the 10%-chance flood event. Attenuation is also related to the large amount of flow in the floodplain and overbanks. There is significant storage in the overbanks, even for the with-project model. Overbank flow, because of vegetation in the overbanks, is slower than channel flow, and delays the portion of the flood peak that is not carried in the channel, thus reducing flood peaks. Table 42 gives the results of routing 63
63 flows for the 0.2%-chance event through the project for the various flow scenarios discussed. These flows were modeled in 2008 during the study and were used in developing the damage assessment. After the existing condition work had been completed the Albuquerque West Levee was constructed. It is a three mile reach of levee located on the west side of the Rio Grande from approximately the SDC downstream to I-25 and across the river from the Mountain View Reach. Table 43 gives the results of routing flows for the 0.2%-chance event through the project for the same flow scenarios as in Table 42; however Table 43 includes the effects of the Albuquerque West Levee as being in place. Following a review of all flow frequency results, it was determined the effect of the Albuquerque West Levee would not change the damage assessment analysis when considering the controlling flow scenarios. Table 42 Results of Routing Flows for the 0.2%-Chance Event for the Without Project condition without the Albuquerque West Levee X-sec # 1 (Gage) Location Regulated Flow Unregulated Area Below Cochiti South Diversion Channel Flow Below Central Ave. Bridge Albuquerque N/A 2 Above Rio Bravo Bridge, Albuquerque N/A 3 Below Tijeras Arroyo confluence Above I-25 Bridge Below Isleta Bridge (Rt. Isleta Diversion Bosque Farms Bridge at Los Lunas Los Chaves Bridge at Belen (Rt. 309) Belen RR Bridge Table 43 Results of Routing Flows for the 0.2%-Chance Event for the Without Project condition with the Albuquerque West Levee in place X-sec # 1 (Gage) Location Regulated Flow Unregulated Area Below Cochiti South Diversion Channel Flow Below Central Ave. Bridge Albuquerque N/A 2 Above Rio Bravo Bridge, Albuquerque N/A 3 Below Tijeras Arroyo confluence Above I-25 Bridge Below Isleta Bridge (Rt. Isleta Diversion Bosque Farms Bridge at Los Lunas Los Chaves Bridge at Belen (Rt. 309) Belen RR Bridge

64 4.3. With-Project Hydraulic Analysis The location of the existing Rio Grande setback spoil bank levees described above provided the basis for which the alignment was determined for the With-Project engineered levees used in this analysis. The FLO-2D 2-dimensional hydraulic model described previously was also used for the With-Project hydraulic analysis in order to determine the attenuation of the flood hydrograph with the engineered levees in place. The flows determined from FLO-2D at each cross section were then used in the HEC-RAS Model to determine water surface elevations. The HEC-RAS Model was also used for determining the With-Project standard deviations for hydraulic risk. This effort was conducted for both the current With-Project Conditions (2008) and the future With-Project Conditions (2058). Results of With-Project hydraulic risk is presented in Section 6.2 of this report. The With-Project HEC-RAS model for the expected condition uses a Manning s n = for the active channel and a Manning s n = 0.10 for the left and right overbank areas from the channel banks to the levees on either side. The results were then input into the HEC-FDA program at each section for all eight frequencies. The water surface elevations for the current With-Project Conditions (2008) at the index locations are shown below. For each of the flood frequencies that were considered, a separate project was developed to determine the elevation to achieve a 90% Conditional Non-Exceedance Probability Levee Height for that event. This analysis was conducted for both the current With-Project Condition (2008) and the future With-Project Condition (2058) and is included in the HEC-FDA Risk Analysis Program included in the H&H Appendix as Attachment Sediment Analysis 5.1. Methodology for the aggradation/degradation analysis Surveyed range lines provided by the BOR from 1972, 1992, and 2002 were used to analyze the long-term aggradation and degradation trends for this reach. The area of analysis was from range line 514 (approximately 5 miles upstream of the project) to range line 1000 (approximately 9 miles downstream of the project). Twenty-two range lines were analyzed in this reach. Station and elevation data from these surveys were input into an Excel spreadsheet. An algorithm was 65
65 then used to calculate the area between a datum (5500 ft) and the cross section elevations for each range line for each year. The difference between these cross sectional areas from year to year was used as the basis to analyze aggradational and degradational trends. The cross sectional areas for each year were then compared for 1972 to 1992, 1972 to 2002, and for 1992 to In each case, the area from the later year was subtracted from the area from the earlier year. A positive value indicated an aggradational trend for that range line and a negative value indicated a degradational trend. These values were plotted against the range line numbers in order to determine where the reach had a general aggradational or degradational trend. After an initial analysis of the 3 data sets, the 1972 to 2002 data were chosen for quantification of trends. Reasons for this were some questionable survey results from the 1992 surveys, and using the 1972 to 2002 data set would ignore any error introduced by these surveys. Also, the 1972 to 2002 data provide the longest period of record. In addition, a survey of aerial photos was made to try to determine physical factors that may affect the sedimentation and boundaries for the different reaches. Four separate subreaches showing similar trends were identified. Subreach 1, which is almost entirely upstream of the project area, runs from range line 514 to 580. Subreach 1 showed a degradational trend ranging from to ft per year. Subreach 2 extends from subreach 1 to the Isleta Diversion Dam (range lines 601 to 653). Subreach 2 showed a slight degradational trend of ft per year for all three range lines analyzed in this subreach. Subreach 3 starts below the Isleta Diversion Dam and extends to include range line 801. Subreach 3 showed an aggradational trend ranging from 0.1 to 0.2 ft per year. While aggradation below a dam goes against common thought, this is supported by anecdotal evidence. Aggradation in this reach may be explained by the diversions that take place above the dam (approximately 650 cfs during irrigation season). The decrease in flow downstream may cause a decrease in sediment transport capability, resulting in an aggradational reach. Subreach 4 begins downstream of subreach 3 and includes range lines 833 to The end of the project area is approximately at range line 895. Subreach 4 shows a slight degradational trend ranging from 0 to ft per year. Figure 22 below shows the average yearly aggradation or degradation for the range lines analyzed for the period of 1972 to Figure 22 - Average Yearly Sedimentation 66
66 Average Yearly Sedimentation year Agg(+) Deg(-) (ft) Range Line 1972 to 2002 Average Yearly Sedimentation Start of Project End of Project Isleta Diversion Dam I-25 Bridge Isleta RR Bridge NM 49 Bridge NM 6 Bridge Belen RR Bridge Peralta Canal Return 5.2. Conclusions The channel and overbank elevations were relatively stable for the entire reach. Within the project reach, degradational reaches were only slightly so, therefore recommend not including degradation into future conditions models. This would also be the more conservative approach. The aggradational reach downstream of Isleta Diversion dam is fairly consistent, with rates ranging from just under 0.01 ft/yr up to ft/yr. Recommend future conditions models incorporate 0.02 ft/yr aggradation for this reach or 1.0 ft for the 50 year future condition Risk and Uncertainty. A primary purpose of the hydraulic risk analysis is to estimate variability of the water surface. High, expected and low flow scenarios were developed for the without-project hydraulic models. The reaches described below were used as locations to evaluate the standard deviation of the water surface elevations. These standard deviations can then be used in the economic risk evaluation. Standard Deviations were calculated using Equation 5-6 of EM The term "S sub model" in Equation 5-6 was calculated using Equation 5-7 of EM The term "S sub terrain" is calculated using the following equation: SD S0 Sn Where: SD = Standard Deviation (ft) of the error in the computed water surface elevation due solely to the accuracy of the terrain data and the slope of the stream. S0 = Slope of the stream in ft/mile. 67
67 Sn = The standardized survey accuracy being analyzed the contour interval 2-, 5-, 10-feet divided by 10. (i.e. if the data is considered to be accurate to the 2 foot contour interval then Sn = 2/10 = 0.2). The Rio Grande stream slope = 4.6 ft/mile & contour interval = 4 ft. The 1% chance present condition models were used for the risk analysis Without-Project Hydraulic Risk. Hydraulic parameters in the 1% chance present condition FLO-2D model were varied to estimate variability of water surface elevations. Table 44 shows the modifications that were made to develop high and low risk scenarios. The without-project model is the expected scenario risk model. Results of the risk analysis for the channel are shown in Table 45. Results for the floodplain are shown in Table 46 & Table 47. The sediment plug in the Tijeras Arroyo has as its basis a similar occurrence that took place a short distance upstream at the confluence of the Rio Grande with the Calabacillas Arroyo in the summer of During a sever summer thunderstorm, a large volume of sediment was washed down the Calabacillas Arroyo into the confluence as an alluvial deposit that filled in the Rio Grande channel for some distance. This same result could occur at the Tijeras Arroyo confluence under similar conditions. In a report entitled, Sediment-Transport and Scour Analysis of Tijeras Arroyo for Design of University Boulevard Bridge Crossing conducted by Mussetter Engineering, Inc. dated December 2004, the quantity of sediment available just upstream of the confluence was estimated. This volume was used to simulate the sediment plug for the risk analysis. The referenced report is included as Attachment 5. As shown in the results below, the effects of the sediment plug are limited to cross sections 3, 4 and 5. It is interesting to note that the Low n-value Risk Scenario does not always result in the lowest water surface elevation. This is likely an effect of routing whereby the system more efficiently delivers greater flow downstream. This results in higher flow rates and greater water surface elevations across certain cross sections. Another result which requires some explanation occurs at X-section 4 for the High Scenario in Table 45. The value given for w plug is one foot lower than the value for the Expected Scenario. This occurred due to the diversion of flow into the floodplain in the previous section where the plug was introduced. Since the diverted flow did not all return to the channel, the resulting water surface elevation was lower than would otherwise be expected. The controlling flood events at the various Cross sections are as follows: X Sect Location Controlling Flood Event 1. (Central Ave. Bridge, Alb.) Unregulated Area below Cochiti 2. (Rio Bravo Bridge, Alb.) Unregulated Area below Cochiti 3. (Tijeras Arroyo Confluence) Tijeras Arroyo 4. (I-25 Bridge) Unregulated Area below Cochiti 5. (Isleta Diversion Structure) Regulated Flow, Cochiti & Jemez Releases 6. (Bosque Farms) Regulated Flow, Cochiti & Jemez Releases 7. (Bridge in Los Lunas (Rt. 6)) Regulated Flow, Cochiti & Jemez Releases 8. (Los Chaves) Regulated Flow, Cochiti & Jemez Releases 9. (Bridge in Belen (Rt. 309)) Regulated Flow, Cochiti & Jemez Releases 10. (Belen RR Bridge) Regulated Flow, Cochiti & Jemez Releases 68
68 Table 44 - Hydraulic Parameters Varied for the Risk Analysis Hydraulic Models Risk Scenario Risk Parameter Low n-value Expected n-value High n-value Channel n-value Overbank n-value (n>.015) / Sediment N/A N/A Simulated sediment plug at the Tijeras Arroyo Confluence Table 45 - Risk Analysis Results for the Channel Water Surface Elevations (WSEL) X-section Low Scenario Expected Scenario High Scenario Est. Std. Dev w/o plug w plug w/o plug w plug w/o plug w plug Table 46 - Risk Analysis Results for the Right (West) Overbank Floodplain WSEL X-section Low Scenario Expected Scenario High Scenario Est. Std. Dev w/o plug w plug w/o plug 0.36 No right overbank Flow with plug
69 w/o plug w plug Table 47 - Risk Analysis Results for the Left (East) Overbank Floodplain WSEL X-section Low Scenario Expected Scenario High Scenario Est. Std. Dev w/o plug w plug w/o plug w plug w/o plug w plug N/A N/A N/A No Overbank Flow 6.2. With-Project Hydraulic Risk The HEC-RAS Model described previously was used for determining the With-Project standard deviations for hydraulic risk and is included in the H&H Appendix as Attachment 9. This effort was conducted for both the current With-Project Conditions (2008) and the future With-Project Conditions (2058). Table 48 shows the modifications that were made to develop high and low risk scenarios. Table 48 - Hydraulic Parameters Varied for the With-Project Risk Analysis in the HEC-RAS Model Risk Scenario Risk Parameter 70
70 Low n-value Expected n-value High n-value Channel n-value Overbank n-value Sediment (Range Line Extent) None added ( ) 2008 None added ( ) Simulated sediment plug fills channel for 2008 & 2058 condition The basis for the Low, High, and Expected n-values given are due to a confined cross section for the Rio Grande Floodway between the levees as shown in the HEC-RAS Model, whereas the without project scenario considered the effects of the entire valley floodplain section in the FLO- 2D Model (which varies the n-values much more widely). However, the magnitude of change between Low, High, and Expected n-values for the with-project condition are consistent when compared to the without-project condition. The simulated sediment plug was considered for all sections in the with-project modeling based on recommendations from the Albuquerque District Sedimentation Subject Matter Expert (Darrell Eidson). This was based on recent experience in the San Acacia Project reach of the Rio Grande just downstream from the MRG project reach. In the San Acacia reach, sediment plugs have formed in various locations. Following plug formation, the sediment can subsequently be transported downstream. The sediment condition for the High n-value scenario was handled differently for the with-project condition than for the without-project condition, since the effect of engineered levees will tend to confine flows (and mobilize sediment) within the levee section for large events. Therefore, any sediment deposits are confined within the floodway rather than deposited in the historic valley floodplain under high flow conditions. The sediment plug which fills the active channel in the high risk scenario has as its basis a similar occurrence that took place a short distance upstream near the confluence of the Rio Grande with the Calabacillas Arroyo in the summer of During a severe summer thunderstorm, a large volume of sediment was washed down the Calabacillas Arroyo into the confluence as an alluvial deposit that filled in the Rio Grande channel for some distance. This same result could occur at the Tijeras Arroyo confluence under similar conditions and was discussed in the without-project scenario. As discussed above, there are several recent examples of sediment plugs occurring downstream of this reach in the Rio Grande from Bosque Del Apache National Wildlife Refuge to Elephant Butte Reservoir. The most recent occurrences were in the summer of 2007 and the spring of The controlling flood events at most frequencies for the With-Project Condition at the various Cross sections are as follows: X Sect Damage Location Controlling Flood Event Reach 3 1 (Tijeras Arroyo Confluence) Unregulated Areas below Cochiti & SDC 4 2 (I-25 Bridge) Unregulated Areas below Cochiti & SDC 5 3 (Isleta Diversion Structure) Unregulated Areas below Cochiti & SDC 6 4 (Bosque Farms) Regulated by Cochiti & Jemez Releases 7 5 (Bridge in Los Lunas (Rt. 6)) Regulated by Cochiti & Jemez Releases 8 6 (Los Chaves) Regulated by Cochiti & Jemez Releases 9 7 (Bridge in Belen (Rt. 309)) Regulated by Cochiti & Jemez Releases 10 8 (Belen RR Bridge) Regulated by Cochiti & Jemez Releases The standard deviations were calculated for each index point in the eight (8) levee reaches for a full range of flows covering the confidence intervals calculated for the discharge-probability curves. The results were then entered into the HEC-FDA program under the HydEng tab for 71
. The values input for the current With-Project Condition (2008) are shown below.")
71 Stage-Discharge Function with Uncertainty for each damage reach for both the current With- Project Condition (2008) and the future With-Project Condition (2058). The values input for the current With-Project Condition (2008) are shown below. 72
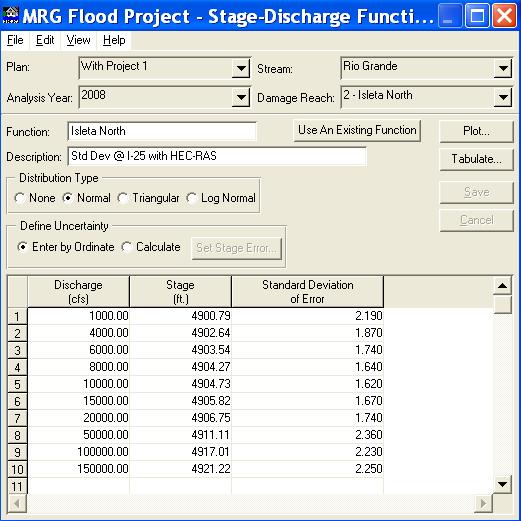
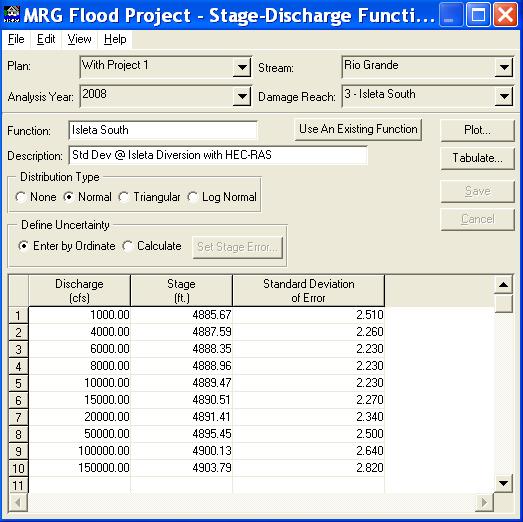
72 73
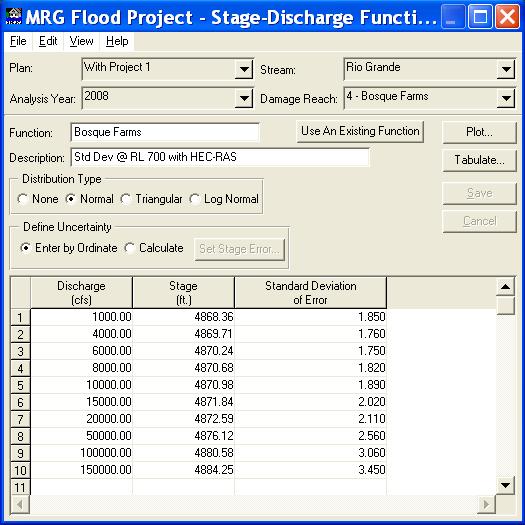

73 74
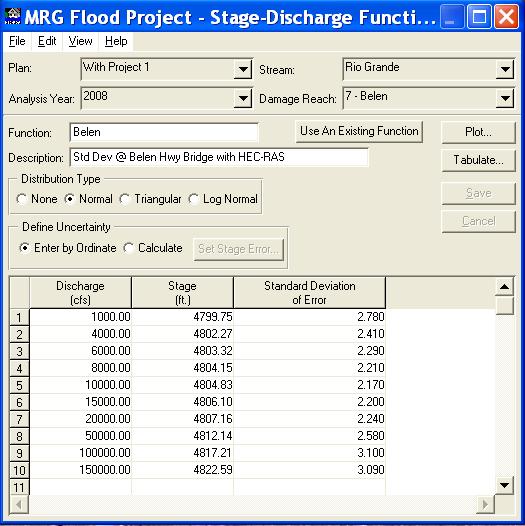
74 75
75 For each of the flood frequencies that were considered, a separate project was developed to determine the elevation to achieve a 90% Conditional Non-Exceedance Probability Levee Height for that event corresponding to each levee reach. Levee elevations were adjusted in an iterative process until 90% CNP was achieved for each event being investigated. This analysis was conducted for both the current With-Project Condition (2008) and the future With-Project Condition (2058) and is included in the HEC-FDA Risk Analysis Program included in the H&H Appendix as Attachment 10. The final hydraulic results using HEC-FDA Risk Analysis for Flood Damage Reduction Projects will be used in determining the most appropriate levee height for design based on the Benefit/Cost Analysis. Examples of the Project Performance output are provided below for current Without-Project Conditions and current With-Project 1 Conditions (500 year project 2% chance event). 76

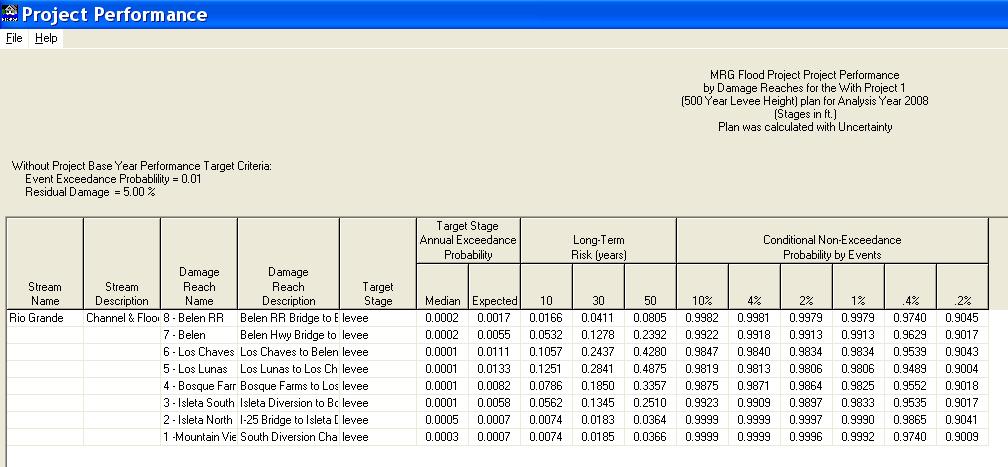
76 77