Preliminary results and findings
|
|
|
- Edmund McDonald
- 5 years ago
- Views:
Transcription

1 Preliminary results and findings Energy perspectives for the Kaliningrad Region as an integrated part of the Baltic Sea Region BDF Summit Vilnius, 2 June 2010 Anders Kofoed-Wiuff, Ea Energy Analyses


2 Stakeholder process PHASE I - Review of current energy situation PHASE II - Detailed scenarios of the electricity markets in the region PHASE III - Kaliningrad region as integrated part of the Baltic Sea Region Dec 2008 Oct 2009 June 2010

3
4 Development gross energy cons.
5 Gross energy cons. by country
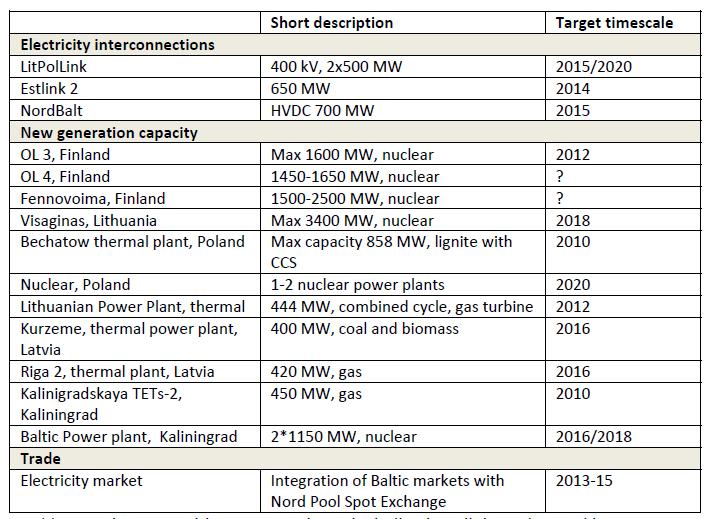
6 A region with many plans how do they interact?
7 6 scenarios for 2020 A Baseline scenario for a development without new nuclear power plants in the region. Three Nuclear power scenarios, assessing the impact of a nuclear power plant in Kaliningrad and/or in Lithuania. A Higher Efficiency Scenario illustrating the effect lower electricity demand than in the Baseline scenario. A scenario with RE-subsidy and CO 2 -quotas in Russia, illustrating the consequences of equal RE-subsidy and CO 2 -quota price in all simulated countries. Using the Balmorel model to simulate investments in power capacity and the dispatch. Nuclear is not an investment option Optimal operation and investments given framework conditions: fuel prices, CO2-cost, technology costs etc.
8 The baseline 2020 Baltic Energy Ring established No new nuclear power capacity Fuel prices from World Energy Outlook (lower gas prices in Russia) RE-subsidy and CO2-quotas in 2020 RE subsidy to electricity generation CO 2 -cost EU countries 30 /MWh 25.0 /ton Russia 15 /MWh 12.5 /ton
9 TWh/year Estonia Latvia Lithuania Kaliningr ad NW Russia Estonia Latvia Lithuania Kaliningr ad NW Russia Baseline 2010 Baseline 2020 Shale 4,6 1,8 Wind 0,4 0,1 0,2 3,8 1,2 2,5 Biogas 0,5 Hydro 2,1 0,2 0,0 12,3 2,1 0,2 0,0 12,3 Biomass 0,4 0,3 0,3 1,3 2,7 2,0 9,9 0,0 Nuclear 47,3 47,3 Natural gas 0,5 2,2 5,2 3,6 45,0 0,3 0,9 0,6 0,8 52,8 Oil 0,2 1,7 0,0 0,0 Coal 2,3 0,8 1,8 10,3 Municipal waste 0,1 0,3 0,5 0,5 2,7
10 Development in the baseline Estonia: oil shale down 60 %, replaced mainly by biomass and wind (1500 MW) Latvia: gas replaced by biomass, waste and wind (500 MW) Lithuania: gas replaced by biomass and wind (1050 MW) Kaliningrad: gas replaced by coal NW Russia: more coal and gas power
11 GW T005 T005 T005 T005 T005 T005 GW GW Transmission on Baltic Energy Ring NordBalt (Swedish export) 0,80 0,60 0,40 0, ,20-0,40-0,60-0,80 S01S02S03S04S05S06S07S08S09S10S11S12S13S14S15S16S17S18S19S20S21S22S23S24S25S26 Estlink 1 & 2 (Estonian export) 1,2 1 0,8 0,6 0,4 0,2 0-0,2-0,4 S01S02S03S04S05S06S07S08S09S10S11S12S13S14S15S16S17S18S19S20S21S22S23S24S25S26 Lit-Pol (Lithuanian export) 1,00 0,80 0,60 0,40 0, ,20 S01 S02 S03 S04 S05 S06 S07 S08 S09 S10 S11 S12 S13 S14 S15 S16 S17 S18 S19 S20 S21 S22 S23 S24 S25 S26-0,40-0,60-0,80-1,00
12 Scenarios variations Three nuclear power scenarios: Kaliningrad nuclear: 2300 MW in Kaliningrad, 1500 MW interconnector from Kal. to Lithuania (upgrade), 1000 MW interconnector Kal. to Poland (new). Lithaunian nuclear: 2300 MW at Visaginas. No need for upgrade of transmission grid. Combination: 2300 MW at both locations. A Higher Efficiency Scenario. 10 % lower electricity demand than in the Baseline scenario. A scenario with the same RE-subsidy and CO 2 - quotas in Russia as in the EU
13 TWh/year 200,0 180,0 160,0 140,0 120,0 100,0 80,0 60,0 40,0 20,0 - Baseline 2010 Baseline 2020 Electricity generation Kaliningrad nuclear Luthuaninan nuclar Nuclear combination Improved efficiency Identical subsidies and quotas Shale Wind Biogas Hydro Biomass Nuclear Natural gas Oil Coal Municipal waste
14 Megatons/year CO 2 -emissions Shale Natural gas Municipal waste Oil Coal and lignite 0 Baseline 2010 Baseline 2020 Kaliningrad nuclear Lithuanian nuclear Nuclear combination Improved efficiency Identical subsidies and quotas
15 T005 T005 T005 T005 T005 T005 GW GW GW Transmission on NordBalt Lithuanian nuclear (Lithuanian export) 0,8 0,6 0,4 0,2 Combi nuclear (Lithuanian export) 0,8 0,6 0,4 0, ,2-0,2-0,4 S01S02S03S04S05S06S07S08S09S10S11S12S13S14S15S16S17S18S19S20S21S22S23S24S25S26-0,4 S01S02S03S04S05S06S07S08S09S10S11S12S13S14S15S16S17S18S19S20S21S22S23S24S25S26-0,6-0,6-0,8-0,8 Kaliningrad nuclear (Lithuanian export) 0,8 0,6 0,4 0,2 0-0,2-0,4-0,6 S01S02S03S04S05S06S07S08S09S10S11S12S13S14S15S16S17S18S19S20S21S22S23S24S25S26-0,8
16 PRELIMINARY FINDINGS
17 The Baltic Energy Ring (BER) has a high utilization rate indicating that the investments are of high value to the electricity system The ring enables the system to integrate large amounts of both nuclear and wind power Kaliningrad nuclear is mainly motivated by the possibilities of export of electricity from Kaliningrad. The plant only influences the generation in the Baltic States in a moderate way. Introduction of nuclear power in Lithuania reduces the use of biomass and import from Sweden.
18 Wind power is a viable on market terms when subsidies and CO 2 quotas are included. Expansion with wind power in the Baltic countries will take place regardless of the introduction of new nuclear power capacity in region. A significant potential for biomass and wind could be utilised if Russia, including Kaliningrad, introduces the same subsidies and CO 2 -quota regulation as in the EU. Reduces coal consumption. Efficiency measures (10%) will reduce the demand for investments in new thermal capacity by approx MW. Integrating electricity markets between the Baltic countries and Russia could bring benefits without any additional costs
19 Next steps Final report ready by end June Data from Kaliningrad will be more detailed Comments are much welcomed Suggestions for further analyses Is nuclear, wind and energy efficiency measures feasible? Wind power integration on a regional level Economic case analyses of concrete projects Explore benefits (and costs?) from more integrated electricity markets
20 THANK YOU!
21 EUR/MWh Average annual electricity market prices 60,0 Estonia Latvia Lithuania Kaliningrad NW Russia 50,0 40,0 30,0 20,0 10,0 - Baseline 2010 Baseline 2020 Kaliningrad nuclear Lithuanian nuclear Nuclear combination Improved efficiency Capital cost of investments in new generation capacity and interconnectors are not directly reflected in the electricity market prices Identical subsidies and quotas
22 MW Investments (not including nuclear) MW less thermal MW less thermal 1400 MW less thermal 2300 MW less thermal 1900 MW less thermal Baseline 2020 Kaliningr ad nuclear Lithuania n nuclear Nuclear combinat ion Improved efficiency Identical subsidies and quotas Biomass Wind Natural gas Municipal waste Coal Biogas
23
24 MW Investments Estonia Lithuania Latvia NW Russia Kaliningrad Baseline 2020 Biomass Wind Natural gas 5948 Municipal waste Coal Biogas 68