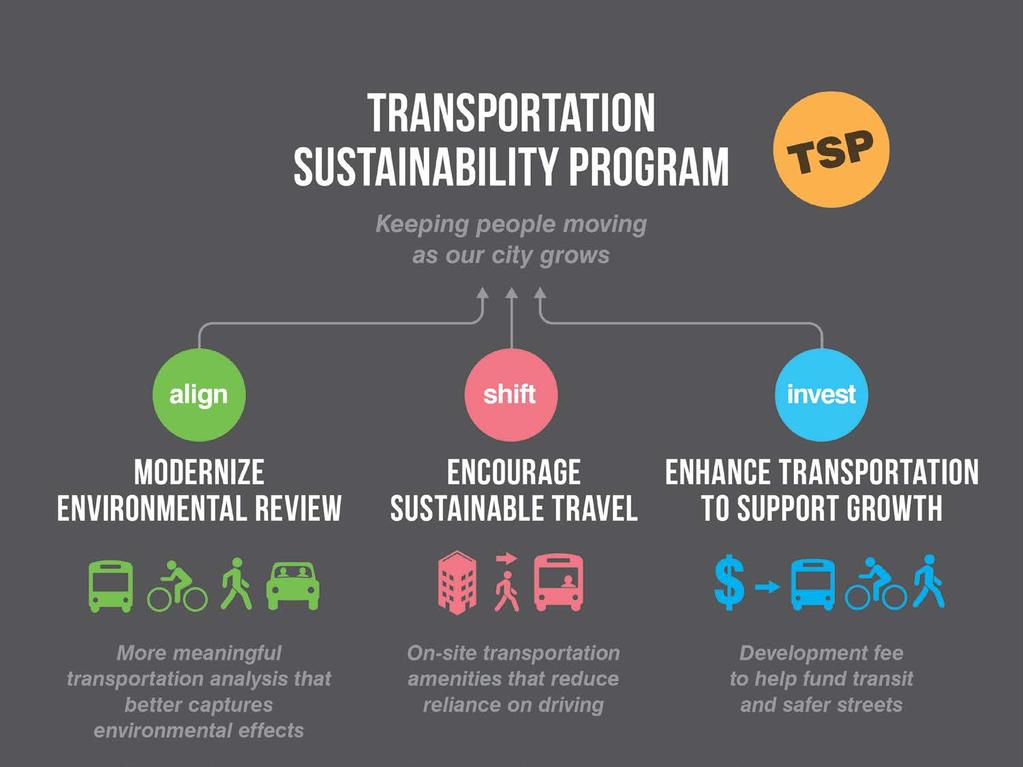
Transportation Sustainability Program
|
|
|
- Easter Tucker
- 5 years ago
- Views:
Transcription
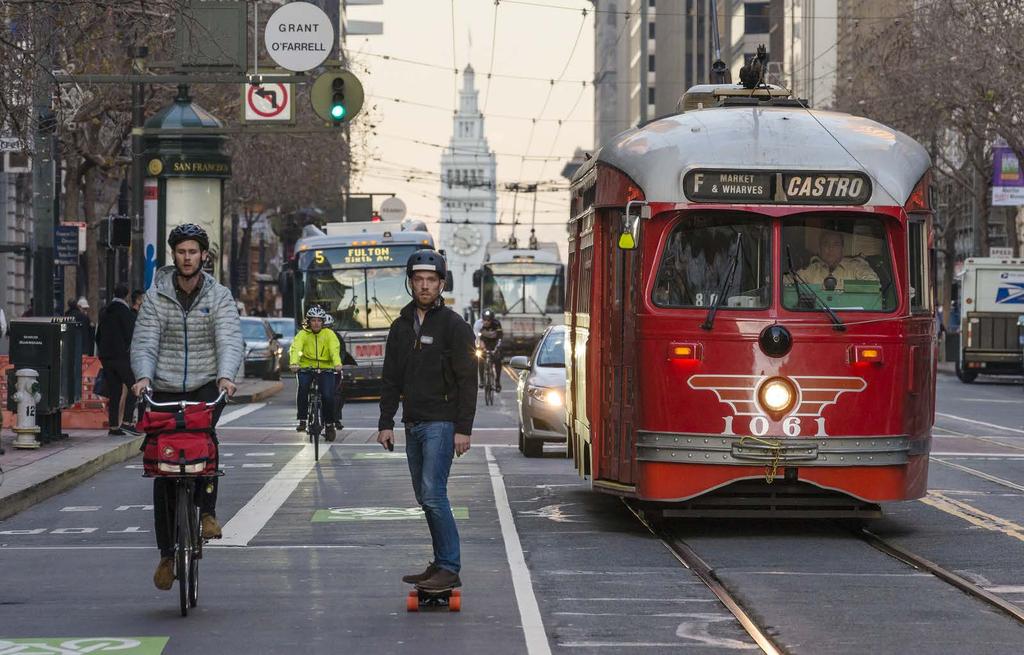
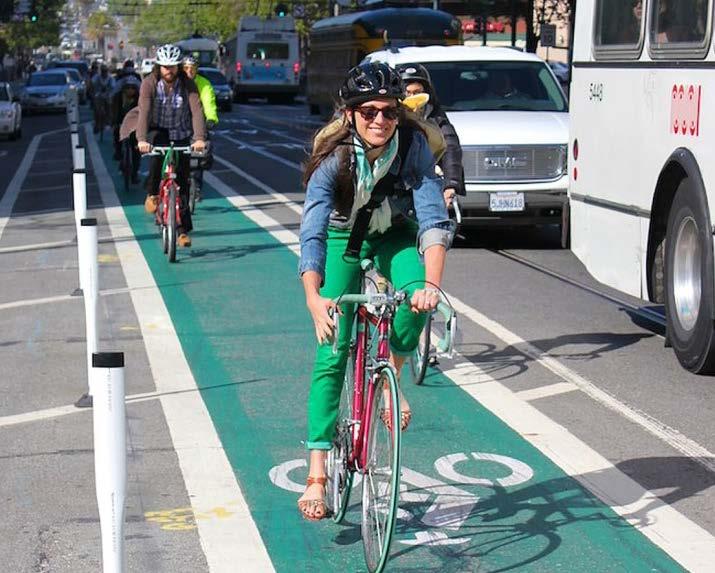
1 Transportation Sustainability Program Photo: Sergio Ruiz


2 San Francisco is a popular place to work, live and visit, straining the existing transportation network Roads and transit vehicles nearing capacity in some areas Lifestyle preferences and new infrastructure have contributed to increases in cycling and walking, even in less-than-ideal conditions 2 2


3 HOW DO WE GROW SUSTAINABLY? By 2040: 100,000+ new households 190,000+ new jobs of housing projections 40% already in pipeline Households Jobs 3 3
4 WE NEED A COMPREHENSIVE APPROACH TO ADDRESS THESE CHALLENGES Public investment for existing and future population underway Transit capital and operational investments (Central Subway, Muni Forward, BRT, DTX, etc.) New development contribution Transportation Sustainability Program Bicycle infrastructure (protected lanes, parking, etc.) Pedestrian safety (Vision Zero, Walk First, etc.) Demand Management (bike sharing, shuttles, citywide TDM, etc.) 4


5 SF Examiner Marrk Draeger 5 SF Planning
6 6
7 MODERNIZE ENVIRONMENTAL REVIEW


")


8 THE WAY IT IS THE WAY IT WOULD BE Auto-centric review standard Multi-modal review standard STATE sets standard Multi-modal review standard with a focus on vehicle level of service (LOS) Multi-modal review standard that promotes mobility and access CITY develops threshold (metric) 8
9 SUMMARY OF PROPOSED OPR GUIDELINES Land Use Projects VMT ratio < regional average = LTS impact Consistency with City Policies = LTS impact Land Use Plans Consistency with Plan Bay Area or achieve similar VMT reduction = LTS impact Transportation Projects Improve safety/operations, including transit operations = LTS impact Pedestrian, bicycle and transit projects that lead to a net decrease in VMT = LTS impact (even if they require reallocation or removal of vehicle lanes) Physical automobile roadway capacity increase (induced demand) = Impact Safety Mitigation Measure and Alternatives TDM measures 9


10 OUTCOMES OF CEQA REFORM Goodbye LOS Hello VMT! LAND USE PROJECTS More certainty during environmental review Reduced time & cost of technical studies TRANSPORTATION PROJECTS Faster delivery of many transportation projects Better environmental outcomes Better environmental outcomes 10
11 ENCOURAGE SUSTAINABLE TRAVEL
 PROGRAM Developing a consolidated TDM")


12 SAN FRANCISCO TRANSPORTATION DEMAND MANAGEMENT (TDM) PROGRAM Developing a consolidated TDM Toolkit What can developers do Creating a SF TDM Efficacy Tool How well do the measures work Establishing Implementation Strategy Measuring and enforcing progress to ensure goals are achieved 12
13 TRANSPORTATION DEMAND MANAGEMENT POTENTIAL LEGISLATION VMT ratio reduction goal Developers select from a menu of TDMs Flexibility Consistency Predictability during the entitlement process The City provides technical advisories to guide the TDM selection process The City monitors and enforces implementation 13
")


14 EXAMPLE OF TRANSPORTATION DEMAND MANAGMENT (TDM) MENU Subsidize Transit Passes Subsidize Bike Share or Car Share Membership Hire TDM Coordinator Shuttle or Vanpool Service Reduce On-site Parking Supply Provide Delivery Service Sponsor Bike-share Stations Commute Reduction Programs Charge for Parking/Parking Pricing 14
15 ENHANCE TRANSPORTATION TO SUPPORT GROWTH

16 URGENT FUNDING NEED 16

17 INVESTMENT PRIORITIES MAINTAIN THE CORE ENHANCE SYSTEM EFFICIENCY EXPAND CAPACITY Focus of new revenue sources requiring voter approval existing residents invest in maintaining the core system Focus of the Transportation Sustainability Fee Developers pay their fair share for transportation impacts from new trips 17
18 TRANSPORTATION SUSTAINABILITY FEE Citywide transportation fee to ensure that new development pays its fair share for impacts on the transit system Replaces existing TIDF and expands applicability to include market-rate residential development and major institutions Nexus and Feasibility Studies underway 18
19 TSF AND MARKET AND OCTAVIA FEES Program Administration 5% Fees on Residential Development Childcare 8% Recreation and Open Space 21% Complete Streets 44% Transit 22% 19
20 EXPENDITURE PLAN: OUTCOMES More Muni buses and trains Faster and more reliable local transit Roomier and faster regional transit (e.g. BART) Safer walking and bicycling 20 20


21 EXPENDITURE PLAN: TYPES OF PROJECTS IN MO Better Market Street Van Ness BRT Muni Forward 5 Fulton 7 Haight Noriega 21
22 NEXT STEPS Finalize the Technical Analysis Confirm Policy Approach Stakeholder Outreach 22
23 TSP TIMELINE 2015 SPRING SUMMER FALL WINTER Public Outreach Complete Technical Work PUBLIC HEARING Fee Ordinance Reintroduced / Adopted PUBLIC HEARING Sustainable Travel Legislation Introduced / Adopted State Upgrades Environmental Review Standard 23
24 THANK YOU