Appendix A. News and Articles
|
|
|
- Godwin Lamb
- 5 years ago
- Views:
Transcription
1 Appendix A. News and Articles
2
3
4

5
6
7
8
9
10

11
12 Appendix B. Letters of Support
13
14
15 Colby R. Tanner BNSF Railway Company Assistant Vice President 2500 Lou Menk Dr. Economic Development Fort Worth, TX (817) December 15, 2016 The Honorable Anthony Foxx, Secretary United States Department of Transportation 1200 New Jersey Avenue S.E. Washington, DC RE: Interstate Highway 35W North Tarrant Express (NTE) FASTLANE Grant Application Dear Secretary Foxx, The I-35W corridor is an important freight route for the state and a critical link to our Alliance facility, the premier rail freight facility in North Texas. Since the facility's opening in 1994, BNSF has invested in this facility supporting intermodal freight growth in North Texas. In 2015, the Alliance Facility handled nearly 650,000 lifts of intermodal units, the fourth highest total among BNSF's network of intermodal facilities. Every lift is one fewer truck trip on Texas and US roadways. Separately, BNSF is executing approximately $60 million in expansion projects at the Alliance facility, planned for completion in Adding this rail capacity will keep even more trucks off Texas and US roads annually. The rail freight activity conducted at Alliance directly contributes to the strength of our North Texas economy while keeping trucks off of Texas and US highways. BNSF and its customers cannot realize the full value of the Alliance terminal and our latest expansion without the completion of the public roadway improvements outlined in this grant application. Sincerely, Colby R. Tanner
16

17
18


19

20


21
22 Appendix C. Detailed Benefit-Cost Analysis

23 Appendix C. Benefit Cost Analysis and Methodology for I-35W North Tarrant Express (NTE) FASTLANE Grant
24 Table of Contents Executive Summary... 1 Baseline Condition... 1 Project Background... 4 Proposed Alternative Benefit- Cost Analysis... 5 i
25 List of Tables Table 1: I-35W North Tarrant Express (NTE) Project Matrix... 2 Table 2: Daily Traffic in 2020 and Table 3: Changes in Vehicle Miles Traveled (VMT) over the 20-Year Analysis Period... 8 Table 4: Changes in Vehicle Hours Traveled (VHT) over the 20-Year Analysis Period... 9 Table 5: No Build (Baseline) and Build Scenario Average Travel Speeds...10 Table 6: Direct Benefits Resulting from the I-35W NTE Project...11 Table 7: Marginal External Pavement Cost for Urban Highways...12 Table 8: Sate of Good Repair Cost Benefits/Disbenefits...13 Table 9: Average Vehicle Occupancy and Value of Time by Vehicle Type/Trip Purpose...14 Table 10: Travel Time Cost Benefits/Disbenefits...15 Table 11: Average Marginal Vehicle Operating Cost for Passenger Vehicles...16 Table 12: Average Marginal Vehicle Operating Cost for Trucks for the Southeast Region (Dollar per Mile)...17 Table 13: Vehicle Operating Cost Benefits/Disbenefits...18 Table 14: Running Emission Rates in 2015 and Table 15: Emission Damage Costs...23 Table 16: Social Cost of Carbon (3 Percent)...24 Table 17: Carbon Emission Cost Benefits/Disbenefits...25 Table 18: Non-Carbon Emission Cost Benefits/Disbenefits...26 Table 19: Motor Vehicle Crashes in Similar Segments on IH-35 (One-Half Mile)...27 Table 20: Estimated Motor Vehicle Crash Rates (per 100 Million Vehicle Mile)...28 Table 21: Average Comprehensive Cost of Motor Vehicle Crashes...28 Table 22: Traffic Accident Cost Benefits/Disbenefits...29 Table 23: Marginal External Noise Cost for Urban Highways...30 Table 24: Noise Cost Benefits/Disbenefits...31 Table 25: Job Creation Benefits...32 Table 26: I-35W NTE Project Total Monetized Benefits by Benefit Category...32 Table 27: I-35W NTE Project Capital Cost Estimates...33 Table 28: I-35W NTE Project Life Cycle Cost Analysis...34 Table 29: Summary of Benefit-Cost Analysis of I-35 NTE Project...36 Table 30: I-35W NTE Project - Total Economic Benefits Resulting from Construction Expenditures...38 Table 31: I-35W NTE Project - Total Economic Benefits Resulting from Operations and Maintenance Expenditures...38 Table 32: I-35W NTE Project - IMPLAN Input Variables...39 Table 33: I-35W NTE Project Economic Impacts Generated over the 20-Year Analysis Period...40 Table 34: Economic Sectors Most Impacted by the I-35W NTE Project in Terms of Employment...40 ii
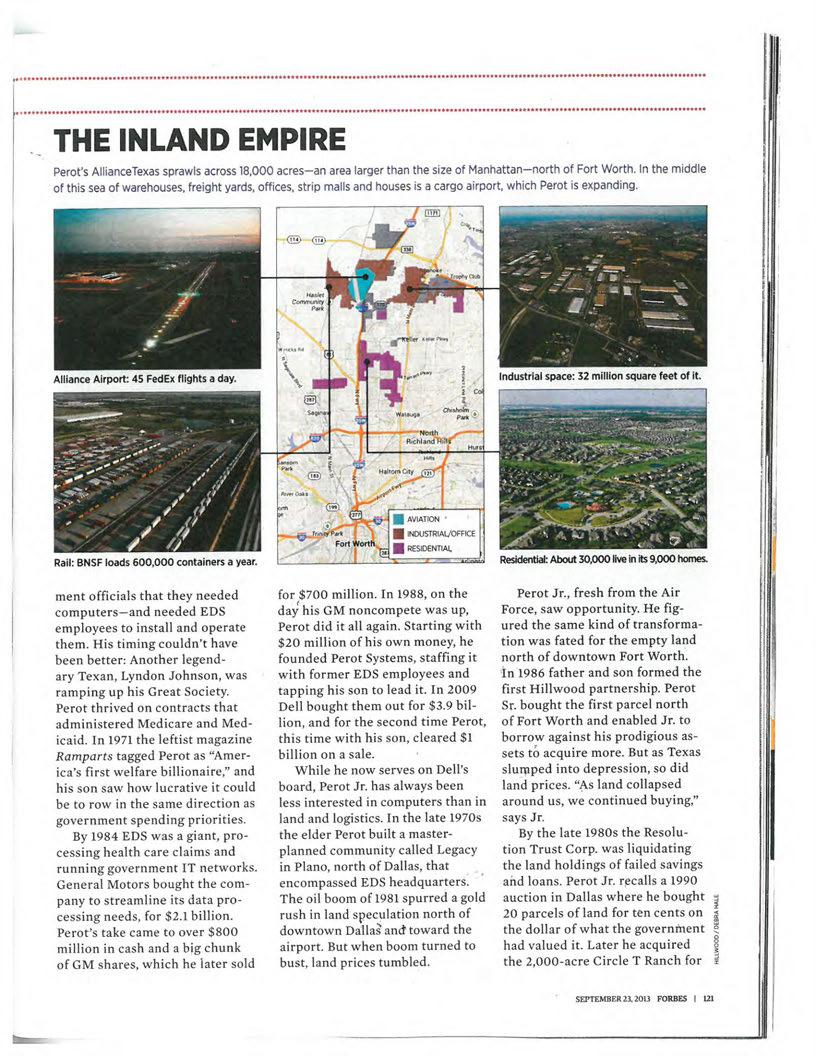
26 Executive Summary This memorandum summarizes the approach used for conducting benefit-cost analysis (BCA) for the I-35 W North Tarrant Express (NTE) Project in Tarrant County, Texas. Table 1 summarizes the project matrix for the proposed corridor. The project matrix describes status quo or baseline conditions; proposed improvements; types of impacts to users/population affected by impacts; summary of results; and page reference in this memorandum. Baseline Condition Running through the heart of Fort Worth, Texas and the AllianceTexas Global Logistics Hub is Interstate Highway 35W (I-35W), an aging and outdated highway that traverses the middle section of our country. Of particularly importance, I-35W is a direct route from Mexico to Canada and has easy connections to Interstate Highways 20, 30, and 40. I-35W serves as the lifeline for the entire Dallas-Fort Worth-Arlington Census-designated Urbanized Area (ID 22042), connecting one of the world s largest inland ports with major employers, communities and other multimodal transportation systems, including rail and air. I-35W serves as part of a major thoroughfare for goods traveling from Canada to Mexico, in part due to the North American Free Trade Agreement (NAFTA) and linking East Coast and West Coast destinations, making it an important regional and national intermodal center for distribution by air, rail, and truck. The NTE project is intended to meet future travel demands stemming from projected population growth and traffic volumes and looks to address operational, design, and capacity deficiencies on I-35W, U.S. 81/287, and SH 170. The I-35W NTE is needed due to projected freight, population, and employment growth in the cities of Fort Worth and Haslet and across the region. If the needed improvements on I-35W are not implemented, freight movement and passenger mobility will be negatively impacted, in addition to the region, state, and nation s economies. According to the project s Environmental Assessment, traffic congestion has and will continue to increase alongside population growth.
27 Table 10 Table 13 Table 22 Table 1: I-35W North Tarrant Express (NTE) Project Matrix Current Status or Baseline Changes to Baseline Type of Impact Population Affected by Impact Economic Benefit/Costs Summary of Results Table Reference in Discounted at 3% Discounted at 7% BCA Capacity for existing and future traffic resulting in poor Level of Service (LOS) Safety concerns at critical segments along the corridor Reconstruct and widen from four lanes to eight lanes (divided) Roadway improvements in critical segments, such as SH 170, Heritage Trace, and North Tarrant Pkwy interchanges Increased capacity Corridor users: 73,280 AADT (passenger cars) Improved travel speeds and travel time Improved accessibility Addressing high safety issues in certain areas of the I-35W corridor in 2020; 6,720 AADT (trucks) in 2020; 110,760 AADT (passenger cars) in 2040; 9,240 AADT (trucks) in 2040 Local, state, region and national population Monetized value of reduced travel time Monetized value of increased vehicle operating costs Monetized value of increased traffic accidents -$613,904,433 -$363,692,780 $383,789,100 $228,680,159 $29,723,574 $17,127,828 Concerns with major traffic disruptions and lack of economic competitiveness for freight operations Acquisition of critical ROW for improved accessibility for ultimate configuration of I-35W NTE Increased air emissions generated by motor vehicles Local, state, region and national population Monetized value of increased Social Cost of Carbon Emissions Monetized value of increased/ Non- Carbon Emission Costs $7,220,334 $7,220,334* Table 17 $10,958,269 $6,473,749 Table 18 Increased noise pollution generated by motor vehicles. Local population Monetized value of increased noise costs $7,030,126 $4,210,410 Table 24 U-Turn bridges, IH-820 frontage roads and bridge replacements Increased pavement maintenance costs. Government Monetized value of Increased pavement maintenance costs $20,074,793 $12,222,769 Table 8 Job creation in the development, construction and maintenance phases of the project. Local, state, region and national population Short-term job-years due to project during development and construction 8,212 Job-Years 8,212 Job-Years Table 25 Short-term job-years due to project during development, construction and maintenance 9,010 Job-Years 9,010 Job-Years Table 25 2
28 Table Reference in BCA Table 30 Table 31 Current Status or Baseline Changes to Baseline Type of Impact Population Affected by Impact Economic Benefit/Costs Summary of Results Discounted at 3% Discounted at 7% Short-term Local/regional **Total (direct, Jobs= 2,185 Jobs= 2,185 economic impacts population indirect and Labor Income = Labor Income = due to project induced) economic $132 M $132 M construction impacts generated GRP = $ 183 M GRP = $ 183 M expenditures in by the Project Tax Revenue = Tax Revenue = Tarrant County. during Development $38 M $38 M and Construction, Long-term economic Local/regional **Total (direct, Job-s = 547 Job-s = 547 impacts due to population indirect and Labor Income = Labor Income = project operations induced) economic $33 M $33 M and maintenance impacts generated GRP = $46 M GRP = $46 M expenditures in by the Project Tax Revenue = Tax Revenue = Tarrant County. during Operations & $10 M $10 M Maintenance, Long-term economic impacts due to travel time savings accruing to commuters, business travellers and trucks in Tarrant County. Local/regional population **Total (direct, indirect and induced) economic impacts generated over the lifecycle of the Project, Jobs = 1,520 Labor Income = $87 M GRP = $134 M Tax Revenue = $33 M Jobs = 1,520 Labor Income = $87 M GRP = $134 M Tax Revenue = Notes: *The social cost of carbon (SCC) dioxide emissions are to be discounted at a value of 3 percent rather than the 7 percent recommendation for all other non-carbon benefits or costs. **Estimated using the Texas IMPLAN Model based on monetized values in 2015 dollars. $33 M Table 33 3
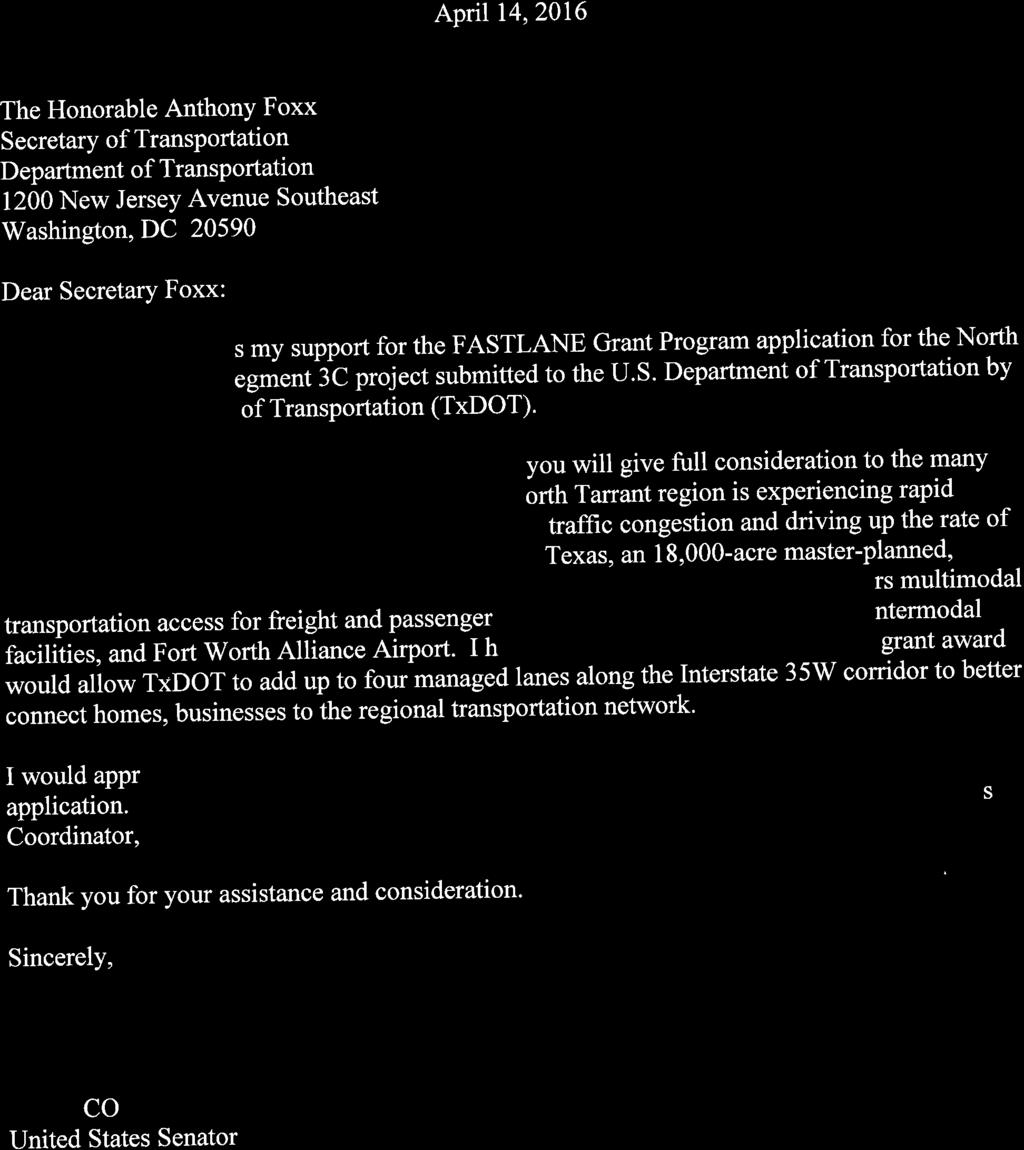
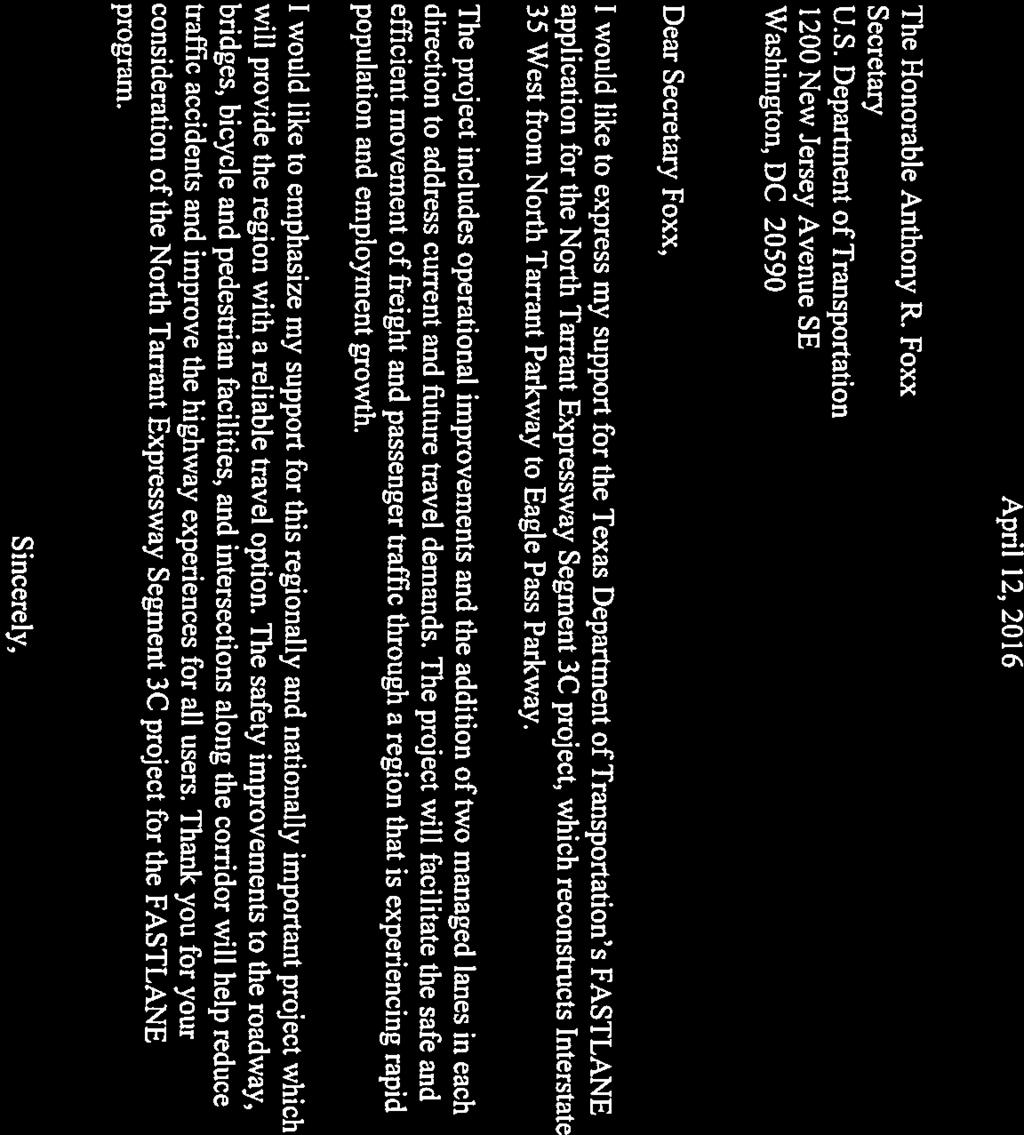
29 The I-35W NTE corridor will experience significant traffic volume increase from 29.2 million vehicles per year in 2020 to 43.8 Million vehicles per year in 2040, a 50 percent increase in the no-build scenario. The freight volume in the same time period will grow from 2.5 million to 3.4 million trucks per year. The annual traffic volume in the build scenario is anticipated to grow from 30.5 Million vehicles per year in 2020 to 57.9 million vehicles per year in 2040, a 90 percent increase. The freight traffic in the same time period is expected to grow from 2.7 Million trucks per year in 2020 to 4.8 Million trucks per year in Although the traffic volume increases following the project implementation, the average annual vehicle hours traveled (VHT) will significantly decrease from 2.6 million vehicle-hours to 2.4 million vehicle-hours in 2020 (4 percent decrease) and 7.7 million vehicle-hours to 6 million vehicle-hours in 2040 (21 percent decrease). The truck VHT will decrease from 0.28 million truck-hours to 0.27 million truck-hours in 2020 (3 percent decrease) and a 1.2 million truckhours to 0.65 million truck-hours in 2040 (45 percent decrease). The freight traffic will significantly benefit from the I-35W NTE project. Project Background I-35W NTE is the northernmost portion of the greater NTE project that stretches from the Alliance Airport corridor to U.S The project will have an interim phase that will reconstruct and widen the roadway to an eight-lane facility consisting of two general purpose lanes in each direction and a barrier-separated, center managed (toll) lane facility with two lanes in each direction. Although the major sections of the highway are currently being improved through a Public Private Partnership (the North Tarrant Express), there are five critical projects that cannot be completed without a Federal grant. These five projects are necessary improvements that will enable this region to create its own Ladders of Opportunity. In 2014, the Dallas-Fort Worth-Arlington region was considered the ninth largest export market in the United States with approximately $28.7 billion in total merchandise exports, much of which utilizes I-35W. Keeping the Metroplex competitive in this market requires mobility and supporting transportation infrastructure. To connect the overall Fort Worth community, and the AllianceTexas community in particular, to the massive economic engine in this region, TxDOT seeks $83 million in FASTLANE grant funding to advance unfunded construction elements of particular importance to stakeholders along the I-35W corridor. These projects are shovel-ready and will greatly enhance our ability to revitalize, connect and provide work in the region. The grant request is for $83 million of the $631,528,000 total I-35W NTE project costs, which is approximately 10 percent of the total future eligible project costs. The I-35W NTE project is anticipated to begin construction in spring The $83 million NSFHP grant will be used to support three elements of the I-35W NTE project: 4
30 $18 million for ROW acquisition, $65 million for the construction of: U-Turn bridges for SH170, Heritage Trace, and North Tarrant Parkway intersections; I-35W/IH820 Interchange frontage road I-35W/IH820 Interchange bridge replacement over Mark IV, Mark IV improvements Golden Triangle intersection improvements The purpose of the Project is to: Improve traffic operations along I-35W to accommodate future traffic projections and provide acceptable level of service (LOS) along the by widening the road, from four to eight lanes. Improve traffic operations in the AllianceTexas area, which is an 18,000-acre masterplanned, mixed-use community, logistics hub, and freight corridor that plays a large role in the regional, state of Texas, and the nation s economies. Improve roadway infrastructure and the existing design and operational deficiencies. The weaving distances between I-35W and SH 170 are currently too short, which cause unsafe driving conditions. Improve traffic operations and safety by minimizing the conflicts between the roadway segments and intersecting roadways. Traffic accident rates for IH-35W in the project area from March 2013 through February 2016 showed that I-35W experienced approximately 518 crashes, including six fatalities. 1 Proposed Alternative Benefit- Cost Analysis This section describes the method used for estimating benefits and life cycle costs of the I-35 W NTE Project. This analysis emphasizes the importance and full benefits of the Project. In conducting the benefit-cost analysis, CS followed Federal guidance regarding evaluation criteria, discount and monetization rates, and evaluation methods recommended by the U.S. DOT in the Guide to Preparing Benefit-Cost Analyses for FASTLANE Grants 2 and the Notice of 1 TxDOT (July 2015). Crash Records Information Systems, Retrieved from Accessed March 28, U.S. DOT Benefit-Cost Analysis (BCA) Resource Guide (November 2016) supplement to the 2016 Benefit-Cost Analysis Guidance for Grant Applicants, Updated November 17, Available at 5
31 Funding Availability (NOFA) for the Department of Transportation s Nationally Significant Freight and Highway Projects (FASTLANE Grants) for Fiscal Year Travel Patterns The estimation of the benefits involved establishing the Baseline and Build Scenario and calculating the differences between the Build and the Baseline in the benchmark years. The project team prepared and analyzed the following four model scenarios as part of the I-35 W NTE Traffic and Revenue (T&R) study: Baseline Baseline plus Committed Projects Only by 2020 (No Build in 2020) 2040 Baseline Baseline plus Committed Projects Only by 2040 (No Build in 2040) 2020 Build Baseline in 2020 plus I-35W NTE Project (Build in 2020) 2040 Build Baseline in 2040 plus I-35W NTE Project (Build in 2040) The model outputs for each of the study scenarios used in the estimation of the benefits included the following: Average Daily Traffic (ADT) by vehicle type (passenger cars and trucks), in 2020 and 2040 Daily vehicle-miles traveled (VMT) by vehicle type (passenger cars and trucks), trip purpose (commute, business and other trips), in 2020 and 2040 Daily vehicle-hours traveled (VHT) by vehicle type (passenger cars and trucks), trip purpose (commute, business and other trips), in 2020 and 2040 In generating the VMT for the intermittent analysis years, the model outputs for 2020 and 2040 were interpolated based on Equations 1 and 2, shown below. Changes in VMT between the Baseline and the Build Scenario over the 20-year analysis period were estimated based on Equation 3. Similarly, VHT for the intermittent analysis years as well as the corresponding changes between the Baseline and the Build Scenario over the 20-year analysis period were estimated by substituting VMT with VHT in Equations 1, 2 and 3. VMT Baseline t = VMT Baseline VMT Baseline ( Baseline VMT )* ( t 2020) ( ) Equation (1) 3 Notice of funding availability (NOFA) for the Department of Transportation s Nationally Significant Freight and Highway Projects (FASTLANE Grants) for Fiscal Year Available at 4 IH-35W North Tarrant Express (NTE), Traffic and Revenue Study (December 6, 2010). 6
32 VMT Build t = VMT Build Build Build ( VMT2040 VMT2020 ( ) ) * ( t 2020) Equation (2) VMT t = VMT Build t VMT Baseline t Equation (3) Where: 2020 t Daily VMT and VHT accruing to commute and business trips were annualized by assuming 265 working days a year (i.e., 52 weeks). Daily VMT and VHT for other trips were annualized by multiplying daily VMT and VHT by 315 days. Daily VMT and VHT for and truck trips were annualized by multiplying daily VMT and VHT by 365 days. Table 2 provides traffic forecasts for the four model scenarios. As shown in the table, in 2020, trucks would save time due to the added capacity provided by the Project. Hours traveled by passenger cars in 2020 would also decrease in spite of the increase in miles traveled. By 2040, trucks using the I-35W NTE Corridor would continue realizing savings in travel time. Passenger cars would also enjoy the benefits of shorter travel time. The 2040 traffic forecasts show the Project will provide sufficient reserve capacity to meet future travel demand. However, in spite of decrease in VHT, auto and truck trip VMT will increase in the short-term by The VMT will also increase in the long-term by 2040 for both auto and truck trips. Table 2: Daily Traffic in 2020 and 2040 Scenario Passenger Cars Trucks 2020 VMT 2020 VHT 2020 VMT 2020 VHT 2020 Build (A) 502,077 7,554 49, No Build (B) 483,648 7,941 44, Changes = (A) (B) 18, , Scenario Passenger Cars Trucks 2040 VMT 2040 VHT 2040 VMT 2040 VHT 2040 Build (C ) 961,203 18,645 87,000 1, No Build (D) 731,016 22,722 60,984 3,242 Changes = (C ) (D) 230,187-4,077 26,016-1,461 Source: North Tarrant Express Mobility Partners Master Development Plan, Segments 2-4, December 06,
33 Tables 3 and 4 depict the changes in VMT and VHT, respectively, by trip type over the 20- year analysis period. Overall, the project is expected to have a substantial positive impact on corridor users. Although the VMT increases in the analysis years, the auto and truck trips will enjoy reduced travel times. Tables 5 presents the travel speeds for the four model scenarios estimated based on the outputs of the T&R study. The 2040 results show an impressive increase in overall travel speeds, which is expected considering the improvements in VHT. Table 3: Changes in Vehicle Miles Traveled (VMT) over the 20-Year Analysis Period Year Calendar Year Reduced/Additional Miles Traveled (Build No Build) All Auto VMT Truck VMT VMT Total ,421,835 1,714,770 7,136, ,536,796 2,103,824 10,640, ,651,757 2,492,877 14,144, ,766,718 2,881,931 17,648, ,881,679 3,270,984 21,152, ,996,640 3,660,038 24,656, ,111,601 4,049,091 28,160, ,226,562 4,438,145 31,664, ,341,523 4,827,198 35,168, ,456,484 5,216,252 38,672, ,571,445 5,605,305 42,176, ,686,406 5,994,359 45,680, ,801,367 6,383,412 49,184, ,916,328 6,772,466 52,688, ,031,289 7,161,519 56,192, ,146,250 7,550,573 59,696, ,261,211 7,939,626 63,200,837 8
34 Year Calendar Year Reduced/Additional Miles Traveled (Build No Build) All Auto VMT Truck VMT VMT Total ,376,172 8,328,680 66,704, ,491,133 8,717,733 70,208, ,606,094 9,106,787 73,712, ,721,055 9,495,840 77,216,895 Totals = 768,000, ,711, ,711,750 Source: North Tarrant Express Mobility Partners Master Development Plan, Segments 2-4, December 06, Note: Negative values represent reduced VMT while positive values represent additional VMT. Table 4: Changes in Vehicle Hours Traveled (VHT) over the 20-Year Analysis Period Year Calendar Year Reduced/Additional Miles Traveled (Build No Build) All Auto VHT Truck VHT VHT Total ,605-9, , ,803-35, , ,000-62, , ,198-88, , , , , , , , , , , , , , , , , , , , , , , , , , , ,828-1,032, , ,008-1,109, , ,187-1,185, , ,367-1,261,934 9
35 Year Calendar Year Reduced/Additional Miles Traveled (Build No Build) All Auto VHT Truck VHT VHT Total , ,547-1,338, , ,726-1,414, ,010, ,906-1,491, ,060, ,085-1,567, ,110, ,265-1,643,820 Totals = -12,780,180-5,700,844-18,481,024 Source: North Tarrant Express Mobility Partners Master Development Plan, Segments 2-4, December 06, Note: Negative values represent reduced VHT while positive values represent additional VHT Table 5: No Build (Baseline) and Build Scenario Average Travel Speeds No Build Average Speed (VMT/VHT) Build Change (Build No-Build) Vehicle Type, Trip Purpose Auto, Commute to Work Auto, Business Trips Auto, All Other Purposes Truck Note: Estimated speeds based on the outputs of the model scenarios. Project Benefits The primary benefits of the project are: Reduced travel time for passengers cars and trucks Reduced transportation costs (due to reduced/avoid congestion along the corridor) for freight shippers compared to their goods continuing to travel to market via the congested I-35W or longer routes Reduced inventory costs for freight shippers realized from the reduced need to keep stock due to more reliable transit time and/or avoidance of future diversion to longer routes Reduced air emissions and noise pollution generated by motor vehicles 10
36 Greater safety for users of motorized and non-motorized transportation modes in the vicinity of the project Consistent with FASTLANE grant methodology and guidance, the benefits resulting from the I-35W NTE Project (Table 6) are broken down into the following major categories: A. State of Good Repair; B. Economic Competitiveness; C. Livability; D. Environmental Sustainability; and E. Safety. The benefits of the I-35W NTE Project are calculated in 2015 dollars over a time horizon of 20 years, starting in 2020 and ceasing in Table 6: Direct Benefits Resulting from the I-35W NTE Project Benefit Category Metrics A. State of Good Repair Pavement Maintenance Costs B. Economic Competitiveness Travel Time Costs Vehicle Operating Costs (VOC) C. Livability Noise Costs D. Environmental Sustainability Social Cost of Carbon (SCC) Emissions Non-Carbon Emissions Costs E. Safety Traffic Accident Costs State of Good Repair The expected increase in VMT will lead to an increase in pavement wear and tear over the 20-year analysis period. The method to assess highway system state of good repair (SOGR) impacts involves estimation of the marginal external cost associated with pavement maintenance by vehicle type and highway functional class. This analysis uses the average external marginal costs for urban highways provided by the Federal Highway Administration (FHWA) (Table 7) which represent the additional spending (or saving) in all costs of maintaining pavements, including resurfacing and reconstruction, resulting from a unit increase/decrease in VMT borne by public agencies responsible for highway maintenance. The marginal pavement cost is multiplied by the annual changes in VMT over the 20-year analysis period. Table 8 summarizes the SOGR benefits/disbenefits. 11
37 Table 7: Marginal External Pavement Cost for Urban Highways Urban Highways (Average) Urban Highways (Average) Vehicle Class in 2000$ in 2015$ Passenger Cars Trucks Source: Note: 1997 Federal Highway Cost Allocation Study, Final Report, Table V-26. Available at Marginal pavement cost was inflated from 2000 to 2015 dollars based on the Consumer Price Index (CPI) from all South Urban Areas provided by the Bureau of Labor Statistics (BLS). 12
38 Table 8: Sate of Good Repair Cost Benefits/Disbenefits A B C D E F G Year Calendar Year Monetary Value of Reduced/Additional Pavement Maintenance (in 2015$) NPV of Maintenance Costs Saved/Wasted Auto Trips Truck Trips All Trips 3% 7% NPV = [E/(1+3%)^A] NPV = [E/(1+7%)^A] $7,463 $428,380 $435,842 $410,823 $380, $11,750 $525,572 $537,322 $491,726 $438, $16,038 $622,764 $638,802 $567,567 $487, $20,325 $719,957 $740,282 $638,574 $527, $24,612 $817,149 $841,762 $704,962 $560, $28,900 $914,342 $943,242 $766,942 $587, $33,187 $1,011,534 $1,044,721 $824,713 $608, $37,475 $1,108,726 $1,146,201 $878,468 $623, $41,762 $1,205,919 $1,247,681 $928,392 $634, $46,050 $1,303,111 $1,349,161 $974,663 $640, $50,337 $1,400,304 $1,450,641 $1,017,450 $644, $54,625 $1,497,496 $1,552,121 $1,056,919 $644, $58,912 $1,594,688 $1,653,601 $1,093,225 $641, $63,199 $1,691,881 $1,755,080 $1,126,519 $636, $67,487 $1,789,073 $1,856,560 $1,156,947 $628, $71,774 $1,886,266 $1,958,040 $1,184,646 $619, $76,062 $1,983,458 $2,059,520 $1,209,751 $609, $80,349 $2,080,650 $2,161,000 $1,232,388 $597, $84,637 $2,177,843 $2,262,480 $1,252,680 $584, $88,924 $2,275,035 $2,363,959 $1,270,745 $570, $93,212 $2,372,228 $2,465,439 $1,286,694 $556,482 Totals = $1,057,080 $29,406,377 $30,463,457 $20,074,793 $12,222,769 Note: Negative values represent savings and positive values represent losses. 13
39 Travel Time Cost Benefits/Disbenefits The expected increase in travel speeds along the corridor will result in reduced travel time for highway users. Although there is an increase in VMT due to added capacity, the VHT reduction results in travel time cost savings for more travelers. The method to assess travel time cost benefits/disbenefits involves estimation of the average vehicle occupancy (AVO) by trip purpose and applying the recommended value of time (VOT) by trip purpose provided in the 2016 Benefit-Cost Analysis (BCA) Resource Guide (Table 9). Annual changes in VHT by trip purpose and trip type over the 20-year analysis period are multiplied by the corresponding AVO and VOT. Travel time cost benefits/ disbenefits resulting from the Project are summarized in Table 10. Table 9: Average Vehicle Occupancy and Value of Time by Vehicle Type/Trip Purpose Vehicle Type, Trip Purpose Average Vehicle Occupancy (AVO) Value of Time (VOT) in 2015 Dollar Auto, Commute to Work 1.18 $13.60 Auto, Business Trips 1.81 $25.40 Auto, All Other Purposes 2.20 $14.10 Truck 1.00 $27.20 Sources: 1. AVO for auto commute trips come from American FactFinder Available at able 2. AVO for auto business and all other purpose trips come from, A., N. McGuckin, H. Y. Nakamoto, D. Gray, and Liss (2011). Summary of Travel trends: 2009 National Household Travel Survey. Report FHWA-PL , U.S. Department of Transportation, Washington D.C. 3. AVO for trucks is assumed to be one which provides a conservative estimate of travel time benefits accruing to freight truck movements. 4. The VOT by trip purpose comes from the Benefit-Cost Analysis (BCA) Resource Guide (November 2016) supplement to the 2016 Benefit-Cost Analysis Guidance for Grant Applicants, Updated Available at: 14
40 Table 10: Travel Time Cost Benefits/Disbenefits A B C D E F Monetary Value of NPV of Travel Time Cost Saved/Wasted Reduced/Additional Travel Time Cost 3% 7% Year Calendar Year Travel Time (in Hours) Saved/Wasted (in 2015 Dollar) NPV = [D/(1+3%)^A] NPV = [D/(1+7%)^A] ,883 -$6,613,713 -$6,234,059 -$5,776, ,457 -$10,469,565 -$9,581,135 -$8,546, ,032 -$14,325,416 -$12,727,947 -$10,928, ,606 -$18,181,268 -$15,683,321 -$12,962, ,181 -$22,037,119 -$18,455,741 -$14,684, ,756 -$25,892,971 -$21,053,355 -$16,124, ,330 -$29,748,823 -$23,483,995 -$17,314, ,108,905 -$33,604,674 -$25,755,185 -$18,278, ,235,480 -$37,460,526 -$27,874,149 -$19,043, ,362,054 -$41,316,378 -$29,847,830 -$19,629, ,488,629 -$45,172,229 -$31,682,893 -$20,057, ,615,203 -$49,028,081 -$33,385,737 -$20,344, ,741,778 -$52,883,932 -$34,962,509 -$20,509, ,868,353 -$56,739,784 -$36,419,108 -$20,565, ,994,927 -$60,595,636 -$37,761,197 -$20,525, ,121,502 -$64,451,487 -$38,994,210 -$20,403, ,248,077 -$68,307,339 -$40,123,363 -$20,209, ,374,651 -$72,163,191 -$41,153,659 -$19,953, ,501,226 -$76,019,042 -$42,089,901 -$19,644, ,627,800 -$79,874,894 -$42,936,691 -$19,290, ,754,375 -$83,730,746 -$43,698,448 -$18,899,132 Totals = -31,261,204 -$948,616,814 -$613,904,433 -$363,692,780 Note: Negative values represent savings and positive values represent losses. Vehicle Operating Costs Benefits/Disbenefits The reduction in VMT also generates savings in the cost associated with the operation and maintenance of passenger cars and trucks. In contrast, increased VMT would lead to increased vehicle operating costs (VOC). VOC include fuel and non-fuel costs. The non-fuel component is comprised of all the necessary replacement items on the vehicle and regular maintenance (e.g., oil and fluid changes, tire rotations, tire replacements, and wiper replacement) as well as truck/trailer lease or purchase payments, permits and licenses, and other related costs to owners of commercial vehicles. 15
41 The method to assess VOC benefits/disbenefits involves estimation of the VOC per vehicle type. Average per-mile VOC for passenger vehicles is estimated based on the VOC for three size categories of sedans (i.e., small, medium and large sedans), four wheel-drive sport utility vehicles (SUV) and minivans provided by the American Automobile Association (AAA) (Table 11). This analysis uses the average auto VOC resulting from 15,000 miles traveled per year. Average per-mile VOC for trucks is estimated using published analyses of the operational costs for trucking based on information provided directly by motor carriers to the American Transportation Research Institute (ATRI) (Table 12). The VOC for autos and trucks are provided in 2015 dollars. Table 11: Average Marginal Vehicle Operating Cost for Passenger Vehicles Auto Type VOC (in Cent per Mile) in 2015 Miles per Year 10,000 15,000 20,000 Small Sedan Medium Sedan Large Sedan Sedan (Composite Average) WD Sport Utility Vehicle Minivan Average = Source: American Automobile Association (AAA). Your Driving Costs, 2016 Edition. Available at Notes: 1. VOC per mile derived from a popular model of each type listed assuming ownership of more than 5 years or 75,000 miles before replacement. 2. VOC per mile includes costs for fuel, maintenance, tires, full-coverage insurance, fees (license, registration and taxes), depreciation, and financing. 16
42 Table 12: Average Marginal Vehicle Operating Cost for Trucks for the Southeast Region (Dollar per Mile) Operating Cost VOC (in Dollar per Mile) in 2015 Fuel Costs $0.401 Truck/Trailer Lease or Purchase Payments $0.247 Repair & Maintenance $0.151 Truck Insurance Premiums $0.065 Permits and Licenses $0.017 Tires $0.042 Tolls $0.025 Total = $0.948 Source: American Transportation Research Institute (ATRI), An Analysis of the Operational Costs of Trucking: 2016 Update (ATRI, September 2016), Table 18, p. 29. Available at: VOC benefits/disbenefits are estimated by multiplying the average marginal VOC by vehicle type by its corresponding annual changes in VMT over the 20-year analysis period. The results from this estimation are shown in Table
43 Table 13: Vehicle Operating Cost Benefits/Disbenefits A B C D E F NPV of Vehicle Operating Cost Monetary Value of Saved/Wasted Reduced/ Reduced/ 3% 7% Year Calendar Year Additional Miles Traveled Additional VOC (in 2015 Dollar) NPV = [D/(1+3%)^A] NPV = [D/(1+7%)^A] ,136,605 $5,008,827 $4,721,300 $4,374, ,640,620 $7,321,385 $6,700,105 $5,976, ,144,634 $9,633,944 $8,559,634 $7,349, ,648,649 $11,946,502 $10,305,158 $8,517, ,152,663 $14,259,061 $11,941,739 $9,501, ,656,678 $16,571,619 $13,474,243 $10,319, ,160,692 $18,884,177 $14,907,344 $10,990, ,664,707 $21,196,736 $16,245,533 $11,529, ,168,721 $23,509,294 $17,493,123 $11,950, ,672,736 $25,821,852 $18,654,256 $12,267, ,176,750 $28,134,411 $19,732,910 $12,492, ,680,765 $30,446,969 $20,732,904 $12,634, ,184,779 $32,759,528 $21,657,907 $12,704, ,688,794 $35,072,086 $22,511,437 $12,711, ,192,808 $37,384,644 $23,296,874 $12,663, ,696,823 $39,697,203 $24,017,461 $12,567, ,200,837 $42,009,761 $24,676,307 $12,429, ,704,852 $44,322,319 $25,276,399 $12,255, ,208,866 $46,634,878 $25,820,601 $12,051, ,712,881 $48,947,436 $26,311,659 $11,821, ,216,895 $51,259,995 $26,752,207 $11,570,056 Totals = 885,711,750 $590,822,627 $383,789,100 $228,680,159 Note: Negative values represent savings and positive values represent losses. Emission Cost Benefits/Disbenefits This category of project benefits (disbenefits) captures the savings (or additional expenditures) in emission damage costs resulting from reduced (increased) VMT under the Build Scenario (compared to the No Build). This analysis applies the running emission rates pertain to Carbon Dioxide (CO2), Volatile Organic Compound (VOC), Nitrogen Oxides (NOx), Particular Matter (PM) and Sulfur Dioxide (SOx) for passenger cars and trucks on urban restricted access roads estimated by 18
44 Cambridge Systematics (CS) using MOVES2014 (Table 14). The 2015 running emission rates are used to estimate the emission damage costs over the period and the 2025 running emission rates are used to estimate the emission damage costs over the period. Travel speeds for the Baseline (No Build) and Build Scenarios presented in Table 5 are utilized in this part of the analysis. Table 14: Running Emission Rates in 2015 and Running Emission Rates (g/mile) 2025 Running Emission Rates (g/mile) Light Duty All Trucks Light Duty All Trucks Pollutant Speed (mph) 4-Urban Restricted Access 4-Urban Restricted Access Pollutant Speed (mph) 4-Urban Restricted Access 4-Urban Restricted Access CO , , CO , , CO2 5 1, , CO , CO , CO , CO , CO , CO , CO , CO , CO , CO , CO , CO , CO , CO , CO , CO , CO , CO , CO , CO , CO , CO , CO , CO , CO , CO , CO , CO , CO , NOx NOx NOx NOx NOx NOx
45 2015 Running Emission Rates (g/mile) 2025 Running Emission Rates (g/mile) Light Duty All Trucks Light Duty All Trucks Pollutant Speed (mph) 4-Urban Restricted Access 4-Urban Restricted Access Pollutant Speed (mph) 4-Urban Restricted Access 4-Urban Restricted Access NOx NOx NOx NOx NOx NOx NOx NOx NOx NOx NOx NOx NOx NOx NOx NOx NOx NOx NOx NOx NOx NOx NOx NOx NOx NOx PM PM PM PM PM PM PM PM PM PM PM PM PM PM PM PM PM PM PM PM PM PM
46 2015 Running Emission Rates (g/mile) 2025 Running Emission Rates (g/mile) Light Duty All Trucks Light Duty All Trucks Pollutant Speed (mph) 4-Urban Restricted Access 4-Urban Restricted Access Pollutant Speed (mph) 4-Urban Restricted Access 4-Urban Restricted Access PM PM PM PM PM PM PM PM PM PM VOC VOC VOC VOC VOC VOC VOC VOC VOC VOC VOC VOC VOC VOC VOC VOC VOC VOC VOC VOC VOC VOC VOC VOC VOC VOC VOC VOC VOC VOC VOC VOC SOx SOx SOx SOx SOx SOx
47 2015 Running Emission Rates (g/mile) 2025 Running Emission Rates (g/mile) Light Duty All Trucks Light Duty All Trucks Pollutant Speed (mph) 4-Urban Restricted Access 4-Urban Restricted Access Pollutant Speed (mph) 4-Urban Restricted Access 4-Urban Restricted Access SOx SOx SOx SOx SOx SOx SOx SOx SOx SOx SOx SOx SOx SOx SOx SOx SOx SOx SOx SOx SOx SOx SOx SOx SOx SOx Sources: 1) U.S. DOT, Federal Transit Administration. New and Small Starts Evaluation and Rating Process. Final Policy Guidance. August ) Emission rates estimated by Cambridge Systematics using MOVES2014. The emissions rates (in grams per mile) of non-carbon emissions (VOC, NOx, PM and SOx) are multiplied by the annual changes in VMT resulting from the implementation of the I-35W NTE Project, converted to short tons and then, multiplied by the emission cost per short ton depicted in Table 15. The CO2 emissions rates (in grams per mile) are multiplied by the annual changes in VMT resulting from the implementation of the Project, converted to metric tons and then, multiplied by the emission cost per metric ton depicted in Table 16. It should be noted that the social cost of carbon (SCC) dioxide emissions increases annually and values for these emissions are to be discounted at a value of 3 percent rather than the percent recommendation for all other non-carbon benefits or costs. The expected emission cost benefits/disbenefits are shown in Tables 17 and
48 Table 15: Emission Damage Costs Emission Type Emission Damage Cost (Dollar per Short Ton) in 2015 Dollar Gram per Mile VOCs $1,844 NOx $7,266 PM $332,405 SOx $42,294 Source: Note: U.S. DOT Benefit-Cost Analysis (BCA) Resource Guide (November 2016) supplement to the 2016 Benefit-Cost Analysis Guidance for Grant Applicants; Corporate Average Fuel Economy for MY2017-MY2025 Passenger Cars and Light Trucks (August 2012), page 922, Table VIII-16, Economic Values Used for Benefits Computations (2010 dollars). Available at The U.S. DOT Benefit-Cost Analysis (BCA) Resource Guide (November 2016) converts the emission damage cost value into 2015 dollars. 23
49 Table 16: Social Cost of Carbon (3 Percent) Year 3% SCC (Dollar per Metric Tons) in 2015 Dollar Year 3% SCC (Dollar per Metric Tons) in 2015 Dollar Source: U.S. DOT Benefit-Cost Analysis (BCA) Resource Guide (November 2016). Note: Technical Support Document: Technical Update of the Social Cost of Carbon for Regulatory Impact Analysis under Executive Order (May 2013; revised August 2016), page 25, Table A1 Annual SCC Values: (2007$/metric ton CO2) ; values for 3% discount rate. Available at 24
50 Table 17: Carbon Emission Cost Benefits/Disbenefits A B C D E NPV of SCC Emissions Saved/Wasted CO Emissions 3% 7% Year Calendar Year Damage Cost (3% SCC) (in 2015$) NPV = [C/(1+3%)^A] NPV = [C/(1+3%)^A] $124,809 $117,645 N/A $183,649 $168,065 N/A $235,986 $209,670 N/A $280,427 $241,899 N/A $311,560 $260,926 N/A $276,872 $225,123 N/A $315,339 $248,931 N/A $362,348 $277,710 N/A $397,310 $295,636 N/A $436,684 $315,470 N/A $503,731 $353,306 N/A $566,172 $385,535 N/A $557,239 $368,401 N/A $611,918 $392,767 N/A $757,406 $471,990 N/A $790,377 $478,191 N/A $861,493 $506,036 N/A $862,134 $491,663 N/A $892,594 $494,208 N/A $892,031 $479,511 N/A $838,584 $437,651 N/A Totals = $11,058,663 $7,220,334 N/A Notes: 1. Negative values represent savings and positive values represent losses. 2. In accordance with Federal guidance, the social cost of carbon (SCC) dioxide emissions changes over time and are discounted at a lower discount rate of 3%, even in the 7% discount rate benefit-cost analysis. 25
51 Table 18: Non-Carbon Emission Cost Benefits/Disbenefits A B C D E F G H I NPV of Non-Carbon Emissions Saved/Wasted 3% 7% Year Calendar Year VOC Emissions Damage Cost NOx Emissions Damage Cost PM Emissions Damage Cost SOx Emissions Damage Cost Grand Total NPV = G/(1+3%)^A] NPV = [G/(1+7%)^A] $1,716 $90,303 -$38,143 $2,649 $56,526 $53,281 $49, $3,397 $113,254 -$23,527 $3,830 $96,955 $88,727 $79, $4,748 $124,409 -$9,219 $4,715 $124,653 $110,752 $95, $5,485 $141,390 -$13,062 $5,519 $139,331 $120,188 $99, $5,107 $172,079 -$45,134 $6,212 $138,264 $115,794 $92, $846 $15,343 $660,516 $54,408 $731,113 $594,462 $455, $936 $17,695 $682,827 $56,518 $757,976 $598,353 $441, $1,057 $20,600 $708,378 $58,663 $788,698 $604,471 $428, $1,078 $22,065 $745,877 $60,930 $829,950 $617,561 $421, $1,183 $25,181 $771,178 $63,071 $860,612 $621,724 $408, $1,356 $28,527 $811,822 $65,392 $907,097 $636,220 $402, $1,537 $30,462 $841,645 $67,583 $941,228 $640,930 $390, $1,318 $36,628 $846,690 $69,488 $954,123 $630,788 $370, $1,444 $39,811 $873,842 $71,643 $986,740 $633,351 $357, $2,116 $39,744 $1,020,473 $74,965 $1,137,298 $708,726 $385, $2,111 $44,570 $1,049,201 $77,233 $1,173,115 $709,754 $371, $2,295 $46,595 $1,081,750 $79,453 $1,210,094 $710,802 $358, $2,093 $52,580 $1,095,370 $81,407 $1,231,450 $702,279 $340, $1,991 $54,855 $1,115,667 $83,412 $1,255,924 $695,375 $324, $1,832 $57,249 $1,129,269 $85,476 $1,273,826 $684,744 $307, $1,389 $57,614 $1,155,994 $87,925 $1,302,922 $679,985 $294,087 Totals = $45,034 $1,230,954 $14,461,415 $1,160,491 $16,897,894 $10,958,269 $6,473,749 Note: Negative values represent savings and positive values represent losses. 26
52 Traffic Safety Benefits/Disbenefits The reduction (or increase) of traffic accidents depends on the reduction (or increase) of vehicle-miles traveled by passenger cars and trucks under the Build Scenario (compared to the No Build). The method to assess safety benefits/disbenefits resulting from the implementation of the I-35W NTE project involves applying the historical regional fatality, injury and property damage crash rates to the annual changes in VMT and then, estimating the dollar value by using comprehensive cost of motor vehicle crashes by injury level. This analysis uses the historical average fatality, injury and other crash rates in other similar segments of IH-35, estimated based on the reported crash statistics for the last five years (Tables 19 and 20), and the average monetized value of fatalities and injuries prescribed in the 2016 Benefit-Cost Analysis (BCA) Resource Guide (Table 21). The results from this estimation are shown in Table 22. Table 19: Motor Vehicle Crashes in Similar Segments on IH-35 (One-Half Mile) Year Fatalities Incapacitating Injuries Non- Incapacitating Injuries Possible Injuries Non- Injuries Unkno wn Injuries Average ( ) Source: TxDOT CRIS DATA (CRIS stands for Crash Reporting Information System). 27
53 Table 20: Estimated Motor Vehicle Crash Rates (per 100 Million Vehicle Mile) Average Fatalities/ Injuries Rates (per 100 Million Vehicle Mile) Build Rates (per 100 Million Vehicle Mile) No- Build Fatalities Incapacitating In juries Non- Incapacitating Injuries Possible Injuries Non- Injuries Unknown Injuries Source: TxDOT Crash Reporting Information System (CRIS) Data Table 21: Average Comprehensive Cost of Motor Vehicle Crashes Average Monetized Value of Accident (for KABCO-Reported and Generic Accident data) Monetized Value (in 2015$) Fatal Accident Cost K $9,600,000 $/person Accident Cost (Incapacitating Injury) A $459,120 $/person Accident Cost (Non-Incapacitating Injury) B $125,050 $/person Accident Cost (Possible Injury) C $63,854 $/person Accident Cost (Injured Severity Unknown) U $174,030 $/person Property Damage Only (PDO) Crashes O $8,396 $/crash Unit Sources: 1) The average comprehensive cost of a fatality in traffic crashes comes from the U.S. DOT Benefit-Cost Analysis (BCA) Resource Guide (November 2016) supplement to the 2016 Benefit-Cost Analysis Guidance for Grant Applicants and Guidance on Treatment of the Economic Value of a Statistical Life in U.S. Department of Transportation Analyses (2016). 2) The average comprehensive cost of injured people in traffic crashes by injury severity are estimated based on the KABCO/Unknown AIS Data Conversion Matrix developed by the NHTSA (July 2011) and provided in the U.S. DOT Benefit-Cost Analysis (BCA) Resource Guide (November 2016), page 12 of 19. 3) The PDO crash cost comes from the National Highway Traffic Safety Administration (NHTSA), The Economic and Societal Impact of Motor Vehicle Crashes,
54 Table 22: Traffic Accident Cost Benefits/Disbenefits A B C D E F G Monetary Value of Reduced/Additional Motor Vehicle Crashes (in 2015 Dollar) NPV of Reduced/Additional Traffic Accidents 3% 7% Year Calendar Year Autos Trucks Total NPV = [E/(1+3%)^A] NPV = [E/(1+7%)^A] $65,958 $65,958 $0 $0 $ $131,501 $91,075 $222,576 $203,689 $181, $328,960 $116,192 $445,152 $395,512 $339, $526,419 $141,309 $667,729 $575,989 $476, $723,878 $166,427 $890,305 $745,616 $593, $921,337 $191,544 $1,112,881 $904,874 $693, $1,118,797 $216,661 $1,335,457 $1,054,222 $777, $1,316,256 $241,778 $1,558,034 $1,194,103 $847, $1,513,715 $266,895 $1,780,610 $1,324,941 $905, $1,711,174 $292,012 $2,003,186 $1,447,144 $951, $1,908,633 $317,129 $2,225,762 $1,561,105 $988, $2,106,092 $342,246 $2,448,338 $1,667,199 $1,015, $2,303,551 $367,364 $2,670,915 $1,765,789 $1,035, $2,501,010 $392,481 $2,893,491 $1,857,222 $1,048, $2,698,469 $417,598 $3,116,067 $1,941,830 $1,055, $2,895,928 $442,715 $3,338,643 $2,019,934 $1,056, $3,093,388 $467,832 $3,561,220 $2,091,841 $1,053, $3,290,847 $492,949 $3,783,796 $2,157,846 $1,046, $3,488,306 $518,066 $4,006,372 $2,218,231 $1,035, $3,685,765 $543,183 $4,228,948 $2,273,268 $1,021, $3,883,224 $568,301 $4,451,525 $2,323,217 $1,004,768 Totals = 40,081,292 6,659,715 46,741,008 $29,723,574 $17,127,828 Note: Negative values represent savings and positive values represent losses. Noise Cost Benefits/Disbenefits Noise cost reduction is another benefit of reduced VMT. The underlying theory is that people are willing to pay to avoid high noise levels attributed to motor vehicles and that housing property values reflect proximity to a noisy road. However, when VMT increases the additional noise costs and impacts have to be considered as disbenefits. The method to assess noise impacts of the I-35W NTE Project involves estimation of the marginal external cost caused by noise emissions of motor vehicles. Federal Highway 29