SHIP POWER: RESILIENCE IN DEMANDING MARKETS
|
|
|
- Shanon Summers
- 5 years ago
- Views:
Transcription

1 SHIP POWER: RESILIENCE IN DEMANDING MARKETS Jaakko Eskola, President, Ship Power & Senior Executive Vice President 1


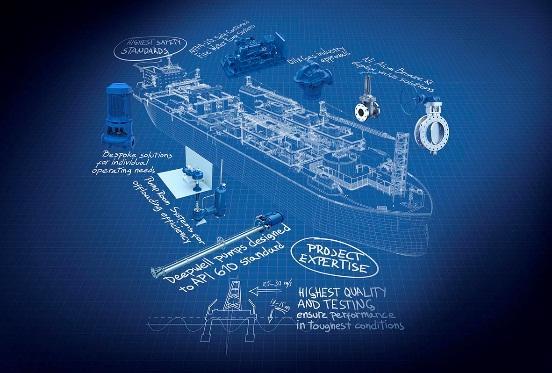
2 The most complete marine offering on earth 2


3 Strategic focus Ship Power s strategic goal To be recognised as the leading provider of innovative products and integrated solutions in the marine and offshore oil & gas industry. Efficiency Gas and dual-fuel solutions Environmental solutions THROUGH OFFERING LEADER IN Lifecycle solutions for ship owners and operators Integrated solutions for the shipbuilding industry, owners and operators The most competitive products and delivery process for the marine industry 3
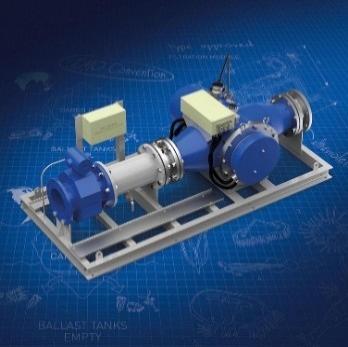
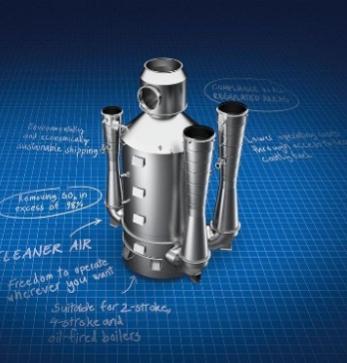
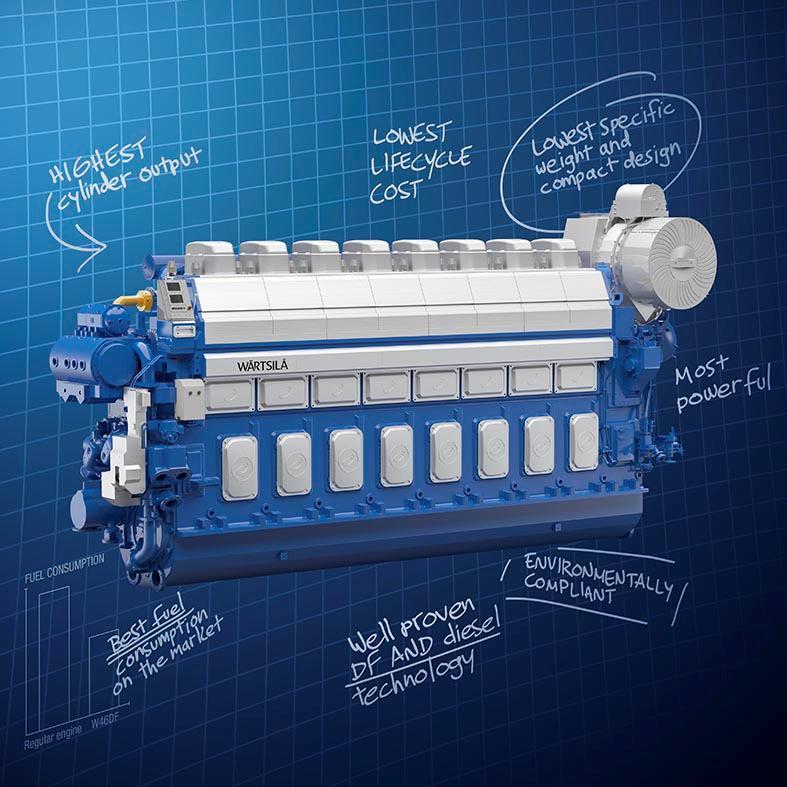
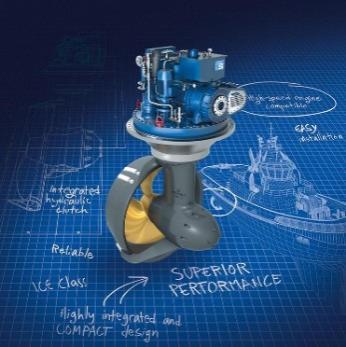

4 Continued innovations Propulsion Engines E&A BWMS Pumps & Valves Gas EGC 4


5 Market environment 5
6 Ship Power operates in two industries The marine industry Merchant, Cruise & Ferry, Navy and Special vessels Developments in the global economy drive demand for: Seaborne cargo transportation Cruise and ferry services Navy vessels The Oil and Gas industry Newbuild vessels and rigs for exploration and production in offshore fields Gas distribution chain equipment and infrastructure (e.g. for liquefaction and regasification) Global demand and price level for oil and gas are crucial for: Investment into offshore oil and gas exploration and production (including support vessels) Investment into development of gas distribution chains Cautious outlook given increased uncertainty over developments in global economy and oil prices Environmental regulations, increased safety requirements, fuel costs and efficiency requirements continue to support investments 6
7 The marine industry: fundamentals in place despite a challenging 2014 World seaborne trade and GDP development % Yr/Yr 10% 5% 0% -5% Seaborne trade growth Deliveries, removals, and fleet growth # vessels GDP growth Fundamentals supporting growth in seaborne trade: Growth in oil products trade to Asia and OECD countries Recovery in global container trade Continued consumer demand growth in developing economies Fleet growth bottoming out: Slower pace of deliveries Removals rate expected to stay high in the medium-term Deliveries Removals Net fleet growth Source: Clarkson Research Services, IMF
8 Oil & Gas: supply grows, offshore remains important Long-term oil production Long-term gas production Mbpd % 38% 36% 34% 32% 30% 28% 26% 24% 22% 20% Bn cfd % 36% 34% 32% 30% 28% 26% 24% 22% 20% Offshore Onshore % Offshore Offshore Onshore % Offshore IEA estimates: Investment of some $900 billion/year in upstream oil and gas development is needed by 2030 to meet projected demand Gas production increases almost everywhere, and unconventional gas accounts for almost 60% of global supply growth Source: Clarkson Research (Sep 2014). IEA World Economic Outlook
9 Offshore oil companies reduce investment in the near term Exploration & Production Offshore CAPEX E&P CAPEX change 2014 vs 2015 billion USD % = -38,2 billion USD Transportation and Logistics Subsea 5% Equipment 7% Seismic 7% Other 4% EPCI 32% EPCI Well+Maintenance Services Transportation and Logistics Seismic Topside and Processing Equipment Drilling Subsea Equipment Other Topside and Processing Equipment 10% Well+Maintenance Services 15% Drilling 20% 2015 total offshore E&P CAPEX foreseen to decline by 13% compared to EPCI, Drilling, and Well+ Maintenance Services segments expected to face the biggest decline Investments reduced across the board, with independents and small-cap companies decreasing the most Wärtsilä supplies mainly two segments: Drilling and Transportation and Logistics Source: Rystad Energy dated E&P data modeled at 60 USD/bbl


10 Shipbuilding market 10
11 Specialised segment activity still resilient Number of vessels contracted Offshore Cruise and Ferry Special vessels LNG carriers LPG carriers Source: Clarkson Research Services, excluding contracts reported out of period 11
12 Shipbuilding volume China continues to dominate Total order book: 5,048 vessels Merchant + Specials order book, 4,083 vessels Offshore order book, 965 vessels 1% 10% 23% 19% 46% 5% 44% 5% 5% 22% China Japan South Korea Brazil Rest of world Source: Clarksons World Shipyard Monitor March % 11% China Brazil US Norway South Korea Netherlands RoW 12
13 Shipbuilding value A more diversified picture Total order book value: USD 305 billion Merchant + Specials order book, USD 204 billion 17% 33% 2% Offshore order book USD 101 billion 3% 3% 5% 14% 33% 17% 20% 31% China South Korea Japan Brazil Rest of world 24% South Korea Brazil China Norway US Netherlands RoW Source: Clarksons World Shipyard Monitor March
14 Overall cautious sentiment, segments uneven Number of vessels contracted A Short term outlook Typical Wärtsilä product offering Offshore 437 Order potential challenging Main engines, auxiliary engines, E&A, propulsors, solutions, BWMS, waste water systems, pumps and valves, ship design, gas systems Gas carriers 183 Market normalising Main engines, auxiliary gensets, propulsors, gas systems, BWMS, pumps and valves Cruise & Ferry 37 Cruise majors expanding to Far East, LNG gaining traction Main engines, auxiliary engines, E&A, gas systems, scrubbers, propulsors, BWMS, pumps and valves, waste water systems Containerships 133 Positive outlook for large and med. sized containers Main engines, auxiliary engines, propulsors, BWMS ship design, waste water systems, pumps and valves Tankers 329 Active sector, expected to continue short-term Main engines, auxiliary engines, propulsors, BWMS, pumps and valves, inert gas systems, ship design 500 Bulk carriers 701 Limited activity; Baltic Dry Index at its lowest Main engines, auxiliary engines, propulsors, BWMS, pumps and valves A 2014A Other marine 111 RoRos positive Main engines, auxiliary engines, propulsors, pumps and valves, E&A, BWMS, water systems Note: Other marine = MPP, general cargo, RoRo, vehicle carriers and miscellaneous. Source: Clarksons Marine and Offshore reports March, 2015 Jaakko Eskola


15 We believe that gas, efficiency and environmental solutions are the future 15
16 LNG poised for long term growth Billion cubic meters / year % of total consumption 24% 21% 18% 15% 12% 9% 6% 3% LNG supply (Bcm / y) LNG trade share of total gas consumption (%) 0% Source: BP Energy Outlook
17 Increasing number of LNG trading countries Number of LNG importing and exporting countries, volume of LNG trade MTPA No. of countries Volume of LNG trade Global regasification capacity No. of LNG importing countries No. of LNG exporting countries 0 Significant growth in number of importing countries increases demand for small and medium scale receiving terminals and gas carriers Source: International Gas Union: World LNG Report
18 LNG as ship fuel gaining ground LNG fuelled fleet Number of vessels DNV estimate (excluding LNGC) Clarkson estimate (including LNGC) LNG Carriers Other vessels Fleet growth based on current order book only 0 *LNGC: LNG Carriers Source: DNV GL gas report Sept LNGC order book data and LNGC estimate: Clarkson Research Services , LNG Trade and Transport study


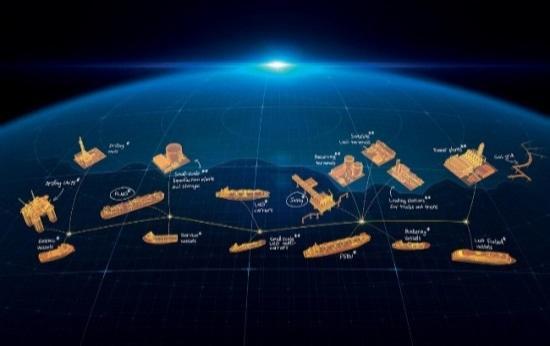
19 Our offering to the gas value chain Fuel gas handling for OSVs On- & Offshore small scale liquefaction Antiflaring Fuel gas handling LPG, LEG, Ethane and LNG cargo handling Jetty and Floating regasification Bunkering and barges VOC Gas reformer Oil separation Receiving terminals Loading stations 19
20 Lower oil prices mean cheaper bunkers Daily rate and bunker costs*, 3,500 TEU containership Thousand USD Jan % Jan % Jan % Jan % Jan.93 Jan.94 Jan.95 Jan.96 Jan.97 Jan.98 Jan.99 Jan.00 Jan.01 Jan.02 Jan.03 Jan.04 Jan.05 Jan.06 Jan.07 Jan.08 Jan.09 Jan.10 Jan.11 Jan.12 Jan.13 Jan.14 Bunker $/day Charter rate $/day Bunker as a % of daily costs (Daily costs = Charter rate $/day + Bunkers $/day)...however bunker share of daily costs is still very high (now at 80%): 1. Efficiency gains have big impact on bottom lines 2. Slow steaming expected to remain in the picture * Bunker costs are paid by the charterer Source: Clarkson Research Services (basis 3500 TEU ship, speed 22.5k on consumption of 105 tpd). 20
21 Introduction of environmental legislation continues ,1%S EU in ports Europe ECA 1% SOx Global cap 3,5%S Review of North introduction of America 0.5% S global limit ECA 1% SOx All ECA 0,1% S U.K. port authorities plan to check fuel records of ships calling on British ports 2016 Ballast Water Management awaits ratification Global cap 0,5% S 2016 Tier III limit (North America ECA) US EPA steps up ECA sulphur enforcement efforts Hong Kong; Shipmasters could face jail for breaching sulphur rules 2025 Efficient environmental products key for customers to fully comply with IMO legislation Finnlines selects Wärtsilä scrubber systems for six of its vessels to reduce Baltic Sea environmental impact Royal Caribbean will retrofit nearly half of its fleet (19 ships), with advanced emissions purification systems Singapore based Pioneer Marine orders 44 Wärtsilä ballast water management systems to 22 of its bulk carriers HHI selects Wärtsilä exhaust gas cleaning systems for 10 new large gas carrier vessels Source: Trade Winds, Sustainable Shipping, Bunkerworld, Dow Jones & Company Inc. March


22 Competitive landscape 22


23 Our competitors E&A Propulsion Gas systems 4-stroke medium speed Ship Power Flow systems Ship design 2-stroke Environmental solutions EGCS BWMS Note: Converteam is a part of GE Allweiler is a Colfax business unit 23
24 Strong market position in key offerings Offering Our market position Wärtsilä key strengths Engines: 4-stroke Main engines: market leader Auxiliary generating sets: market challenger Fuel flexibility and efficiency Environmental footprint Propulsion CPP, FPP & STT: among the top players TT: market challenger Well-engineered, efficient products Operational efficiency for dynamic positioning Multi-segment presence Electrical & Automation (excl. L-3 MSI) Established position in offshore, otherwise market challenger Low loss concept, efficiency and space savings Track record in demanding applications, performance and safety Ship Design Among the leading ship design houses Frontrunner in fuel flexible, energy efficient and LNG powered ship designs Experience: over 4,000 vessels built in offshore, specials and merchant segments 24


25 Strong market position in key offerings Offering Our market position Wärtsilä key strengths Oil & Gas systems Among the top players Strong LNG and LPG process technology know-how Complete end-to-end gas cargo handling offering for a broad range of gas carriers Pumps & Valves Among the top players High efficiency with electric prime movers Sophisticated material choices, durability Flexible design Environmental Solutions Among the top players Leader in technical performance and compliance Choice of technology for customers Partnership approach throughout the lifecycle Full turnkey capability, also for retrofits 25


26 Concluding remarks 26

27 Our broad portfolio gives us a resilient position First signs of recovery in the global economy, supports trade and shipping Lower oil prices: Increases pressure in offshore markets Presents opportunities in other marine markets Efficiency remains a priority Fundamentals in gas and other specialised segments remain positive Regulatory pressures still in play, will attract investments (also for retrofits) 27


28 The most complete marine offering on earth got even more complete 28
29 Thank you! 29