DRAFT Tuolumne River Daily Operations Model Model Description and User s Guide
|
|
|
- Thomasine Smith
- 5 years ago
- Views:
Transcription
1 DRAFT Tuolumne River Daily Operations Model Model Description and User s Guide Modesto Irrigation District Turlock Irrigation District Don Pedro Project Relicensing FERC No DRAFT Working Document October,
2 Tuolumne River Daily Operations Model Model Description and User s Guide Contents 1.0 Introduction 2.0 Geographical Range of Model and Underlying System Operation 3.0 Don Pedro Reservoir System 3.1 Reservoir Inflow 3.2 MID and TID Canal Demand 3.3 Required FERC flows at La Grange Bridge 3.4 Reservoir and Release Management 3.5 Water Supply Factor 3.6 Power Generation 3.7 User-Interface Adjustments 4.0 City and County of San Francisco System 4.1 Hetch Hetchy Reservoir 4.2 Lake Lloyd 4.3 Lake Eleanor 4.4 Don Pedro Inflow 4.5 Water Bank Account 4.6 User Interface Adjustments 5.0 General Model Structure 5.1 UserInput Worksheet 5.2 WaterBankRel Worksheet 5.3 Control Workheet 5.4 Output Worksheet 5.5 DSSAnyGroup Worksheet 5.6 DSSMonthTable Worksheet 5.7 XXGroup Worksheet 5.8 ModelYearofDaily Worksheet 5.9 ModelAnyGroup Worksheet 5.10 ModelMonthTable Worksheet 2
3 5.11 DonPedro Worksheet 5.12 SFHetchHetchy Worksheet 5.13 SFLloyd Worksheet 5.14 SFEleanor Worksheet 5.15 SFWaterBank Worksheet 5.16 LaGrangeSchedule Worksheet 5.17 DailyCanalsCompute Worksheet 5.17 DailyCanals Worksheet 5.19 DPWSF Worksheet 5.20 CCSF Worksheet 5.21 Hydrology Worksheet Worksheet 3
4 1.0 Introduction The Turlock Irrigation District (TID) and Modesto Irrigation District (MID) (collectively, the Districts) have developed a computerized Project Operations Model (Model) to assist in evaluating the relicensing of the Don Pedro Project (Project) (FERC Project 2299). On November 22, 2011, in accordance with the Integrated Licensing Process schedule for the relicensing of the Don Pedro Project, the Districts filed their Revised Study Plan containing 35 proposed studies with the Federal Energy Regulatory Commission (FERC) and relicensing participants. On December 22, 2011, FERC issued its Study Plan Determination approving, with modifications, the proposed studies, including Study Plan W&AR-2: Project Operations /Water Balance Model Study Plan. Consistent with the FERC-approved study plan, the objective of the Model is to provide a tool to compare current and potential future operations of the Project. Due to the fact that the geographic scope of the Model extends from the City and County of San Francisco s (CCSF) Hetch Hetchy system in the upper part of the watershed to the confluence of the Tuolumne and San Joaquin rivers, the Model is now entitled the Tuolumne River Daily Operations Model. In accordance with the study plan, the Districts are preparing a Model Development Report due to be filed with FERC in January 2013 (W&AR-2 Study Plan, page 7). The Model Development Report will contain three components: (1) this Model Description and User s Guide (User s Guide), (2) a Validation Report, and (3) an executable version of the Model. Also in accordance with the FERC-approved study plan, the Districts are organizing and conducting a number of workshops with relicensing participants associated with the development of the Model. The first Workshop, held on April 9, 2012, was focused on the development of the hydrologic dataset; the second Workshop, held on September 21, dealt with accretion flows, Dry Creek flows, downstream nodes, and other related hydrologic investigations. The third Workshop, scheduled for October 23, will focus on Model architecture, logic, and functionality and provide an initial training opportunity for potential Model users. This Model Description and User s Guide provides information to be covered in the Workshop No. 3. As fully described in this User s Guide, and consistent with the FERC-approved study plan, the Model includes numerous user-controlled parameters that allow the simulation of alternative Project operations, such as alternative flow regimes for the lower Tuolumne River. The Model performs a simulation of Project operations for a sequential period of years that covers a range of historical hydrologic conditions. The period of hydrologic record selected for the Model is Water Year 1971 through Water Year 2009, which includes extreme years of hydrology (1977 dry and 1983 wet) and multi-year periods of challenging water supply conditions such as , , and The purpose of this User s Guide is to describe the structure of the Model, the interfaces available for operation of the Model, and methods available for the reviewing Model results. Procedures for development of input files for running alternative future operations are also described and illustrated. The data presented in this document are referenced to a Test-Case simulation of operations and are being incorporated for illustrative purposes of the Workshop. As is the case with any model, the Tuolumne River Daily Operations Model is only a depiction of project operations, and is limited to representing CCSF and District operations to the extent that their operations can be described systematically by various equations and algorithms. Actual project operations may vary from those depicted by the Model due to circumstantial conditions of hydrology and weather, 4
5 facility operation, and human intervention. The FERC-approved study plan has identified a number of user-controlled variables for running alternatives. The fact that the Model provides these user-controlled inputs is not an indication that either the Districts or CCSF endorse or support any specific alternative developed by manipulating these inputs. 5
6 2.0 Geographical Range of Model and Underlying System Operation As mentioned above, the geographic scope of the Model extends for CCSF s Hetch Hetchy system to the confluence of the Tuolumne and San Joaquin Rivers, as generally depicted in Figure The Model comprises two primary subsystems -- the Districts Don Pedro Project and CCSF s Hetch Hetchy Project, which are independently owned and operated by the respective parties. The Don Pedro Project includes the Don Pedro Reservoir and powerhouse. It provides water storage and flood control benefits. Water that flows into Don Pedro Reservoir is either stored or passed through to the lower Tuolumne River. Included in the model is the projected diversion of water at La Grange to serve irrigation and M&I customers of MID and TID. A model node (calculation point) is provided at the Districts La Grange diversion dam, where the Model simulates flows to the Modesto Canal, the Turlock Canal, and the Tuolumne River below the La Grange diversion dam. The CCSF System is modeled as three physical reservoirs (Hetch Hetchy Reservoir, Lake Lloyd and Lake Eleanor), the San Joaquin Pipeline (SJPL), and an accounting for the Don Pedro Water Bank Account. All releases from the CCSF System, except those diverted to the SJPL enter Don Pedro Reservoir. A node is also provided to represent the location of the existing USGS stream flow gage entitled Tuolumne River at Modesto (Modesto). Additional nodes may be established above and/or below the Modesto gage node depending on the results of ongoing lower Tuolumne River accretion flow measurements. The Model components operate with systematic algorithms that attempt to mimic operational decisions for reservoir and facility operations. For each subsystem, certain operation constraints can be user-controlled consistent with the FERC-approved study plan. Within each subsystem, each reservoir has the same underlying operation protocol. A daily mass balance is performed: change in reservoir storage = inflow, minus outflow (releases), minus reservoir losses. If the calculation results in a reservoir storage that is in excess of preferred/maximum capacity, an additional release is made. Minimum releases for each modeled reservoir are in accordance with current stream flow requirements and diversion requirements. Each reservoir assumes a common hold-unless-need-to-release protocol, except as conditioned by minimum stream release requirements, diversions, preferred/maximum storage, snowmelt management releases, or other specified releases. In essence, each reservoir operates for its own reservoir conservation goal and retains storage as much as possible, only drawn down as needed to meet release requirements, diversions, or to achieve reservoir or flow management goals such as flood control or, in some cases hydropower. 6
7 Figure Tuolumne River Daily Operations Model Explicit contol point Reactive operation Tuolumne River Daily Operations Model CCSF Diversion (San Joaquin Pipeline) Unregulated Runoff from Watersheds Don Pedro Reservoir Unimpaired Runoff into CCSF System Reservoirs SFPUC System Reservoirs Regulated Release from CCSF System Reservoirs CCSF Water Bank Account Don Pedro Powerhouse TID Diversions MID Diversions Tuolumne River Total La Grange Dam Tuolumne River Minimum Required Release 7
8 3.0 Don Pedro Project and La Grange Diversion Dam The Don Pedro Project and the La Grange diversion dam operations are modeled to represent current operations for irrigation and municipal water deliveries, fishery and instream flow requirements and flood control. Hydropower production is a function of the releases made for these other purposes. The following elements of hydrology and objectives guide the modeled operation. 8
9 3.1 Reservoir Inflow Inflow to Don Pedro Reservoir is modeled as two components: 1) a fluctuating unregulated inflow to Don Pedro Reservoir, and 2) the regulated releases (regulated Don Pedro Reservoir inflow) from the CCSF System. The inflow will reflect a daily fluctuating pattern which is mostly associated with the unregulated component of runoff in the basin, which is approximately 40 percent of the total runoff in the basin. The unregulated component of inflow to Don Pedro Reservoir remains the same among all operation simulations. The regulated inflow to Don Pedro is based on a projected level of development and operation for the CCSF System. This component of Don Pedro Reservoir inflow may change among operation simulations due to changed assumptions for CCSF System demands and level of development, or due to user-controlled parameters. 9
10 3.2 MID and TID Canal Demand Figure is a schematic of the parameters used by modeling to create each District s diversion demand at La Grange diversion dam. Figure District Canal Demand Parameters New Don Pedro Reservoir Intercepted Flow Diversion Target Modesto Reservoir Reservoir Release Target La Grange Reservoir Turlock Lake Reservoir Release Target District GW Pumping Net Losses/ Net Losses/ District GW Pumping Seepage Seepage Municipal Delivery Canal Turnout Target Canal Turnout Target District Operational Spills Canal Losses Canal Losses Tuolumne River Each District District Operational Spills DWR Consumptive Use Model LOD Land Use (constant for all years) Monthly varying Met Data (Precipitation) Minimum (Base) Soil Water Balance less Private GW Consumptive Use of Applied Water (CUAW) Pumping Projected Demand of Applied Water (PDAW) Due to changing land use and cropping patterns, groundwater use and irrigation and canal management practices throughout history, the historical record of recorded diversions does not provide a consistent definition of water diversion needs. Similar to depicting inflow, the Model uses a projected level of development for establishing irrigation and canal diversion demand. The canal diversions are assumed to be driven by three components: 1) a fluctuating customer component, the (P)rojected (D)emand of (A)pplied (W)ater (PDAW), 2) a relatively constant depiction of operational system losses/efficiencies, and 3) a water supply availability factor based on Don Pedro Reservoir storage and inflow. The PDAW is developed through use of DWR s consumptive use model, and considers precipitation, ET rates, soil moisture criteria, rooting depth, irrigation indicators, and other factors along with land use to estimate the CUAW on a monthly basis. Monthly water use varies based on input ET rates, which are constant each year. CUAW will only vary each year based on variation in precipitation. The PDAW has been adjusted to 10
11 reflect other routine irrigation practices not identifiable with strict ET, such as pre-irrigation. The estimate of monthly PDAW is distributed daily based on the historical ( ) distribution of canal diversions within months. In addition to the PDAW requirement, several canal operation and management components are incorporated into the projected diversion demand. The following tables provide the monthly estimates used for each component, Table for MID and Table for TID. Table Canal Demand and Operation Components for MID Modesto Irrigation District Canal Canal System Modesto Res Municipal Turnout Nominal Operational Operational Losses Nominal and Upper Delivery Modesto Res Delivery Private GW Spills Spills below Intercepted MID GW Canal from Target Factor Pumping Critical Non-crit Modesto Res Flows Pumping Losses/Div Modesto Res Storage Month % TAF TAF TAF TAF TAF TAF TAF TAF TAF January February March April May June July August September October November December Total
12 Table Canal Demand and Operation Components for TID Turlock Irrigation District Canal Canal System Turlock Lk Other Turnout Nominal Operational Operational Losses Nominal and Upper Delivery Turlock Lk Delivery Private GW Spills Spills below Intercepted TID GW Canal from Target Factor Pumping Critical Non-crit Turlock Lk Flows Pumping Losses Turlock Lk Storage Month % TAF TAF TAF TAF TAF TAF TAF TAF TAF January February March April May June July August September October November December Total The turnout delivery factor is unique to each District and represents a modeling mechanism to adjust the PDAW for irrigation practices that are not included in the estimation of the CUAW, such as irrigation that provides for groundwater recharge. 12
13 3.3 Required FERC flows at La Grange Bridge The current FERC minimum flow requirements at La Grange Bridge are included in the Model. In the Model the terms La Grange releases, flows at La Grange Bridge or releases at La Grange diversion dam are used interchangeably to mean the minimum flow requirements under the Project s current FERC license as measured at the USGS gage Tuolumne River at La Grange, CA. The annual flow requirement is established for the April-March flow year beginning April based on pre-knowledge of the final San Joaquin River Index ( ) for the year. The annual volume including interpolation water is computed using the FERC Settlement Agreement procedures, which includes a revised year type distribution using a population of historical years. The interpolation water is assumed to be spread among April and May volumes. The Model assumes each month s volume of the annual volume is spread evenly across the days of the months, except during April and May where the user can define the distribution of daily flows. The user can define the distribution as: 1) total monthly volume spread evenly across all days of a month, or 2) a user-specified daily distribution of monthly volume during April and May. Figure illustrates the outcome of the two assumed flow distributions during April and May. The pulsing pattern option shown in Figure is being used by the Model. Figure User-specified Distribution of April and May FERC Flow Requirements Daily % of Monthly Volume FERC Flow Requirements Daily Parsing of Monthly Volume Option 1 Option 2 13
14 3.4 Reservoir and Release Management Don Pedro Reservoir storage is initially checked against a preferred storage target. The Model allows the user to establish the preferred storage target. The preferred storage target is the ACOE rainflood reservation objective, except after July 1, when there is no required reservation space. The preferred storage target reflects a drawdown to evacuate storage during the summer in late and wet runoff years. The preferred target storage is again equal to the ACOE objective on October 7. Figure illustrates the reservoir storage target used in the Model. Figure Reservoir Storage Guidance 2,500,000 Don Pedro Reservoir Storage Guidance Reservoir Storage (AF) 2,000,000 1,500,000 1,000, ,000 Preferred Storage Target ACOE Rainflood Objective 0 1/1 2/1 3/1 4/1 5/1 6/1 7/1 8/1 9/1 10/1 11/1 12/1 For a day of Don Pedro Reservoir operation, the day s inflow is a computed amount from upstream CCSF System operations and unregulated inflow. The stream flow requirements contained in the FERC license at La Grange Bridge and the MID and TID canal diversions are the release from Don Pedro Reservoir. The prior day s reservoir evaporation is included in the calculation. If the computation produces resulting Don Pedro Reservoir storage in excess (encroachment) of the preferred storage target, the encroachment is computed. Every 7 th day the model checks for an encroachment, and if it exists a check release is computed. It is assumed that a constant supplemental release (in excess of minimum releases) will be initiated at a rate equal to the encroachment divided equally over the next 10 days. This protocol repeats itself every 7 th day, reestablishing the level of check release each time. The end result of this procedure will allow encroachment of storage space above the preferred storage target and not require unrealistic hard releases of water to exactly conform to the target. A second check release is made during the April through June period for management of anticipated snowmelt runoff. On the first day of each of these months a forecast is made of anticipated runoff into the reservoir and minimum releases and losses from the reservoir from the date of forecast through the end of June (the assumed target date of reservoir filling). These forecasts determine the volume of water (if any) that will require release in excess of minimum releases and losses and storage gain by the end of June. For April and May, the DWR 90 percent exceedence forecast is used for anticipated runoff, along with known minimum releases and losses, and upstream impairment. The user defines 14
15 the percentage of volume (of the total volume) to be additionally released during each month. For April, 30 percent of the 3-month volume is advised for release, and during May 50 percent of the 2-month volume is advised for released. For June, the historically reported unimpaired flow (UF) flow is assumed for the runoff computation. This assumes pre-knowledge of the runoff volume for the month, and 100 percent of the excess is spread across the month. The snowmelt check release is evenly distributed across the days of the month. The release made in a day is the greater of the two check releases or the minimum release. At no time is the maximum capacity of the reservoir (2,030,000 acre-feet) allowed to be exceeded, and if necessary a release, regardless of magnitude, will be made by the Model to not exceed maximum storage capacity. A Modesto flood control objective is incorporated into the release logic. The objective is to maintain a flow at Modesto no greater than a user specified flow rate (assumed as 9,000 cfs). The logic checks against an allowable La Grange release considering the lower Tuolumne River accretions and Dry Creek flow. Model logic compares the La Grange allowable release to the other check releases. The La Grange release is then reduced if necessary to not exceed the Modesto flow target objective, even if it results in an encroachment in Don Pedro Reservoir. The exception is when the reservoir reaches full (2,030,000 AF). Any computed encroachment above a full reservoir is passed and the Modesto flow objective will be exceeded. Consistent with the original FERC license filings for the new Don Pedro Project, the minimum operating reservoir level is established at elevation 600 feet, corresponding to a storage volume of 308,960 AF. Below this elevation is referred to as the dead pool storage. 15
16 3.5 Water Supply Factor A constraint to the Districts canal diversions is recognized when there is a reduced water supply at Don Pedro Reservoir. The premise of the (W)ater (S)upply (F)actor (WSF) is to reduce the amount of water diverted to the canals during years when lack of carryover storage at Don Pedro Reservoir becomes a concern. The modeling mechanism used to reduce canal diversions is a factor applied to the PDAW of the canal demand. This mechanism results in a reduction to the amount of water turned out to the customers while still recognizing the relatively constant efficiencies of canal operations. The WSF is established by forecasting upcoming water supply, based on antecedent storage and anticipated inflow to Don Pedro Reservoir. The forecasting procedure begins in February and ends in April. The Factor Table is based on April forecast results. The February and March Forecasts act as adjustments to get to the April 1 state. The forecasts have the following protocol: February Forecast (forecasting April 1 state): End of January storage + Feb-Jul UF - Feb-Jul Upstream adjustment - Feb-Mar minimum river March Forecast (forecasting April 1 state): End of February storage + Mar-Jul UF - Mar-Jul Upstream adjustment - Mar minimum river April Forecast: (final) End of March storage + Apr-Jul UF - Apr-Jul Upstream adjustment Pre-knowledge of unimpaired runoff for each forecast period is assumed, as well as knowledge of upcoming upstream impairment of the runoff. The WSF factor / Don Pedro Storage + Inflow relationship is developed through iterations of multi-year system operation simulations. The WSF depicts actions that may be implemented during times of drought, and the projected canal diversions and reservoir storage operation during drought periods. The factors and index triggers were developed reviewing reservoir storage levels that occurred during the drought. 16
17 3.6 Power Generation Equations of Don Pedro powerhouse generation characteristics define capacity (MW) and efficiency (kwh/af), based on reservoir storage. Capacity potential uses minimum storage of the day, while efficiency uses average storage of the day. The maximum flow through plant is assumed to be 5,400 cfs. Water that does not appear as passing through the generators is computed to be spilled-bypassed. The power generation cutoff also occurs at the reservoir storage of 308,960 acre-feet or the top of dead pool. 17
18 3.7 User-Interface Adjustments The Model allows alternative user-specified data for two components of District operations: 1) user-specified assumptions for the La Grange Bridge minimum flow requirements, and 2) a user-specified diversion for the Districts canals. An alternative La Grange Bridge flow requirement can be incorporated by definition of required flows by periods within a year, based on year type. Entered in this protocol the input will result as a daily time series for the Model. Alternatively, a flow requirement can be entered as a daily time series. For an alternative canal diversion, an array has been provided to input a monthly by 39-year matrix of alternative canal diversions. The monthly array of data is parsed by the Model into daily distributions reflecting the current depicted daily distribution of canal diversions. 18
19 4.0 City and County of San Francisco System The Model representation of the CCSF System on the Tuolumne River includes the three physical reservoirs (Hetch Hetchy Reservoir, Lake Lloyd and Lake Eleanor), diversions to the Bay Area through the San Joaquin Pipeline, and an accounting for the Don Pedro Water Bank Account. The CCSF System is illustrated in Figure 4.0-1, with detail provided for the components of explicitly modeled hydrologic parameters. 19
20 Figure City and County of San Francisco System Holm from Lake Lloyd Operation and from Lake Eleanor Evaporation Lake Lloyd Releases below Lake Lloyd Unimpaired Runoff into Lake Lloyd Transfer to Lake Lloyd via Tunnel Evaporation Lake Eleanor Releases below Lake Eleanor Unimpaired Runoff into Lake Eleanor Unimpaired Runoff into Hetch Evaporation Hetch Hetchy Reservoir Total Holm Powerhouse User-specified Supplemental Release from CCSF System Derived from 1) Lake Lloyd, then 2) Hetch Hetchy Reservoir Unregulated Runoff Releases from Hetch Hetchy Reservoir CCSF Diversion (San Joaquin Pipeline) CCSF Study or User-specified Time-series Explicit contol point Reactive operation Don Pedro Reservoir SFPUC Water Bank Account 20
21 Each CCSF System reservoir has the same underlying operation protocol. A daily mass balance is performed: change in reservoir storage = inflow, minus outflow (releases), minus reservoir losses. If the calculation results in reservoir storage exceeding preferred/maximum capacity, an additional release of water is made. Minimum releases from each reservoir are in accordance with current requirements for Hetch Hetchy Reservoir, Lake Lloyd and Lake Eleanor. Each reservoir assumes a common hold-unless-need-to-release protocol, except as conditioned by minimum release requirements, diversions, preferred/maximum storage, snowmelt management releases, hydropower, or other flow or management objectives. In essence, each reservoir operates for its own reservoir conservation goal of retaining storage unless drawn down by demands or reservoir management objectives. CCSF is required by State law and its Charter to operate its system for water first. 21
22 4.1 Hetch Hetchy Reservoir Hetch Hetchy Reservoir storage is initially checked against a preferred storage target. The day s inflow is a given amount, and the SJPL diversion and minimum stream flow requirements below Hetch Hetchy Reservoir determine the release. The prior day s reservoir evaporation is included in the calculation. If the computation produces storage in excess (encroachment) of the preferred storage target, the encroachment is computed. Every 7 th day the model checks for the encroachment, and if it exists a check release is computed. It is assumed that a constant supplemental release (in excess of minimum releases) will be initiated at a rate equal to the encroachment divided equally over the next 7 days. This protocol repeats itself every 7 th day, reestablishing the level of check release each time. The end result of this procedure will allow encroachment of storage space above the preferred target storage and not require unrealistic releases of water to exactly conform to the target. A second check release is made during the February through June period for management of anticipated snowmelt runoff. On the first day of each of these months a forecast is made of anticipated runoff into the reservoir and minimum releases and losses from the reservoir from the date of forecast through the end of June (assumed target of reservoir filling). These forecasts determine the volume of water (if any) that will require release in excess of minimum releases and losses and storage gain by the end of June. Pre-knowledge is used for anticipated runoff, minimum releases and losses. The user defines the percentage of volume (of the total volume for the period) to be additionally released during each month. For February through April, 10 percent of the additional release volume is advised for release, and may be additionally capped. This approach tends to hold Hetch Hetchy Reservoir releases for later release during May. The snowmelt check release is evenly distributed across the days of the month and can be capped in terms of rate (cfs) or minimum volume of the reservoir to which it can be drawn during the month. The particular release made in a day is the greater of the two check releases or the minimum release. At no time is the maximum capacity of the reservoir allowed to be exceeded, and if necessary a release, regardless of magnitude, will be made by the Model to not exceed maximum storage capacity. For Hetch Hetchy Reservoir these two check releases typically guide the operation of the reservoir during the winter and spring. After reservoir filling, summer-time stream release requirements and the SJPL demand typically draw the reservoir down below the preferred storage targets. Canyon Tunnel, Kirkwood Powerhouse, Mountain Tunnel and Moccasin Powerhouse are not explicitly modeled. The structure of the Model depicts the component of inflow to Don Pedro Reservoir that originates from the Hetch Hetchy Reservoir watershed. The detail of flow reaches below Hetch Hetchy Reservoir is not needed. Therefore, the simple gradation of flow between flow removed from the stream system by the SJPL and the remaining flow that will eventually reach Don Pedro Reservoir is sufficient for purposes related to the relicensing of the Districts Don Pedro Project. 22
23 4.2 Lake Lloyd The same underlying reservoir operation protocols of Hetch Hetchy Reservoir apply to Lake Lloyd, with a couple of modifications. Instead of the SJPL demand being assumed as an initial release requirement, a minimum Holm Powerhouse release during May through August is assumed from Lake Lloyd. Both the initial check release for preferred storage encroachment and the snowmelt check release are computed and advised for reservoir operations. If supplemental releases above minimum releases are computed the Model routes the additional release through Holm Powerhouse up to its available capacity. The remainder of the supplemental release is routed to the stream below Lake Lloyd. A comparison is made between Lloyd-only use of Holm Powerhouse capacity and maximum capacity for passage to the Lake Eleanor model component. The operation goal linkage between Lake Lloyd and Lake Eleanor assumes that Lake Eleanor will transfer water from its watershed to Lake Lloyd for the purpose of enhancing power generation at Holm Powerhouse. Thus, any available capacity at Holm Powerhouse after the Lloyd-only operation is assumed available and desired for use of a Lake Eleanor transfer. If water is transferred from Lake Eleanor the Model assumes the water to be directly routed to Holm Powerhouse which then becomes additional release from Lake Lloyd. The inclusion of the Holm Powerhouse logic in the Lloyd/Eleanor watershed logic is only done to facilitate the interaction between the two watersheds. 23
24 4.3 Lake Eleanor Both the initial check release for preferred storage encroachment and the snowmelt check release are computed and employed into reservoir operations. In this instance of Lake Eleanor operations, the transfer desire for Holm Powerhouse generation is considered a disposition of the Lake Eleanor releases determined to be in excess of minimum stream requirements. To the extent that check (stream) releases are available from Lake Eleanor, they will be transferred. The amount transferred is limited by available Holm Powerhouse capacity and the assumed capacity of the Eleanor-Cherry Diversion Tunnel. The Lake Eleanor operation protocol will transfer water that would otherwise be released in excess of minimum flow requirements (largely dependent upon the preferred storage target and snowmelt releases) but it will not allow water to be pulled from Lake Eleanor to Lake Lloyd. 24
25 4.4 Don Pedro Inflow The three components of regulated releases from Hetch Hetchy Reservoir (not including the SJPL), Lake Lloyd and Lake Eleanor are combined with the unregulated runoff below CCSF System reservoirs to provide the inflow data set for Don Pedro Reservoir. 25
26 4.5 Water Bank Account A Water Bank Account calculation procedure is included in the Model. A running account of the Water Bank Account balance is computed daily, as limited by the Fourth Agreement and implementing agreement. The Model allows the computation of a negative balance. The accounting of the balance is incidental to model operations, and there is no auto-default feedback linkage to upstream operations if the balance is negative. To be consistent with current operations in the watershed, the user must employ the user-specified adjustment mechanism for supplemental CCSF System releases to remedy any negative balances. For purposes of the FERC investigation, the protocols of Fourth Agreement Water Bank Accounting have been amended to incorporate a hypothetical implementation of shared responsibility for incremental increases in FERC-required flows for the Tuolumne River. 1 The incremental increase in FERC-required flows is determined by the daily difference between the current FERC requirements and scenariorequired minimum flows. Approximately fifty-two percent ( %) of the incremental difference between the flow schedules is assigned as CCSF s responsibility and counted as a debit within Water Bank Accounting. 1 The shared responsibility assumption is presented for the purpose of evaluating alternative operations. The assumption shall not be used as evidence in any proceeding relating to and shall not act as precedence for any allocation of Tuolumne River water between CCSF and the Districts for any purpose under the Fourth Agreement. 26
27 4.6 User Interface Adjustments The Model allows alternative user-specified data for two components of CCSF operations: 1) user-specified supplemental releases from the CCSF System, and 2) user-specified SJPL diversions. The user-specified release from the CCSF System is to allow the user to pull additional water from the CCSF System as supplemental inflow to Don Pedro Reservoir. A single entry is established that will first pull water from Lake Lloyd so that water supply is preserved in the Hetch Hetchy Reservoir system for diversion to the SJPL. At a point when such supplemental releases strain Lake Lloyd storage, the supplemental releases are directed to Hetch Hetchy Reservoir. When employed, a daily flow release is directed from a reservoir at a point in logic after most of the previously described logic occurs. Thus, this release occurs in addition to what operation is already occurring by default. Such a release can affect the following day s default operation or previous periods operations, thus results require review to determine if the user s desired result occurs. It is also necessary to determine at the end of each simulation whether the operations depicted are consistent with the keeping of the Water Bank Account Balance from being negative. This adjustment capability is used to maintain the Water Bank Account Balance greater than zero. There is no auto-default logic to keep the Water Bank Account Balance from going negative. In a typical scenario of normal CCSF System operations during most years, for this level of modeling, the Water Bank Account would not affect CCSF upstream operations. The exception is during prolonged drought when the default reservoir operation of CCSF System reservoirs attempts to hold stream releases to a minimum. In the modeled WY 1971 to 2009, the period 1987 through 1992, and possibly other periods may drive the Water Bank Account to a negative condition. The release adjustment is used to provide additional releases from the CCSF System to avoid driving the Water Bank Account negative. The second adjustment to SF System hydrology can be made to the pre-specified time series of monthly SJPL diversion. The user is provided a tool to enter an alternative time series of data. This capability can be used to adjust CCSF System diversions from the Tuolumne River. 27
28 5.0 General Model Structure The Model was constructed within the platform of a Microsoft Excel 2010 workbook. All Model logic is contained within cells of the workbook with no macros or calls to other forms of programming such as Visual Basic for Applications. Numerous worksheets within the workbook represent logical groupings of either sub-system facilities and operations, or input/output functionality. The worksheets of the Model are briefly described in Table Some of the worksheets in the Model are fixed to prevent inadvertent changes to certain facility functions and operations. These aspects of the Model are consistent with the FERC-approved study plan. Table Model Worksheets Purpose Worksheet Name Description Model Operations UserInput* Contains user inputs for La Grange Requirements, Canal Diversions, CCSF SJPL and CCSF Supplemental Releases Control Contains inputs for facility characteristics and Test Case configuration DonPedro Contains model logic for Don Pedro Reservoir operation SFHetchHetchy Contains model logic for Hetch Hetchy Reservoir operation SFLloyd Contains model logic for Lake Lloyd operation SFEleanor Contains model logic for Lake Eleanor operation SFWaterBank Contains model logic for Water Bank operation WaterBankRel* Contains mode logic and user input for CCSF Supplemental Releases View Model DPGroup* Plots simulation of Don Pedro Reservoir operations and River flows Results HHGroup* Plots simulation of Hetch Hetchy Reservoir operation LloydGroup* Plots simulation of Lake Lloyd operation ELGroup* Plots simulation of Lake Eleanor operation WBGroup* Plots simulation of Water Bank Balance computation SFSysGroup* Plots simulation of CCSF System reservoirs DPGroup86_94* Plots simulation of Don Pedro Reservoir operation during SFGroup86_94* Plots simulation of CCSF System operation during ModelYearofDaily* Plots and tables any single parameter for a calendar or water year ModelAnyGroup* Plots any group of parameters for a calendar year ModelMonthTable* Plots and tables up to four parameters, summarizing daily data by month Model LaGrangeSchedule Contains model logic for 1995 FERC minimum flow requirements Operations DailyCanalsCompute Contains model logic for computation of daily District canal demand DailyCanals Contains model logic for computation of user-defined canal demand DPWSF Contains model logic for computation of Don Pedro water supply factor CCSF Contains model logic for CCSF release and diversion requirements Model Hydrology Contains input data for hydrology Inputs Contains input data for forecasting hydrology View Output* Results of scenario specific simulation in HEC-DSS format Output DSSAnyGroup* Plots any group of parameters for a calendar year from HEC-DSS format DSSMonthTable* Plots and tables up to four parameters, summarizing daily data by month from HEC-DSS format * Identifies worksheets accessible as user interfaces. 28
29 5.1 UserInput Worksheet This worksheet (UserInput) provides the interface for entering assumptions for minimum flow schedules for the lower Tuolumne River at La Grange Bridge, canal diversions by the Modesto Irrigation District and Turlock Irrigation District, supplemental releases to Don Pedro Reservoir from the CCSF System, and diversions by CCSF through the San Joaquin Pipeline. The worksheet is described below. Contents Description and Study Name Contents: Section 1 - Alternative Flow Requirements at La Grange Bridge Section 2 - Alternative Modesto and Turlock Canal Diversions Section 3 - Supplemental Release from CCSF Upstream Reservoirs Section 4 - Alternative CCSF San Joaquin Pipeline (UI 1.00) Enter Study Reference: Test_Case For Part 6 of DSS file (minimize length of name) User Defined Input Variables Affected by User Entered in Blue Shaded Cells This section provides an index of the contents included in the worksheet, and identifies a named label for the particular study. An alpha numeric entry is entered (UI 1.00) for the study name, which is then incorporated into the DSS output interface tab (see worksheet Output description). 29
30 Section 1: Minimum Flow Requirements at La Grange Bridge Section 1 - Alternative Flow Requirements La Grange Bridge This table is used to enter a user-specified minimum flow schedule at La Grange Bridge. Twenty-four time periods are available to define a flow rate. Six different water year types can be established. The year types correspond to the Preliminary Relicensing Year Type which is based on Tuolumne River unimpaired flow. (UI 1.10) Turn alterantive flow requirement on: 0 (1) on, and use alternative flow requirement, or (0) off, use current FERC flow requirement (UI 1.20) Use year type table below, or time series: 0 (1) for table below, or (0) for time series (Column BM) N/A Alternative Flow Requirements Existing FERC Flow Requirements at La Grange Bridge Enter values in CFS Values in CFS CYMo Day W AN N BN D C CYMo Day W AN N BN D C MM.DD MM.DD (UI 1.30) Preliminary Relicensing Year Type is based on a rank-ordering of the , water-year runoff for the years , Each water year type W, AN, N, and BN ,627 1, represent 20% of the years of ranking ,627 1, D and C year types each represent ,960 1,533 1,508 1,211 1, % of the years ,960 1,533 1,508 1,211 1, ,762 1,762 1, ,767 2,744 2,476 1,696 1, ,762 1,762 1, ,767 2,744 2,476 1,696 1, ,857 2,200 1, ,857 2,200 1, CCSF Responsibility* for La Grange Minimum Flows CCSF responsibility is applied as a daily debit in the computation of CCSF debit or credit in the Water Bank Account (0) not responsible, or (UI 1.31) (1) responsible for % of difference between *The shared responsibility assumption is presented for the purpose of evaluating FERC and scenario alternative operations. The assumption shall not be used as evidence in any requirement proceeding relating to and shall not act as precedence for any allocation of If responsibility option is selected, user Existing FERC flow requirements averaged within Preliminary Relicensing Tuolumne River water between CCSF and the Districts for any purpose under Feb-Jun should go to Section 3 of UserInput Year Type designations. Existing annual FERC schedules are assumed to begin the Fourth Agreement. (UI 1.40) Enter beginning month of annual flow requirement schedule: Feb and use supplemental CCSF releases April 1. Values shown for comparison purposes. 2 to maintain Water Bank Account > zero. This section provides an entry of the minimum flow schedule for the lower Tuolumne River. Switch UI 1.10 directs the use of the current 1995 FERC schedule (UI 1.10 = 0) or an alternative schedule (UI 1.10 = 1). If an alternative schedule is directed, Switch UI 1.20 directs the use of a userdefined daily times series (UI 1.20 = 0) or the use of a user-specified year type schedule (UI 1.20 = 1). Daily Time Series If the daily time series is directed, a flow value (expressed in average daily flow cfs) must be entered in Column BM of this worksheet for each day beginning October 1, 1970 through September 30, Year Type Schedule If the year type schedule is directed, values must be entered into the matrix provided at UI Values are entered as average daily flow (cfs) for 6 year types, for up to 24 discrete periods during the year. The periods are identified in MM.DD format. For instance, for a flow to be provided for January 1 through January 15 the flow would be identified with a period starting (January [01], day 1) and ending 30
31 with a different flow identified with a starting period of (January [01], day 16). The year type has been established by the naming of 6 year types, wet, above normal, normal, below normal, dry and critical. Using the water year runoff for the years 1921 through 2011 (91 years), the years were rank ordered from wettest to driest. The wettest 20 percent of the years (18 years) are designated the wet year type. The next wettest 18 years are designated the above normal year type. And so on for the normal and below normal year types. The driest 20 percent of years are split between the dry and critical year types. After the demarcation occurs for each year the data set is reduced to only the 1971 through 2009 modeling period (39 years). The reduced set of years of the modeling period maintains a year type frequency distribution similar to the larger data set s 20/20/20/20/10/10 percent frequency. Switch UI 1.40 directs the monthly sequence of the flow requirement year. For instance, if the flow schedule is to be established for a year beginning February 1 of the year, UI 1.40 would be set to Feb. The applicable year type schedule would be applied beginning February 1 of the year and continue through January 31 of the following year. Switch UI 1.40 can be set to any month February (Feb) through June (Jun). The current 1995 FERC minimum flows to the lower Tuolumne River at La Grange Bridge are illustrated in this section for comparison purposes only, and the values are arranged in the context of the year type designations described above. The values reflect an assumption of two equal periods of flow requirements during each month. If Switch UI 1.10 directs the use of the current schedule, the 1995 FERC schedule as defined by the 1995 FERC Settlement Agreement is implemented including the use of its definition of year types and discrete periods of flow requirements during the year. The 1995 FERC schedule is computed in worksheet LaGrangeSchedule. Shared responsibility for incremental increases in FERC-required flows for the Tuolumne River is enabled with Switch The incremental increase in FERC-required flows is determined by the daily difference between the current FERC requirements and scenario-required minimum flows. Approximately fifty-two percent ( %) of the incremental difference between the flow schedules is assigned as CCSF s responsibility and counted as a debit within Water Bank Accounting. If enabled, shared responsibility will cause an effect in the CCSF Water Bank Account which requires review and possible revision to CCSF supplemental releases. 2 The shared responsibility assumption is presented for the purpose of evaluating alternative operations. The assumption shall not be used as evidence in any proceeding relating to and shall not act as precedence for any allocation of Tuolumne River water between CCSF and the Districts for any purpose under the Fourth Agreement. 31
32 Section 2: Canal Diversions of Modesto Irrigation District and Turlock Irrigation District Section 2 - Alternative Modesto and Turlock Canal Diversions These tables are used to enter user-specified canal diversions for Modesto ID and Turlock ID. Enter a value for each month of each year. The monthly volumes of canal diversions are distributed daily within a month based on the daily distribution used for the Base case. (UI 2.10) Turn alterantive canal diversion on: 0 (1) on, and use table below, or (0) off, use Test Case canal diversion Prelim Alternative MID Canal Diversion Test Case MID Canal Diversion Relicense Enter values in acre-feet Values in acre-feet Full Dem Yr-Type WY Oct Nov Dec Jan Feb Mar Apr May Jun Jul Aug Sep Total WY WY Oct Nov Dec Jan Feb Mar Apr May Jun Jul Aug Sep Total WY Total WY (UI 2.20) N ,952 2,700 2,500 4,300 3,300 14,746 30,656 42,917 47,253 54,987 49,086 32, , ,952 2,700 2,500 4,300 3,300 14,746 30,656 42,917 47,253 54,987 49,086 32, , ,589 BN ,952 5,130 2,500 4,300 5,679 24,844 46,800 46,544 46,542 54,987 49,086 30, , ,952 5,130 2,500 4,300 5,679 24,844 46,800 46,544 46,542 54,987 49,086 30, , ,001 N ,952 2,700 2,500 4,300 3,300 14,746 23,737 45,374 47,016 54,987 49,086 32, , ,952 2,700 2,500 4,300 3,300 14,746 23,737 45,374 47,016 54,987 49,086 32, , ,356 AN ,952 2,700 2,500 4,300 3,300 14,746 18,115 42,917 45,239 49,733 49,086 32, , ,952 2,700 2,500 4,300 3,300 14,746 18,115 42,917 45,239 49,733 49,086 32, , ,246 AN ,952 5,460 2,500 4,300 3,300 14,746 28,782 44,672 47,253 54,859 43,423 32, , ,952 5,460 2,500 4,300 3,300 14,746 28,782 44,672 47,253 54,859 43,423 32, , ,906 C ,952 6,451 2,500 4,300 6,350 30,232 34,676 38,540 38,163 44,939 35,682 24, , ,952 6,451 2,500 4,300 6,350 30,232 34,676 38,540 38,163 44,939 35,682 24, , ,478 C ,568 5,081 2,500 4,300 6,379 17,127 30,279 23,572 28,282 33,405 30,961 19, , ,568 5,081 2,500 4,300 6,379 17,127 30,279 23,572 28,282 33,405 30,961 19, , ,195 W ,761 2,700 2,500 4,300 3,300 14,746 10,143 39,642 47,253 54,987 49,086 25, , ,761 2,700 2,500 4,300 3,300 14,746 10,143 39,642 47,253 54,987 49,086 25, , ,015 N ,490 2,700 2,500 4,300 3,300 14,746 27,340 45,140 47,253 53,962 49,086 32, , ,490 2,700 2,500 4,300 3,300 14,746 27,340 45,140 47,253 53,962 49,086 32, , ,475 W ,952 2,700 2,500 4,300 3,300 14,746 24,602 43,034 47,253 50,758 49,086 32, , ,952 2,700 2,500 4,300 3,300 14,746 24,602 43,034 47,253 50,758 49,086 32, , ,889 D ,236 7,441 2,500 4,300 3,300 14,746 33,395 45,608 47,253 54,987 49,086 32, , ,236 7,441 2,500 4,300 3,300 14,746 33,395 45,608 47,253 54,987 49,086 32, , ,510 W ,952 2,700 2,500 4,300 3,300 14,746 12,687 42,917 45,476 54,987 49,086 17, , ,952 2,700 2,500 4,300 3,300 14,746 12,687 42,917 45,476 54,987 49,086 17, , ,916 W ,952 2,700 2,500 4,300 3,300 14,746 11,058 40,110 47,253 54,987 47,529 15, , ,952 2,700 2,500 4,300 3,300 14,746 11,058 40,110 47,253 54,987 47,529 15, , ,301 AN ,952 2,700 2,500 4,300 3,300 14,746 37,719 46,777 47,253 54,859 49,086 32, , ,952 2,700 2,500 4,300 3,300 14,746 37,719 46,777 47,253 54,859 49,086 32, , ,695 BN ,952 2,700 2,500 4,300 3,300 14,746 33,106 46,193 45,950 54,987 49,086 31, , ,952 2,700 2,500 4,300 3,300 14,746 33,106 46,193 45,950 54,987 49,086 31, , ,700 W ,952 2,700 2,500 4,300 3,300 14,746 19,701 42,215 47,253 54,987 49,086 32, , ,952 2,700 2,500 4,300 3,300 14,746 19,701 42,215 47,253 54,987 49,086 32, , ,932 C ,952 7,441 2,500 4,300 3,300 11,348 33,450 38,540 38,264 45,048 40,977 26, , ,952 7,441 2,500 4,300 3,300 11,348 33,450 38,540 38,264 45,048 40,977 26, , ,868 C ,568 5,081 2,500 4,300 3,300 10,522 20,959 28,485 29,064 35,631 32,822 21, , ,568 5,081 2,500 4,300 3,300 10,522 20,959 28,485 29,064 35,631 32,822 21, , ,428 BN ,109 2,700 2,500 4,300 5,631 11,348 37,004 38,341 38,264 45,048 40,375 15, , ,109 2,700 2,500 4,300 5,631 11,348 37,004 38,341 38,264 45,048 40,375 15, , ,803 D ,568 5,361 2,500 4,300 5,590 15,190 29,936 21,644 29,236 34,588 31,919 20, , ,568 5,361 2,500 4,300 5,590 15,190 29,936 21,644 29,236 34,588 31,919 20, , ,883 BN ,125 6,242 2,500 4,300 5,812 10,324 26,779 32,222 30,198 37,899 33,900 23, , ,125 6,242 2,500 4,300 5,812 10,324 26,779 32,222 30,198 37,899 33,900 23, , ,335 C ,215 6,407 2,500 4,300 3,300 9,811 16,590 29,752 29,193 35,255 32,639 21, , ,215 6,407 2,500 4,300 3,300 9,811 16,590 29,752 29,193 35,255 32,639 21, , ,286 AN ,399 2,700 2,500 4,300 3,300 14,746 23,160 36,951 44,528 54,987 49,086 32, , ,399 2,700 2,500 4,300 3,300 14,746 23,160 36,951 44,528 54,987 49,086 32, , ,768 D ,952 2,700 2,500 4,300 3,300 17,718 28,427 26,707 38,264 45,048 40,977 26, , ,952 2,700 2,500 4,300 3,300 17,718 28,427 26,707 38,264 45,048 40,977 26, , ,956 W ,568 2,700 2,500 4,300 3,300 14,746 15,953 32,974 43,936 54,987 49,086 32, , ,568 2,700 2,500 4,300 3,300 14,746 15,953 32,974 43,936 54,987 49,086 32, , ,991 AN ,490 7,441 2,500 4,300 3,300 14,746 24,746 30,868 47,134 54,987 49,086 32, , ,490 7,441 2,500 4,300 3,300 14,746 24,746 30,868 47,134 54,987 49,086 32, , ,257 W ,952 2,700 2,500 4,300 3,300 14,746 45,935 45,491 46,542 54,987 49,086 32, , ,952 2,700 2,500 4,300 3,300 14,746 45,935 45,491 46,542 54,987 49,086 32, , ,197 W ,967 2,700 2,500 4,300 3,300 14,746 20,421 19,404 43,462 54,987 49,086 32, , ,967 2,700 2,500 4,300 3,300 14,746 20,421 19,404 43,462 54,987 49,086 32, , ,376 AN ,952 2,700 2,500 4,300 3,300 14,746 31,232 43,619 47,134 54,987 49,086 32, , ,952 2,700 2,500 4,300 3,300 14,746 31,232 43,619 47,134 54,987 49,086 32, , ,904 N ,236 6,781 2,500 4,300 3,300 14,746 19,989 29,347 38,722 54,987 49,086 32, , ,236 6,781 2,500 4,300 3,300 14,746 19,989 29,347 38,722 54,987 49,086 32, , ,187 BN ,952 5,790 2,500 4,300 3,300 14,746 21,863 44,204 46,898 54,987 49,086 31, , ,952 5,790 2,500 4,300 3,300 14,746 21,863 44,204 46,898 54,987 49,086 31, , ,040 N ,713 2,700 2,500 4,300 3,300 14,746 36,133 45,959 47,253 54,987 49,086 32, , ,713 2,700 2,500 4,300 3,300 14,746 36,133 45,959 47,253 54,987 49,086 32, , ,335 N ,490 2,700 2,500 4,300 3,300 14,746 27,196 44,087 47,253 54,987 47,670 32, , ,490 2,700 2,500 4,300 3,300 14,746 27,196 44,087 47,253 54,987 47,670 32, , ,888 BN ,490 6,781 2,500 4,300 5,959 25,777 51,269 46,777 47,253 54,987 49,086 32, , ,490 6,781 2,500 4,300 5,959 25,777 51,269 46,777 47,253 54,987 49,086 32, , ,369 W ,952 2,700 2,500 4,300 3,300 14,746 36,422 46,193 47,134 54,987 49,086 30, , ,952 2,700 2,500 4,300 3,300 14,746 36,422 46,193 47,134 54,987 49,086 30, , ,112 W ,982 6,121 2,500 4,300 3,300 14,746 13,115 41,747 47,253 54,987 49,086 32, , ,982 6,121 2,500 4,300 3,300 14,746 13,115 41,747 47,253 54,987 49,086 32, , ,640 D ,952 2,700 2,500 4,300 5,672 22,068 36,391 38,142 38,264 45,048 40,977 25, , ,952 2,700 2,500 4,300 5,672 22,068 36,391 38,142 38,264 45,048 40,977 25, , ,945 BN ,568 5,923 2,500 4,300 3,300 11,348 31,368 38,540 38,264 45,048 40,977 26, , ,568 5,923 2,500 4,300 3,300 11,348 31,368 38,540 38,264 45,048 40,977 26, , ,996 N ,568 5,361 2,500 4,300 3,300 14,746 47,088 44,204 46,661 54,987 49,086 31, , ,568 5,361 2,500 4,300 3,300 14,746 47,088 44,204 46,661 54,987 49,086 31, , ,443 Ave 19,262 4,197 2,500 4,300 3,830 15,412 28,160 38,984 42,875 50,662 45,333 28, ,177 Ave 19,262 4,197 2,500 4,300 3,830 15,412 28,160 38,984 42,875 50,662 45,333 28, , ,954 This section provides an entry of the diversions of the Modesto Irrigation District and Turlock Irrigation District. Switch UI 2.10 directs the use of Test Case diversions (UI 2.10 = 0) or user specified canal diversions (UI 2.10 = 1). If Test Case diversions are directed, a pre-processed daily time series of canal diversions is used. If directed to use user-specified canal diversions, the matrix tables shown at UI 2.30 (above for Modesto Irrigation District) and at UI 2.40 (below for Turlock Irrigation District) require input values for each month of each simulation year, beginning October 1970 (water year 1971) through September Values are entered as monthly volumes (acre-feet), which will be parsed by the Model into a daily distribution each month represented by the distribution pattern of the Test Case diversions. The Test Case diversions to the Modesto Canal and Turlock Canal are illustrated in this section for comparison purposes. 32
33 Prelim Alternative TID Canal Diversion Test Case TID Canal Diversion Relicense Enter values in acre-feet Values in acre-feet Full Dem Yr-Type WY Oct Nov Dec Jan Feb Mar Apr May Jun Jul Aug Sep Total WY WY Oct Nov Dec Jan Feb Mar Apr May Jun Jul Aug Sep Total WY Total (UI 2.30) N ,487 1,000 1,000 6,000 8,000 42,220 71,385 79,506 96, , ,372 51, , ,487 1,000 1,000 6,000 8,000 42,220 71,385 79,506 96, , ,372 51, , ,171 BN ,487 4,120 1,000 6,000 12,542 70, ,879 92,357 95, , ,372 50, , ,487 4,120 1,000 6,000 12,542 70, ,879 92,357 95, , ,372 50, , ,170 N ,487 1,000 1,000 6,000 8,000 42,220 44,833 89,056 96, , ,372 52, , ,487 1,000 1,000 6,000 8,000 42,220 44,833 89,056 96, , ,372 52, , ,149 AN ,487 1,000 1,000 6,000 8,000 42,220 39,626 82,689 92, , ,372 52, , ,487 1,000 1,000 6,000 8,000 42,220 39,626 82,689 92, , ,372 52, , ,851 AN ,487 4,761 1,000 6,000 8,000 42,220 59,410 85,755 96, ,430 92,559 52, , ,487 4,761 1,000 6,000 8,000 42,220 59,410 85,755 96, ,430 92,559 52, , ,756 C ,487 6,684 1,000 6,000 13,169 81,414 79,704 77,553 79,063 97,737 72,955 32, , ,487 6,684 1,000 6,000 13,169 81,414 79,704 77,553 79,063 97,737 72,955 32, , ,740 C ,773 1,000 1,000 6,000 13,371 50,509 72,025 45,645 54,416 68,098 57,243 26, , ,773 1,000 1,000 6,000 13,371 50,509 72,025 45,645 54,416 68,098 57,243 26, , ,171 W ,340 4,569 1,000 6,000 8,000 42,220 9,548 72,786 96, , ,372 37, , ,340 4,569 1,000 6,000 8,000 42,220 9,548 72,786 96, , ,372 37, , ,472 N ,487 1,000 1,000 6,000 8,000 42,220 53,683 87,405 96, , ,372 52, , ,487 1,000 1,000 6,000 8,000 42,220 53,683 87,405 96, , ,372 52, , ,521 W ,487 1,000 1,000 6,000 8,000 42,220 49,345 81,864 96, , ,372 52, , ,487 1,000 1,000 6,000 8,000 42,220 49,345 81,864 96, , ,372 52, , ,741 D ,487 7,966 1,000 6,000 11,130 42,220 78,153 90,235 96, , ,372 52, , ,487 7,966 1,000 6,000 11,130 42,220 78,153 90,235 96, , ,372 52, , ,093 W ,487 1,000 1,000 6,000 8,000 42,220 18,801 79,506 93, , ,372 26, , ,487 1,000 1,000 6,000 8,000 42,220 18,801 79,506 93, , ,372 26, , ,285 W ,487 1,000 1,000 6,000 8,000 42,220 14,289 73,376 96, ,397 97,046 25, , ,487 1,000 1,000 6,000 8,000 42,220 14,289 73,376 96, ,397 97,046 25, , ,047 AN ,487 1,000 1,000 6,000 8,000 42,220 89,260 92,475 95, , ,372 51, , ,487 1,000 1,000 6,000 8,000 42,220 89,260 92,475 95, , ,372 51, , ,901 BN ,487 1,000 1,000 6,000 8,000 42,220 80,930 92,003 92, , ,372 51, , ,487 1,000 1,000 6,000 8,000 42,220 80,930 92,003 92, , ,372 51, , ,195 W ,487 1,000 1,000 6,000 8,000 42,220 36,155 80,567 96, , ,372 50, , ,487 1,000 1,000 6,000 8,000 42,220 36,155 80,567 96, , ,372 50, , ,820 C ,487 7,645 1,000 6,000 11,080 37,117 80,884 77,453 79,756 97,972 82,761 40, , ,487 7,645 1,000 6,000 11,080 37,117 80,884 77,453 79,756 97,972 82,761 40, , ,376 C ,773 4,345 1,000 6,000 8,000 34,416 44,841 54,744 59,435 73,648 61,984 30, , ,773 4,345 1,000 6,000 8,000 34,416 44,841 54,744 59,435 73,648 61,984 30, , ,199 BN ,087 1,000 1,000 6,000 11,360 37,117 89,292 76,551 79,756 97,972 80,991 19, , ,087 1,000 1,000 6,000 11,360 37,117 89,292 76,551 79,756 97,972 80,991 19, , ,352 D ,773 4,889 1,000 6,000 11,491 42,592 67,733 41,090 58,355 70,954 59,683 28, , ,773 4,889 1,000 6,000 11,491 42,592 67,733 41,090 58,355 70,954 59,683 28, , ,968 BN ,239 5,799 1,000 6,000 12,548 33,362 63,975 63,689 62,376 79,506 64,759 32, , ,239 5,799 1,000 6,000 12,548 33,362 63,975 63,689 62,376 79,506 64,759 32, , ,153 C ,931 5,806 1,000 6,000 8,000 31,457 37,881 58,023 58,785 71,771 61,517 30, , ,931 5,806 1,000 6,000 8,000 31,457 37,881 58,023 58,785 71,771 61,517 30, , ,401 AN ,915 5,034 1,000 6,000 8,000 42,220 43,271 70,428 88, , ,372 52, , ,915 5,034 1,000 6,000 8,000 42,220 43,271 70,428 88, , ,372 52, , ,462 D ,487 4,441 1,000 6,000 8,000 42,220 67,460 54,104 79,756 97,972 82,761 39, , ,487 4,441 1,000 6,000 8,000 42,220 67,460 54,104 79,756 97,972 82,761 39, , ,710 W ,773 1,000 1,000 6,000 8,000 42,220 25,049 58,874 87, , ,372 52, , ,773 1,000 1,000 6,000 8,000 42,220 25,049 58,874 87, , ,372 52, , ,941 AN ,487 7,966 1,000 6,000 8,000 42,220 46,047 59,228 96, , ,372 52, , ,487 7,966 1,000 6,000 8,000 42,220 46,047 59,228 96, , ,372 52, , ,851 W ,487 1,000 1,000 6,000 8,000 42, ,135 91,532 95, , ,372 52, , ,487 1,000 1,000 6,000 8,000 42, ,135 91,532 95, , ,372 52, , ,405 W ,487 1,000 1,000 6,000 8,000 42,220 31,470 38,950 81, , ,372 52, , ,487 1,000 1,000 6,000 8,000 42,220 31,470 38,950 81, , ,372 52, , ,360 AN ,487 1,000 1,000 6,000 8,000 42,220 75,897 88,702 96, , ,372 52, , ,487 1,000 1,000 6,000 8,000 42,220 75,897 88,702 96, , ,372 52, , ,209 N ,487 5,723 1,000 6,000 8,000 42,220 36,503 56,634 83, , ,372 52, , ,487 5,723 1,000 6,000 8,000 42,220 36,503 56,634 83, , ,372 52, , ,081 BN ,487 4,761 1,000 6,000 8,000 42,220 49,518 83,515 96, , ,372 50, , ,487 4,761 1,000 6,000 8,000 42,220 49,518 83,515 96, , ,372 50, , ,542 N ,487 1,000 1,000 6,000 8,000 42,220 84,748 81,510 96, , ,372 52, , ,487 1,000 1,000 6,000 8,000 42,220 84,748 81,510 96, , ,372 52, , ,868 N ,487 1,000 1,000 6,000 8,000 42,220 66,179 82,454 96, ,397 99,129 52, , ,487 1,000 1,000 6,000 8,000 42,220 66,179 82,454 96, ,397 99,129 52, , ,999 BN ,487 6,363 1,000 6,000 8,000 42, ,474 89,763 91, ,042 96,725 52, , ,487 6,363 1,000 6,000 8,000 42, ,474 89,763 91, ,042 96,725 52, , ,970 W ,487 1,000 1,000 6,000 8,000 42,220 54,725 81,275 96, , ,731 48, , ,487 1,000 1,000 6,000 8,000 42,220 54,725 81,275 96, , ,731 48, , ,386 W ,487 6,363 1,000 6,000 8,000 42,220 29,387 71,607 96, , ,372 52, , ,487 6,363 1,000 6,000 8,000 42,220 29,387 71,607 96, , ,372 52, , ,968 D ,487 1,000 1,000 6,000 12,448 70,365 85,162 76,852 79,756 97,972 82,761 36, , ,487 1,000 1,000 6,000 12,448 70,365 85,162 76,852 79,756 97,972 82,761 36, , ,937 BN ,773 5,707 1,000 6,000 8,000 37,117 76,901 76,952 79,756 97,972 82,761 40, , ,773 5,707 1,000 6,000 8,000 37,117 76,901 76,952 79,756 97,972 82,761 40, , ,483 N ,773 4,617 1,000 6,000 8,000 42, ,144 85,047 95, , ,372 50, , ,773 4,617 1,000 6,000 8,000 42, ,144 85,047 95, , ,372 50, , ,676 Ave 27,456 3,271 1,000 6,000 8,952 43,791 61,044 74,917 87, ,669 92,511 44, ,697 Ave 27,456 3,271 1,000 6,000 8,952 43,791 61,044 74,917 87, ,669 92,511 44, , ,215 33
34 Section 3: Supplemental Releases of City and County of San Francisco This section provides entry of supplemental releases from CCSF upstream facilities. Switch UI 3.10 directs the use of a suggested method for defining daily supplemental releases (UI 3.10 = 1) or the use of a user-specified table of supplemental releases with or without consideration of Test Case supplemental releases (UI 3.10 = 0), other methods. If the suggested daily supplemental releases method is selected (UI 3.10 = 1) the user must go to worksheet WaterBankRel to complete Model input (see worksheet WaterBankRel description). If the other methods path is selected (UI 3.10 = 0) the user must provide additional direction. Switch UI 3.20 directs the use of Test Case supplemental releases (UI 3.20 = 0) or the use of a user-specified table of supplemental releases (UI 3.20 = 1). The user must also direct the consideration of Test Case supplemental releases. To only use the user-specified table of supplement releases, Switch UI 3.30 is set to 0. To add Test Case supplemental releases to the user-specified table of supplemental releases, Switch UI 3.30 is set to 1. The format and application of the user-specified table is the same as described for the entry of alternative flow requirements in Section 1. Values must be entered into the matrix provided at UI Values are entered as a daily volume (acre-feet) for 6 year types, for up to 24 discrete periods during the year. The periods are identified in MM.DD format. The year type has been established by the naming of 6 year types, wet, above normal, normal, below normal, dry and critical. Switch UI 3.50 directs the monthly sequence of the supplemental release year. For instance, if the schedule is to be established for a year beginning February 1 of the year, UI 3.50 would be set to Feb. The applicable year type schedule would be applied beginning February 1 of the year and continue through January 31 of the following year. Switch UI 3.50 can be set to any month February (Feb) through June (Jun). The Test Case supplemental release schedule is illustrated in this section for information purposes. 34
35 Section 3 - Supplemental Release from CCSF Upstream Reservoirs This table is used to enter a user-specified supplemental release from CCSF upstream reservoirs. Twenty-four time periods are available to define the period and flow rate. Six different water year types can be established. The year types correspond to the Preliminary Relicensing Year Type which is based on Tuolumne River unimpaired flow. The supplemental release will be directed to Lake Lloyd until the reservoir storage reaches a defined limit, then the supplemental release is directed to Hetch Hetchy Reservoir. User specifies whether or not Table supplemental releases are added to Test Case supplemental releases. Alternatively, user can define a daily supplemental release from CCSF facilities. This option is the same method used to define Test Base supplemental releases to maintain the Water Bank Balance at or above zero. (Suggested method) (UI 3.10) Use daily supplemental release option: 1 (1) on, use daily defined option - go to worksheet WaterBankRel, or (0) off, use other supplemental release options If using other supplement release options, Switch UI 3.10 = 0, enter choices below. (UI 3.20) Turn other user-specified supplemental releases on: 0 (1) on, and use table below, or (0) off, use existing Test Case supplemental releases N/A (UI 3.30) If using table below, add to existing supplemental releases: 1 (1) yes, add table to existing releases, or (0) no use table only Alternative Supplemental Releases Test Case Supplemental Releases (made to retain WB Balance above zero) Enter values in acre-feet per day Prelim CYMo Day W AN N BN D C Relicense Monthly Acre-feet MM.DD Yr-Type WY Oct Nov Dec Jan Feb Mar Apr May Jun Jul Aug Sep Total (UI 3.40) Preliminary Relicensing Year Type N is based on a rank-ordering of the BN ,000 2,000 water-year runoff for the years N ,000 2,000 Each water year type W, AN, N, and BN AN ,000 2,000 represent 20% of the years of ranking. AN ,000 2,000 D and C year types each represent C ,000 2,000 10% of the years. C ,000 2,000 W ,000 2,000 N ,000 2,000 W ,000 2,000 D ,000 2,000 W W AN BN W C C BN D BN C ,864 70,684 19,366 21, , AN D W Feb-Jun AN (UI 3.50) Enter beginning month of annual supplemental release schedule: Jun W W AN N BN N N BN W W D BN N Values are associated with Test Case scenario and are equal to daily supplemental releases made from CCSF facilities to maintain the Water Bank Account Balance at or above zero. Values are shown for comparison purposes. 35
36 Section 4: San Joaquin Pipeline Diversions of City and County of San Francisco Section 4 - Alternative CCSF San Joaquin Pipeline This section specifies the CCSF San Joaquin Pipeline diversion. Use Test Case diversions, or user-specified values by entering a value for each month of each year. The monthly volumes of pipeline diversions will be distributed daily within a month equally. (UI 4.10) Turn alterantive pipeline diversion on: 0 (0) off, use Test Case pipeline diversion, (1) on, use table below Prelim Alternative SJPL Diversion Test Case SJPL Diversion Relicense Enter values in acre-feet Values in acre-feet CCSF Sys Yr-Type WY Oct Nov Dec Jan Feb Mar Apr May Jun Jul Aug Sep Total WY WY Oct Nov Dec Jan Feb Mar Apr May Jun Jul Aug Sep Total WY Action (UI 4.20) N ,027 11,969 6,660 6,660 6,015 25,782 24,950 25,782 24,950 29,778 29,778 23, , ,027 11,969 6,660 6,660 6,015 25,782 24,950 25,782 24,950 29,778 29,778 23, ,286 0 BN ,881 16,572 12,368 17,124 15,467 25,782 25,779 25,782 24,950 29,778 29,778 24, , ,881 16,572 12,368 17,124 15,467 25,782 25,779 25,782 24,950 29,778 29,778 24, ,211 0 N ,881 14,731 12,368 6,660 6,015 6,660 16,572 25,782 24,950 29,778 29,778 23, , ,881 14,731 12,368 6,660 6,015 6,660 16,572 25,782 24,950 29,778 29,778 23, ,110 0 AN ,124 10,127 6,660 6,660 6,015 6,660 7,365 24,735 23,937 29,778 29,778 24, , ,124 10,127 6,660 6,660 6,015 6,660 7,365 24,735 23,937 29,778 29,778 24, ,789 0 AN , ,782 11,171 6,660 10,127 24,735 23,937 29,778 29,778 24, , , ,782 11,171 6,660 10,127 24,735 23,937 29,778 29,778 24, ,042 0 C ,124 13,810 12,368 19,027 17,186 25,782 26,699 25,782 24,950 29,778 29,778 24, , ,124 13,810 12,368 19,027 17,186 25,782 26,699 25,782 24,950 29,778 29,778 24, ,234 0 C ,881 16,572 17,124 17,124 15,467 25,782 27,620 26,638 25,779 27,589 25,782 21, , ,881 16,572 17,124 17,124 15,467 25,782 27,620 26,638 25,779 27,589 25,782 21, ,535 1 W ,027 16,572 12,368 6,660 6,015 6,660 9,023 22,833 22,096 29,778 29,778 23, , ,027 16,572 12,368 6,660 6,015 6,660 9,023 22,833 22,096 29,778 29,778 23, ,745 0 N ,124 13,810 17,124 15,222 6,015 17,124 22,096 25,782 24,950 29,778 29,778 23, , ,124 13,810 17,124 15,222 6,015 17,124 22,096 25,782 24,950 29,778 29,778 23, ,741 0 W , ,270 6,015 6,660 19,334 25,782 24,950 29,778 29,778 23, , , ,270 6,015 6,660 19,334 25,782 24,950 29,778 29,778 23, ,628 0 D ,124 13,810 12,891 12,368 11,171 22,833 23,937 25,782 24,950 29,778 29,778 23, , ,124 13,810 12,891 12,368 11,171 22,833 23,937 25,782 24,950 29,778 29,778 23, ,358 0 W ,124 11,969 9,323 6,660 6,015 6,660 6,445 19,979 19,334 29,778 29,778 26, , ,124 11,969 9,323 6,660 6,015 6,660 6,445 19,979 19,334 29,778 29,778 26, ,302 0 W ,979 11,969 6,660 6,660 6,015 6,660 7,365 12,368 11,969 29,778 29,778 28, , ,979 11,969 6,660 6,660 6,015 6,660 7,365 12,368 11,969 29,778 29,778 28, ,015 0 AN ,833 9,023 6,660 6,660 6,015 25,782 24,950 24,735 23,937 29,778 29,778 24, , ,833 9,023 6,660 6,660 6,015 25,782 24,950 24,735 23,937 29,778 29,778 24, ,099 0 BN , ,782 20,623 25,782 28,817 25,782 24,950 29,778 29,778 23, , , ,782 20,623 25,782 28,817 25,782 24,950 29,778 29,778 23, ,109 0 W ,881 18,413 12,368 19,027 6,015 6,660 14,731 25,782 24,950 29,778 29,778 23, , ,881 18,413 12,368 19,027 6,015 6,660 14,731 25,782 24,950 29,778 29,778 23, ,319 0 C ,124 13,810 17,124 17,124 15,467 25,782 26,239 25,782 24,950 29,778 29,778 24, , ,124 13,810 17,124 17,124 15,467 25,782 26,239 25,782 24,950 29,778 29,778 24, ,909 0 C ,881 16,572 12,368 19,027 17,186 25,782 27,620 25,782 24,950 27,589 26,638 21, , ,881 16,572 12,368 19,027 17,186 25,782 27,620 25,782 24,950 27,589 26,638 21, ,571 1 BN ,027 16,572 15,222 15,222 13,749 25,782 23,937 22,833 22,096 28,541 25,782 21, , ,027 16,572 15,222 15,222 13,749 25,782 23,937 22,833 22,096 28,541 25,782 21, ,937 1 D , ,782 20,623 25,782 28,817 22,833 22,096 28,541 25,782 21, , , ,782 20,623 25,782 28,817 22,833 22,096 28,541 25,782 21, ,458 1 BN ,027 16,572 12,891 17,124 15,467 19,979 22,096 22,833 22,096 27,589 25,782 21, , ,027 16,572 12,891 17,124 15,467 19,979 22,096 22,833 22,096 27,589 25,782 21, ,632 1 C ,027 16,572 15,222 15,222 6,015 21,881 21,175 22,833 22,096 27,589 25,782 21, , ,027 16,572 15,222 15,222 6,015 21,881 21,175 22,833 22,096 27,589 25,782 21, ,590 1 AN ,027 16,572 12,368 6,660 6,015 6,660 16,572 21,881 21,175 29,778 29,778 24, , ,027 16,572 12,368 6,660 6,015 6,660 16,572 21,881 21,175 29,778 29,778 24, ,435 0 D ,124 13,810 17,124 17,124 13,749 24,735 24,950 25,782 24,950 29,778 29,778 24, , ,124 13,810 17,124 17,124 13,749 24,735 24,950 25,782 24,950 29,778 29,778 24, ,855 0 W , ,368 6,874 6,660 13,810 22,833 22,096 29,778 29,778 24, , , ,368 6,874 6,660 13,810 22,833 22,096 29,778 29,778 24, ,124 0 AN ,124 13,810 12,891 6,660 6,015 6,660 18,413 24,735 23,937 29,778 29,778 24, , ,124 13,810 12,891 6,660 6,015 6,660 18,413 24,735 23,937 29,778 29,778 24, ,751 0 W ,124 7,365 6,660 6,660 6,015 19,979 23,937 25,782 24,950 29,778 29,778 23, , ,124 7,365 6,660 6,660 6,015 19,979 23,937 25,782 24,950 29,778 29,778 23, ,964 0 W ,881 11,969 12,368 6,660 6,015 6,660 6,445 19,979 19,334 29,778 29,778 24, , ,881 11,969 12,368 6,660 6,015 6,660 6,445 19,979 19,334 29,778 29,778 24, ,814 0 AN ,124 13,810 15,222 14,270 6,015 12,368 13,810 24,735 23,937 29,778 29,778 23, , ,124 13,810 15,222 14,270 6,015 12,368 13,810 24,735 23,937 29,778 29,778 23, ,785 0 N , ,782 11,171 6,660 23,937 25,782 24,950 29,778 29,778 23, , , ,782 11,171 6,660 23,937 25,782 24,950 29,778 29,778 23, ,898 0 BN ,027 13,810 12,368 19,027 12,889 17,124 22,096 25,782 24,950 29,778 29,778 23, , ,027 13,810 12,368 19,027 12,889 17,124 22,096 25,782 24,950 29,778 29,778 23, ,566 0 N ,124 13,810 9,323 15,222 13,749 24,735 23,937 25,782 24,950 29,778 29,778 24, , ,124 13,810 9,323 15,222 13,749 24,735 23,937 25,782 24,950 29,778 29,778 24, ,138 0 N ,979 14,731 6,660 6,660 6,015 25,782 24,950 22,833 22,096 29,778 29,778 24, , ,979 14,731 6,660 6,660 6,015 25,782 24,950 22,833 22,096 29,778 29,778 24, ,209 0 BN ,881 13,810 14,270 15,222 6,015 19,027 24,950 25,782 24,950 29,778 29,778 23, , ,881 13,810 14,270 15,222 6,015 19,027 24,950 25,782 24,950 29,778 29,778 23, ,400 0 W , ,368 6,874 6,660 13,810 24,735 23,937 29,778 29,778 24, , , ,368 6,874 6,660 13,810 24,735 23,937 29,778 29,778 24, ,868 0 W ,124 13,810 10,465 6,660 6,015 9,323 6,445 22,833 22,096 29,778 29,778 24, , ,124 13,810 10,465 6,660 6,015 9,323 6,445 22,833 22,096 29,778 29,778 24, ,276 0 D ,027 13,810 15,222 17,124 15,467 24,735 23,937 25,782 24,950 29,778 29,778 24, , ,027 13,810 15,222 17,124 15,467 24,735 23,937 25,782 24,950 29,778 29,778 24, ,561 0 BN ,881 16,572 12,368 9,323 6,015 21,881 23,937 25,782 24,950 29,778 29,778 24, , ,881 16,572 12,368 9,323 6,015 21,881 23,937 25,782 24,950 29,778 29,778 24, ,215 0 N ,979 14,731 17,124 17,124 6,015 6,660 23,937 25,782 24,950 29,778 29,778 23, , ,979 14,731 17,124 17,124 6,015 6,660 23,937 25,782 24,950 29,778 29,778 23, ,795 0 Ave 19,174 11,586 10,056 13,763 9,761 16,390 19,886 24,296 23,512 29,490 29,185 24, ,238 Ave 19,174 11,586 10,056 13,763 9,761 16,390 19,886 24,296 23,512 29,490 29,185 24, ,238 This section provides an entry for the diversions of the CCSF System to the San Joaquin Pipeline. Switch UI 4.10 directs the use of Test Case diversions (UI 4.10 = 0), or user-specified diversions (UI 4.10 = 1). If Test Case diversions are directed, a pre-processed time series of diversions is used. If directed to use user-specified diversions, the matrix table shown at UI 4.20 requires input values for each month of each simulation year, beginning October 1970 (water year 1971) through September Values are entered as monthly volumes (acre-feet), which will be parsed by the Model into an equal daily distribution each month. 36
37 5.2 WaterBankRel Workheet This worksheet (WaterBankRel) provides for entry of daily supplemental releases from the CCSF System. Without any other manual intervention the Model will direct releases from the CCSF System under a hold-unless-need-to-release protocol. Additional releases greater than provided by the default protocol may be needed. An example of such a need is during periods when CCSF System operations would otherwise deplete the Water Bank Account to a point of a negative balance. The manual adjustment to releases from the CCSF System is provided to allow the user to pull additional water from the CCSF System as supplemental inflow to Don Pedro Reservoir. A single entry is established that will first pull water from Lake Lloyd so that water supply is preserved in the Hetch Hetchy Reservoir system for diversion to the SJPL. At a point when such supplemental releases strain Lake Lloyd storage, the supplemental releases are directed to Hetch Hetchy Reservoir. The supplemental release is directed from a reservoir at a point in logic after the default protocol releases occur. Thus, the release occurs in addition to what operation is already occurring by default. Such a release can affect the following day s default operation or previous periods operations, thus results require review to determine if the user s desired result occurs. This worksheet is employed when Switch UI 3.10 directs the use of this suggested method for defining daily supplemental releases (UI 3.10 = 1). Shown below is a snapshot of the worksheet. The worksheet provides the daily accounting of the Water Bank Account Balance for the Model. Information ported from other worksheets of the Model into this worksheet is Don Pedro Reservoir inflow (Column E) and the unimpaired flow at La Grange (Column F). These data and the protocols associated with Fourth Agreement Water Bank Balance accounting (Columns G through Column O) derive the daily credit or debit of CCSF and then the daily balance of the Water Bank Account (Column M). 37

38 For purposes of the FERC investigation, the protocols of Fourth Agreement Water Bank Accounting have been amended to incorporate a hypothetical implementation of shared responsibility for incremental increases in FERC-required flows for the Tuolumne River. 3 If running the option with shared responsibility has been selected (worksheet UserInput Switch UI 1.31 = 1), the incremental increase in FERC-required flows is determined by the daily difference between the current 1995 FERC Settlement requirements and scenario-required minimum flows. This computation occurs in worksheet LaGrangeSchedule with information regarding the scenario-required flows directed through worksheet UserInput. Approximately fifty-two percent ( %) of the incremental difference between the flow schedules is assigned as CCSF s responsibility and is ported into the worksheet in Column Q as a debit. This debit then enters the current protocols of Fourth Agreement Water Bank Accounting at Column J, and subsequently contributes to the determination of the daily Water Bank Account Balance (Column M). Water Bank Account Balances which are less than zero ( negative ) are highlighted, and the minimum balance, whether negative or positive, is reported in Cell M14. When a negative balance occurs, the user is to enter into Column T (WB Supplemental Release) a volume of release needed to maintain the Water Bank Account Balance at, or greater than zero. The Model will first direct the supplemental release to Lake Lloyd, 3 The shared responsibility assumption is presented for the purpose of evaluating alternative operations. The assumption shall not be used as evidence in any proceeding relating to and shall not act as precedence for any allocation of Tuolumne River water between CCSF and the Districts for any purpose under the Fourth Agreement. 38
39 and continue releases until storage at Lake Lloyd is drawn to a specified 45,000 acre-feet minimum level (shown in Cell Q10 and entered at worksheet CCSF Switch 3.00). Subsequent supplemental releases will be drawn from Hetch Hetchy Reservoir any time storage is less than the Lake Lloyd minimum. The result of entering the supplemental release will cause a recalculation of the entire Model with results refreshed in the worksheet. Lake Lloyd, Hetch Hetchy Reservoir and Don Pedro Reservoir storage is ported from other worksheets to provide the status of their storage as supplemental releases are entered. Warnings and advice are provided in the worksheet when several conditions occur. The snapshots below illustrate the occurrence of these conditions. Example 1: A Reservoir Empties and the Model Crashes A warning has been provided that a reservoir has likely been depleted by the current operation assumptions. In this particular example, Tuolumne River minimum flows were increased with responsibility shared with CCSF, and a set of supplemental releases were established. In this iteration of results it is discovered in Column X (Hetch Hetchy Reservoir storage) an error (reported as #N/A ) on August 26, 1992 has occurred in the Model. By review of the previous day s storage results for Lake Lloyd (Column W), Hetch Hetchy Reservoir (Column X) and Don Pedro Reservoir (Column Y), and the rate of depletion for each of these reservoirs, it is concluded that Hetch Hetchy Reservoir likely drained on August 26 and thus crashed the Model. Although noted, a negative Water Bank Account Balance (Column M) will not cause the Model to crash. To remedy the condition, the user uses worksheet UserInput to revise (lower) SJPL diversions from Hetch Hetchy Reservoir (UI 4.10 and UI 4.20) and retain water in Hetchy Hetchy Reservoir for release. If Don Pedro Reservoir storage was the culprit of causing the Model to crash, the user uses worksheet UserInput to revise (lower) MID and TID canal diversions (UI 2.10, UI 2.20 and UI 2.30 to retain water in Don Pedro Reservoir for release. Alternatively, the user could reduce the scenario s designated minimum flow requirement, which would change flow needed from the upstream systems. 39
40 Example 2: Water Bank is Negative A warning has been provided that the Water Bank Account Balance is negative for one or more days of the scenario. In this instance, all Model reservoirs are operating within a viable operation (the Model did not crash due an emptying reservoir); however, the objective to maintain a positive Water Bank Account Balance has been violated. Upon inspection of the results the user can find the first instance of violation and remedy the violation by entry into Column T an amount of release that maintains at least a zero balance in the Water Bank Account Balance. For the first day of violation the reported negative balance (e.g., -3,253 acre-feet) is needed as a supplemental release. The ensuing days of supplemental release are informed by Column P. It is possible that within the remedy of Example 2 the error exemplified by Example 1 may occur as Hetchy Hetchy Reservoir may be drained through the efforts of maintaining a positive Water Bank Account Balance. At that point, the procedures of Example 1 will be required and the values already derived for supplemental releases may need to be revisited and possibly changed. 40
41 5.3 Control Workheet This worksheet (Control) provides an interface for entering assumptions for reservoir operations and several facility characteristics of District and CCSF facilities. The worksheet is described below. Contents Description and Study Name Operation Control Parameters and Facility Characteristics Variables Affecting Case and Facility Operation Contents: Section 1 - Don Pedro Reservoir and District Facilities Section 2 - CCSF Facilities Section 3 - Don Pedro Reservoir and CCSF Reservoir Elevation/Storage/Area and Evaporation Factors Section 4 - Don Pedro Reservoir Flood Control Reservation Space and Discretionary Target This section provides an index to the contents of this worksheet (Control). 41
42 Section 1: Don Pedro Reservoir and District Facilities Reservoir Management, Preferred Storage Target and Drawdown, Modesto Flood Control Objective, Snowmelt Runoff, and Storage Constraints Section 1 - Don Pedro Reservoir and District Facilities Reservoir Management Rainflood reservoir reservation space according to ACOE manual. "Flood control reservoir increases uniformly at a rate of 11,700 acre-feet per day from zero requirement on September 8 to the maximum reservation of 340,000 acre-feet by October 7. The reservation is maintained at 340,000 acre-feet through April 27 after which, unless additional reservation is indicated by the snowmelt parameters, it will decrease uniformaly at a rate of 9,200 acre-feet per day to zero requirement by June 3." Preferred Storage Targets ACOE through June 30. Target 1,906,000 acre-feet for July 31, 1,782,000 acre-feet August 31, and 1,692,000 acre-feet for September 30. UCOE thereafter. Reservoir Storage (AF) Don Pedro Reservoir Storage Guidance 2,500,000 2,000,000 1,500,000 1,000, , /1 2/1 3/1 4/1 5/1 6/1 7/1 8/1 9/1 10/1 11/1 12/1 Preferred Storage Target ACOE Rainflood Objective Modesto flood control objective Reservoir Storage Constraints/Objectives (C 1.00) 9,000 cfs. Target flow not to exceed in Tuolumne River below Modesto. 2,030,000 acre-feet Maximum reservoir storage (C 1.20) 308,960 acre-feet dead pool, cutoff of generation capability/no release* (C 1.21) 5,400 cfs maximum Don Pedro Powerhouse discharge Snowmelt release forecast parameters * The Model will not crash upon simulating an operation below dead pool. 90% exceedence DWR forecast of watershed runoff for April 1 and May 1 However, to conform with operational limitations the user is to modify input Historical watershed runoff for June 1 assumptions to maintain reservoir storage at or above dead pool. Release of forecasted excess runoff (C 1.10) 30 percent of April - June excess runoff during April (C 1.11) 50 percent of May - June excess runoff during May (C 1.12) 100 percent of June excess runoff during June This section describes the parameters that provide guidance to the management of Don Pedro Reservoir storage and provides entry of several parameters that advise reservoir operations. United States Army Corps of Engineers (ACOE) and preferred reservoir storage guidance is described. User specified values for specific storage targets are input in Section 4 of this worksheet. The maximum targeted flood flow in the Tuolumne River at Modesto (below Dry Creek) is entered at C Releases to the Tuolumne River will be constrained to not exceed this flow level when reservoir space is available in Don Pedro Reservoir to defer releases. Guidance is also provided for the release of anticipated runoff during the snowmelt runoff season. Values entered at C 1.10, C 1.11 and C 1.12 advise the amount of projected excess runoff (from the date of forecast through June) to be released during April, May and June. For instance, the value entered at C 1.10 (30 percent) advises the Model to release 30 percent of the excess runoff volume forecasted to occur during April through June during April. The Model estimates the total excess runoff volume as being the projected inflow to Don Pedro Reservoir less projected canal diversions, reservoir evaporation and minimum Tuolumne River flow requirements, with an objective to fill Don Pedro Reservoir at the end of June. An entry at C 1.20 directs the Model to cease 42
43 the simulation of power generation at Don Pedro Powerhouse when reservoir storage is below the value. A warning occurs when Don Pedro Reservoir storage is less than the value. The warning informs the study that the reservoir is being simulated below dead pool. The study should be revised through inputs in worksheet UserInput to remedy reservoir storage that is less than dead pool. The entry at C 1.21 informs the Model of the maximum flow through the Don Pedro powerhouse. Releases from Don Pedro Dam in excess of this value is labeled spill or bypassed at the dam. 43
44 FERC Minimum Flow Requirements FERC Minimum Flow Requirements FERC Flow Schedules (C 1.30) Year Type April - May distribution of spring migration volume Oct 1-15 (CFS) (C 1.40) 16 parts (days) during April Oct (CFS) (C 1.41) 15 parts (days) during May Total Base (AF) 7,736 7,736 9,223 9,223 11,068 11,504 18, parts total during April and May Attraction (AF) ,676 1,736 5,950 Total Oct (AF) 7,736 7,736 9,223 9,223 12,744 13,240 24,397 Forecast of San Joaquin River Index Nov (CFS) (C 1.50) 1 AF 8,926 8,926 8,926 8,926 10,711 10,413 17,852 1 Actual Dec (CFS) % Exc. AF 9,223 9,223 9,223 9,223 11,068 10,760 18, % Exc. Jan (CFS) Med. AF 9,223 9,223 9,223 9,223 11,068 10,760 18, % Exc. Feb (CFS) AF 8,331 8,331 8,331 8,331 9,997 9,719 16,661 April - May daily parsing of monthly volume of flow Mar (CFS) (C 1.60) 2 AF 9,223 9,223 9,223 9,223 11,068 10,760 18,447 1 Even Apr (CFS) Pulse AF 8,926 8,926 8,926 8,926 10,711 10,413 17,852 May (CFS) AF 9,223 9,223 9,223 9,223 11,068 10,760 18,447 Migration Flow AF 11,091 20,091 32,619 37,060 35,920 60,027 89,882 Jun (CFS) AF 2,975 2,975 2,975 4,463 4,463 4,463 14,876 Jul (CFS) AF 3,074 3,074 3,074 4,612 4,612 4,612 15,372 Aug (CFS) AF 3,074 3,074 3,074 4,612 4,612 4,612 15,372 Sep (CFS) AF 2,975 2,975 2,975 4,463 4,463 4,463 14,876 Total Annual 94, , , , , , ,926 Daily % of Monthly Volume FERC Flow Requirements Daily Parsing of Monthly Volume Option 1 Option 2 This section defines the 1995 FERC minimum flow requirements. Values are entered (C 1.30) for each defined flow period by year type, consistent with the FERC order issued July 31, Seven year types are defined based on the San Joaquin Basin water supply index. The sequence year of the flow schedule begins in April and continues through the following March. The water supply index of each year of the simulation period is found in worksheet , and the projection method of the index is defined at C For the Test Case condition, the historical actual index is used. The volume of water interpolated between annual schedules is distributed among April and May in proportion to the values provided at C 1.40 (April) and C 1.41 (May). The total volume of water designated for April and May is distributed daily during April and May is directed by C If directed to use an equal distribution of the volume of flow during April and May, C 1.60 is set as 1. If C 1.60 is set as 2, two 7-day pulse flows will occur with the remaining volume evenly spread over the remaining days of the months. The pattern of these schedules can be modified in worksheet LaGrangeSchedule. 44
45 Test Case District Canal Demands Test Case Canal Demands Modesto Irrigation District Nominal Canal Canal Canal Mod Res Modesto Reservoir Turnout Private Operation Operation Losses blw Nominal & Upper Target March TO Factor Delivery GW Spills Spills Modesto Intercptd MID GW Canal Municipal Target Storage TO Del Factor Pumping Critical Non-crit Reservoir Flows Pumping Losses Delivery Storage Change Fac Break Month % TAF TAF TAF TAF TAF TAF TAF TAF TAF TAF Point Factor % (C 1.70) Jan Feb Mar Apr May Jun Jul Aug Sep Oct Nov Dec Total Turlock Irrigation District Nominal Canal Canal Canal Turlock Lk Turlock Lake Turnout Private Operation Operation Losses blw Nominal & Upper Target March TO Factor Delivery GW Spills Spills Turlock Intercptd TID GW Canal Target Storage TO Del Factor Pumping Critical Non-crit Lake Flows Pumping Losses Delivery Storage Change Fac Break Month % TAF TAF TAF TAF TAF TAF TAF TAF TAF TAF Point Factor % (C 1.80) Jan Feb Mar Apr May Jun Jul Aug Sep Oct Nov Dec Total This section of parameters contributes to the computation of District canal demands. The values entered at C 1.70 for Modesto Irrigation District and at C 1.80 for Turlock Irrigation District are utilized by worksheet DailyCanalsCompute in the projection of daily canal demands for the simulation period. These parameters represent various components of water supplies and disposition that result in the need for canal diversion. These components are combined with the projected demand for applied water associated with lands within the Districts. The projected demand for applied water is provided to the model in worksheet DailyCanalsCompute, and is adjusted by the turnout delivery factor entered in C 1.70 and C 1.80, which adjusts for applied water not associated with immediate consumptive use such as pre-irrigation and groundwater recharge. The computation of daily canal demand is processed by parsing the monthly values of C 1.70 and C 1.80 evenly across the days of a month and combining them with the monthly value of applied water that has been parsed daily in a pattern reflective of recent historical daily diversions for the canals. 45
46 Don Pedro Water Supply Factor Don Pedro Water Supply Factor Don Pedro M/TID The reservoir index method adds the end-of-march Don Pedro Reservoir storage Stor + Infl WS to the projected April through July inflow to assess water availability for diversion. Index Factor TAF % (C 1.90) , , , , , , The Don Pedro Water Supply Factor directs the reduction of District canal diversions during periods of anticipated limited water supply. The values at C 1.90 provide the model with a relationship between water availability at Don Pedro Reservoir and advised canal diversions. The parameters of the relationship is an index of water availability which is computed as the storage in Don Pedro Reservoir at the end of March plus the projected inflow into Don Pedro Reservoir for April through July, and the water supply factor which is applied to projected demand for applied water described above. A water supply factor of 1.00 will provide a diversion equal to projected canal demand (full demand). A water supply factor less than 1.00 will reduce the canal diversion to less than full canal demand. 46
47 Section 2: City and County of San Francisco Facilities Hetch Hetchy Reservoir This section provides parameters that direct or advise the operation of Hetch Hetchy Reservoir. Minimum flow releases below Hetch Hetchy Reservoir are directed by C 2.00, C 2.01 and C These parameters and schedules are consistent with the stipulations for the Canyon Power Project and the modifications thereof for Kirkwood Powerhouse Unit No. 3. The application of these flow schedules and the addition of 64 cfs to the minimum flow schedule below Hetch Hetchy Reservoir are embedded in model logic in worksheet CCSF. Section 2 - CCSF Facilities Hetch Hetchy Reservoir Control Minimum releases below reservoir (C 2.01) (C 2.02) 15,000 6,500 4,400 Schedule Index - Accum Inches or Storage Below Dam Flow Requirement - CFS Discretionary Schedule - Acre-feet CY Month A (1) B (2) C (3) CY Month A (1) B (2) C (3) CY Month A (1) B (2) C (3) (C 2.00) , , , , Reservoir Management Snowmelt release forecast parameters Target Storage - Acre-feet Historical watershed runoff used for all forecasts of inflow (perfect foresight) Soft Trgt Hard Limit CY Month EOM EOM (C 2.10) 1 320, ,360 Release of forecasted excess runoff Maximum advised release for snowmelt 2 320, ,360 (C 2.20) 10 percent of Februay - June excess runoff during February (C 2.25) 1,200 cfs - February 3 320, ,360 (C 2.21) 10 percent of March - June excess runoff during March (C 2.26) 1,150 cfs - March 4 320, ,360 (C 2.22) 10 percent of April - June excess runoff during April (C 2.27) 1,200 cfs - April 5 360, ,360 (C 2.23) 100 percent of May - June excess runoff during June (C 2.28) 100,000 cfs - May 6 360, ,360 (C 2.24) 100 percent of June excess runoff during June (C 2.29) 100,000 cfs - June 7 360, , , ,360 Minimum storage of draw down for snowmelt release Target storage for filling at end of June 9 360, ,360 (C 2.30) 100,000 acre-feet (C 2.31) 360,360 acre-feet , , , , , ,360 Values entered at C 2.10 advise the management of reservoir storage throughout a year. The hard limit entered into C 2.10 directs the maximum allowed storage in Hetch Hetchy Reservoir at the end of each month. Model logic will not allow exceedence of these values and will release addition water from the facility if needed to not exceed the values. The soft target, also representing a value at the end of each month, when 47
48 exceeded advises the Model to make additional releases in order to not exceed that reservoir storage. Model logic computes the storage exceedence, if any, every seventh day and advises a release in addition to minimum releases. The rate of this additional release is equal to the exceedence volume spread over seven days. For transitional months when the soft target value at the end of a month differs from a previous month, the transition in storage target is parsed equally within the days of the month. Entries at C 2.20 through C 2.24 advise the amount of projected excess runoff (from the date of forecast through June) to be released during February, March, April, May and June. For instance, the value entered at C 2.20 (10 percent) advises the Model to release 10 percent of the excess runoff volume forecasted to occur during the February through June during February. The Model estimates the total excess runoff volume as being the projected inflow to Hetch Hetchy Reservoir less projected San Joaquin Pipeline diversions, deliveries to Groveland and Moccasin Fish Hatchery, reservoir evaporation and minimum flow requirements below Hetch Hetchy Reservoir, with an objective to fill Hetch Hetchy Reservoir at the end of June. Entries at C 2.25 through C 2.29 work in concert with the advised snowmelt runoff releases, and limit the rate at which those releases will be made. The functionality of the limit provides an ability to manage releases in recognition of downstream facility protection, the efficiency of releases through power generation facilities and reservoir storage goals. The example of C 2.25 being set as 1,200 cfs for February results in the advised snowmelt release being limited to no more than that value regardless of the rate of release advised by the projection of excess runoff. These releases are in addition to the already established minimum releases described previously. C 2.30 and C 2.31 also affect the advisement of snowmelt runoff releases. C 2.30 limits the drawdown of Hetch Hetchy Reservoir for snowmelt runoff, and its value will limit the release to not lower Hetch Hetchy reservoir storage below such value. C 2.31 directs the storage goal for Hetch Hetchy Reservoir at the assumed fill date of the end of June. Lake Lloyd The section of parameters that direct or advise the operation of Lake Lloyd (show below) is very similar in content and structure as the section just described for Hetch Hetchy Reservoir. Minimum flow releases below Lake Lloyd are directed by C 2.40 and C A single schedule of flow requirements is provided for Lake Lloyd and is consistent with the stipulations for the Cherry River Project. The application of the flow schedule is embedded in Model logic in worksheet CCSF. Entry of a value at C 2.41 provides a release from Lake Lloyd through Holm Powerhouse during the months of May through August, established as 950 cfs for four hours per day. The entry at C 2.41 also advises the maximum flow rate through Holm Powerhouse. Values entered at C 2.50 advise the management of reservoir storage throughout a year. The hard limit entered into C 2.50 directs the maximum allowed storage in Lake Lloyd at the end of each month. Model logic will not allow exceedence of these values and will release addition water from the facility if needed to not exceed the values. The soft target, also representing a value at the end of each month, when exceeded advises the Model to make additional releases in order to not exceed that reservoir storage. Model logic computes the storage exceedence, if any, every 48
49 seventh day and advises a release in addition to minimum releases. The rate of this additional release is equal to the exceedence volume spread over seven days. For transitional months when the soft target value at the end of a month differs from a previous month, the transition in storage target is parsed equally within the days of the month. Entries at C 2.60 through C 2.64 advise the amount of projected excess runoff (from the date of forecast through June) to be released during February, March, April, May and June. The model estimates the total excess runoff volume as being the projected inflow to Lake Lloyd less reservoir evaporation, minimum flow requirements below Lake Lloyd and releases to Holm Powerhouse, with an objective to fill Lake Lloyd at the end of June. Entries at C 2.65 through C 2.69 work in concert with the advised snowmelt runoff releases, and limit the rate at which those releases will be made. C 2.70 and C 2.71 also affect the advisement of snowmelt runoff releases. These releases are in addition to the already established minimum releases described previously. C 2.70 limits the drawdown of Lake Lloyd for snowmelt runoff, and its value will limit the release to not lower Lake Lloyd storage below such value. C 2.71 directs the storage goal for Lake Lloyd at the assumed fill date of the end of June. Lake Lloyd Control Minimum releases below reservoir Blw Lake Lloyd - CFS Holm Target Releases CY Month Flow Req (C 2.40) 1 5 May (Memorial Day) thru (C 2.41) 2 5 August (Labor Day) 3 5 Holm Capacity 950 cfs 4 5 Day 1,884 acre-feet hours per day 314 acre-feet Reservoir Management Snowmelt release forecast parameters Target Storage - Acre-feet Historical watershed runoff used for all forecasts of inflow (perfect foresight) Soft Trgt Hard Limit CY Month EOM EOM (C 2.50) 1 238, ,300 Release of forecasted excess runoff Maximum advised release for snowmelt 2 238, ,300 (C 2.60) 20 percent of Februay - June excess runoff during February (C 2.65) 1,000 cfs - February 3 238, ,300 (C 2.61) 25 percent of March - June excess runoff during March (C 2.66) 1,000 cfs - March 4 273, ,300 (C 2.62) 33 percent of April - June excess runoff during April (C 2.67) 1,000 cfs - April 5 273, ,300 (C 2.63) 50 percent of May - June excess runoff during June (C 2.68) 1,000 cfs - May 6 273, ,300 (C 2.64) 100 percent of June excess runoff during June (C 2.69) 1,000 cfs - June 7 268, , , ,300 Minimum storage of draw down for snowmelt release Target storage for filling at end of June 9 248, ,300 (C 2.70) 100,000 acre-feet (C 2.71) 273,300 acre-feet , , , , , ,300 49
50 Lake Eleanor This section provides parameters that direct or advise the operation of Lake Eleanor. Minimum flow releases below Lake Eleanor are directed by C These flow schedules are consistent with the stipulations for the Cherry-Eleanor Pumping Station. The application of these flow schedules are embedded in Model logic in worksheet CCSF, and always assume the schedule associated with pumping. An entry at C 2.81 directs the maximum flow rate through the Eleanor-Cherry Diversion Tunnel. This value may limit the rate at which water can be transferred from Lake Eleanor to Lake Lloyd. Lake Eleanor Control Minimum releases below reservoir Blw Lake Eleanor - CFS w/pump w/o CY Month Flow Req Flow Req (C 2.80) Always uses w/pump flow requirement Eleanor to Lloyd tunnel capacity (C 2.81) 400 cfs Reservoir Management Snowmelt release forecast parameters Target Storage - Acre-feet Historical watershed runoff used for all forecasts of inflow (perfect foresight) Soft Trgt Hard Limit CY Month EOM EOM (C 2.90) 1 21,495 27,100 Release of forecasted excess runoff Maximum advised release for snowmelt 2 21,495 27,100 (C 2a.10) 20 percent of Februay - June excess runoff during February (C 2a.15) 2,000 cfs - February 3 21,495 27,100 (C 2a.11) 25 percent of March - June excess runoff during March (C 2a.16) 2,000 cfs - March 4 27,100 27,100 (C 2a.12) 33 percent of April - June excess runoff during April (C 2a.17) 2,000 cfs - April 5 27,100 27,100 (C 2a.13) 70 percent of May - June excess runoff during June (C 2a.18) 2,000 cfs - May 6 27,100 27,100 (C 2a.14) 100 percent of June excess runoff during June (C 2a.19) 2,000 cfs - June 7 27,100 27, ,100 27,100 Minimum storage of draw down for snowmelt release Target storage for filling at end of June 9 15,000 27,100 (C 2a.20) 1,000 acre-feet (C 2a.21) 27,100 acre-feet 10 15,000 27, ,000 27, ,250 27,100 Values entered at C 2.90 advise the management of reservoir storage throughout a year. The hard limit entered into C 2.90 directs the maximum allowed storage in Lake Eleanor at the end of each month. Model logic will not allow exceedence of these values and will release addition water from the facility if needed to not exceed the values. The soft target, also representing a value at the end of each month, when exceeded advises the Model to make additional releases in order to not exceed that reservoir storage. Model logic computes the storage exceedence, if any, every seventh day and advises a release in addition to minimum releases. The rate of this additional release is equal to the exceedence volume spread 50
51 over seven days. For transitional months when the soft target value at the end of a month differs from a previous month, the transition in storage target is parsed equally within the days of the month. Entries at C 2a.10 through C 2a.14 advise the amount of projected excess runoff (from the date of forecast through June) to be released during February, March, April, May and June. The model estimates the total excess runoff volume as being the projected inflow to Lake Eleanor less reservoir evaporation and minimum flow requirements below Lake Eleanor, with an objective to fill Lake Eleanor at the end of June. Entries at C 2a.15 through C 2a.19 work in concert with the advised snowmelt runoff releases, and limit the rate at which those releases will be made. These releases are in addition to the already established minimum releases described previously. C 2a.20 and C 2a.21 also affect the advisement of snowmelt runoff releases. C 2a.20 limits the drawdown of Lake Eleanor for snowmelt runoff, and its value will limit the release to not lower Lake Eleanor storage below such value. C 2a.21 directs the storage goal for Lake Eleanor at the assumed fill date of the end of June. CCSF Water Supply Parameters The matrix describing the San Francisco water supply parameters provides the model information to report the state of Test Case condition water supply action levels and the potential changes in the occurrence of action level due to alternative operations. CCSF Water Supply Parameters Actions Trigger Action Level Tot Sys Stor % Del Reduc (C 2a.30) ,100, ,100, , Entries at C 2a.30 represent the relationship between CCSF total system storage (at the end of June each year) and the advisement of water supply actions. Total system storage includes CCSF s local watershed reservoirs, its Hetch Hetchy Project reservoirs, and also the Don Pedro Water Bank Account Balance. Local watershed storage is provided from CCSF s system operation model (HHLSM) as pre-processed values for the simulation period. These values are combined with the Model s depiction of CCSF reservoir storage for the Tuolumne River system to depict total system storage. A water supply action level for each year of each study is determined by the matrix, relating total system storage thresholds to advised action levels. For instance, if total system storage at the end of June of a year is greater than 700,000 acre-feet and less than 1,100,000 acre-feet, an action level of 10 percent rationing is advised. The CCSF Test Case condition SJPL diversions include the effect of occasional water delivery shortages due to these water supply parameters. 51
52 Section 3: Don Pedro Reservoir and CCSF Elevation/Storage/Area and Evaporation Factors The section provides entry of the physical elevation/storage/area relationship for Don Pedro Reservoir and CCSF reservoirs. The values entered at C 3.00 for Hetch Hetchy Reservoir, Lake Lloyd, Lake Eleanor and Don Pedro Reservoir are currently being used by the Model. The Model employs a table lookup function to determine the area of a reservoir based on storage. The area is multiplied by a reservoir s evaporation factor for the estimation of reservoir evaporation. The monthly evaporation factor for CCSF reservoirs is entered at C 3.10 and Don Pedro Reservoir s evaporation factors are entered at C These reservoir rating tables and evaporation factors are consistent with the daily accounting of Tuolumne River flows between the Districts and CCSF. 52
53 Section 3 - Don Pedro Reservoir and CCSF Reservoir Elevation/Storage/Area and Evaporation Factors (C 3.00) Hetch Hetchy Reservoir Lake Lloyd Lake Eleanor Don Pedro Reservoir Elev - FT Stor - AF Area- Ac Elev - FT Stor - AF Area- Ac Elev - FT Stor - AF Area- Ac Elev - FT Stor - AF Area- Ac Evaporation Factors CCSF Reservoirs (C 3.10) CFS/Ac/Day Jan 1 = Feb 2 = Mar 3 = Apr 4 = May 5 = Jun 6 = Jul 7 = Aug 8 = Sep 9 = Oct 10 = Nov 11 = Dec 12 = Evaporation Factors Don Pedro Reservoir (C 3.20) CFS/Ac/Day Jan 1 = Feb 2 = Mar 3 = Apr 4 = May 5 = Jun 6 = Jul 7 = Aug 8 = Sep 9 = Oct 10 = Nov 11 = Dec 12 =
54 Section 4: Don Pedro Reservoir Flood Control Reservation and Discretionary Target The section provides for the entry of the preferred storage target for Don Pedro Reservoir. Values entered at C 4.00 and C 4.01 advises the management of reservoir storage throughout a year. A hard limit of 2,030,000 acre-feet directs the maximum allowed storage in Don Pedro Reservoir at the end of each month. Model logic will not allow exceedence of these values and will release addition water from the facility if needed to not exceed the values. The soft target ( Final Target Storage at C 4.00), also representing a value at the end of each day, when exceeded advises the model to make additional releases in order to not exceed that reservoir storage. Model logic computes the storage exceedence, if any, every seventh day and advises a release in addition to minimum releases. The rate of this additional release is equal to the exceedence volume spread over ten days. For transitional months when the soft target value at the end of a month differs from a previous month, the transition in storage target is parsed equally within the days of the month. 54
55 Section 4 - Don Pedro Reservoir Flood Control Reservation Space and Preferred Storage Target ACOE thru June Full Res 1,906,000 (2,030,000) Jul 31 Don Pedro Reservoir Storage Guidance Less 1,782,000 2,500,000 ACOE Aug 31 RF Space 1,692,000 Sep 30 2,000,000 UCOE therefter 1,500,000 Preferred Storage Target ACOE Rainflood Objective (C 4.00) 1,000,000 Don Pedro Reservoir FC/Discretionary/Drawdown Space Add Add Final Mo/Day ACOE DP RF Descr Descr Target 500,000 Mo/Day Index RF Space Storage Storage Modifier Storage 0 AF AF AF AF AF 1/1 2/1 3/1 4/1 5/1 6/1 7/1 8/1 9/1 10/1 11/1 12/1 1/ ,000 1,690,000 1,690,000 1/ ,000 1,690,000 1,690,000 (C 4.01) 1/ ,000 1,690,000 1,690,000 Discretionar 1/ ,000 1,690,000 1,690,000 ACOE Rainflood (AF) End-of-month Guide AF 1/ ,000 1,690,000 1,690,000 Jan 1,690,000 Jul 2,030,000 1 Jan 0 1/ ,000 1,690,000 1,690,000 Feb 1,690,000 Aug 2,030,000 2 Feb 0 1/ ,000 1,690,000 1,690,000 Mar 1,690,000 Sep 1,772,600 3 Mar 0 1/ ,000 1,690,000 1,690,000 Apr 1,717,600 Oct 1,690,000 4 Apr 0 1/ ,000 1,690,000 1,690,000 May 2,002,800 Nov 1,690,000 5 May 0 1/ ,000 1,690,000 1,690,000 Jun 2,030,000 Dec 1,690,000 6 Jun 0 1/ ,000 1,690,000 1,690,000 7 Jul 0 1/ ,000 1,690,000 1,690,000 8 Aug 0 1/ ,000 1,690,000 1,690,000 9 Sep 0 1/ ,000 1,690,000 1,690, Oct 0 1/ ,000 1,690,000 1,690, Nov 0 1/ ,000 1,690,000 1,690, Dec 0 1/ ,000 1,690,000 1,690,000 Reservoir Storage (AF) The guidance provided by this parameter manages Don Pedro Reservoir storage throughout the year for both ACOE objectives during the season of rainflood reservation space and additional discretionary reservoir storage space or targets to manage reservoir storage from one year to another. 55

56 5.4 Output Worksheet This worksheet (Output) provides an interface between Model computations and data summary and analysis tools. It also provides a formatted set of information usable for exchange into an HEC-DSS database file, such as used to provide information to the temperature models used for this FERC investigation. Information concerning HEC-DSS can be found on the HEC web site at: The structure and contents of worksheet Output accommodates the use of the HEC-DSS Excel Data Exchange Add-in which is an application for retrieving and storing interval time series data, in this circumstance the daily results of the Model. Results provided in worksheet Output are directly linked to the computational and input worksheets of the Model. For instance, the daily inflow to Don Pedro Reservoir listed in worksheet Output is the value provided to worksheet DonPedro for its computations, which is dependent upon several other computation worksheets. As such, any change to model assumptions or data which causes a recalculation by the model will automatically update the values in worksheet Output. To preserve or store the results of a particular model study a copy of the worksheet should be created with a unique tab name and its contents converted to values. The HEC-DSS Add-in could also be used to create a unique database file for later use. Alternatively, but storage consuming, the entire Model could be saved as a unique study. However, this approach is not recommended as the worksheet Output will continue to be dynamically linked to the model s computational worksheets and any subsequent change to model assumptions will overwrite the results previously provided in the worksheet. More than 80 parameters are reported in the worksheet, representing salient information concerning the simulated operations and hydrology of the Tuolumne River and the Districts and CCSF s facilities. Table provides a listing of the parameters including their HEC-DSS name parts. Shown below is a snapshot of the content and format of the worksheet. 56
57 Table Worksheet Output Parameters Column Col No DSS - Part B DSS - Part C Units Column Col No DSS - Part B DSS - Part C Units B 2 TUOLUMNERIVER FLOW-LAGRANGEUNIMP CFS BD 56 MIDCANAL MIDFULLREQ AF C 3 TUOLUMNERIVER FLOW-HHUNIMP CFS BE 57 TIDCANAL TIDAGPDAW AF D 4 TUOLUMNERIVER FLOW-LLOYDUNIMP CFS BF 58 TIDCANAL TIDMI AF E 5 TUOLUMNERIVER FLOW-ELEANORUNIMP CFS BG 59 TIDCANAL TIDFACT AF F 6 TUOLUMNERIVER FLOW-UNREGUNIMP CFS BH 60 TIDCANAL TIDNOMGWPRVT AF G 7 DONPEDRO FLOW-TOTINFLOW CFS BI 61 TIDCANAL TIDOPSPLS AF H 8 DONPEDRO FLOW-SUP1INFLOWLL AF BJ 62 TIDCANAL TIDLOSS AF I 9 DONPEDRO FLOW-SUP2INFLOWHH AF BK 63 TIDCANAL TIDINTCP AF J 10 DONPEDRO FLOW-INFLOWHH CFS BL 64 TIDCANAL TIDNOMGWDIST AF K 11 DONPEDRO FLOW-INFLOWLL CFS BM 65 TIDCANAL TIDUPSYSLOSSDIV AF L 12 DONPEDRO FLOW-INFLOWEL CFS BN 66 TIDCANAL TIDLKDIV AF M 13 DONPEDRO STORAGE AF BO 67 TIDCANAL TIDLKSTORCHNG AF N 14 DONPEDRO EVAP AF BP 68 TIDCANAL TIDFULLREQ AF O 15 DONPEDRO STORAGE-RFTRG AF BQ 69 DONPEDRO DPFACT UNIT P 16 DONPEDRO STORAGE-SOFTTRG AF BR 70 SANFRAN SFSJPLBASE AF Q 17 DONPEDRO RELEASE-7DAYENCRADVISE CFS BS 71 SANFRAN SFLOCALSTOR AF R 18 DONPEDRO RELEASE-SNOWADVISE CFS BT 72 SANFRAN SFSJPL AF S 19 DONPEDRO RELEASE-TOTAL CFS BU 73 SANFRAN SFTOTSYSSTOR AF T 20 DONPEDRO POWR-MW MW BV 74 SANFRAN SFTOTTRSYSSTOR AF U 21 DONPEDRO POWR-EFF kwh/af BW 75 SANFRAN SFSUPPREL UNIT V 22 DONPEDRO POWR-MWh MWh BX 76 SANFRAN SFSUPPTAB UNIT W 23 DONPEDRO RELEASE-PH AF BY 77 SANFRAN TRIGGER UNIT X 24 DONPEDRO RELEASE-BYPASS AF BZ 78 SANFRAN WBBAL UNIT Y 25 DONPEDRO FLOW-TOTCANALS AF CA 79 HETCH HATCH-GRVLND CFS Z 26 LAGRANGE RELEASE-MINQ CFS CB 80 HETCH HATCH-RTRN CFS AA 27 LAGRANGE RELEASE-TOTAL CFS CC 81 HETCH RELEASE-MINQ1 CFS AB 28 LAGRANGE RELEASE-MCANAL CFS CD 82 HETCH RELEASE-TOTMINQ CFS AC 29 LAGRANGE RELEASE-TCANAL CFS CE 83 HETCH RELEASE-7DAYENCRADVISE CFS AD 30 LAGRANGE FULLCANALREQ AF CF 84 HETCH RELEASE-SNOWADVISE CFS AE 31 RIVER FLOW-LTRACC1 CFS CG 85 HETCH RELEASE-TOTAL CFS AF 32 RIVER FLOW-LTRACC2 CFS CH 86 HETCH STORAGE AF AG 33 RIVER FLOW-LTRACC3 CFS CI 87 HETCH EVAP AF AH 34 RIVER FLOW-LTRACC4 CFS CJ 88 HETCH STORAGE-SOFTTRG AF AI 35 RIVER FLOW-DRYCK CFS CK 89 LLOYD RELEASE-MINSTRMQ CFS AJ 36 RIVER FLOW-LTRACC5 CFS CL 90 LLOYD RELEASE-MINHOLM CFS AK 37 RIVER FLOW-TR1 CFS CM 91 LLOYD RELEASE-7DAYENCRADVISE CFS AL 38 RIVER FLOW-TR2 CFS CN 92 LLOYD RELEASE-SNOWADVISE CFS AM 39 RIVER FLOW-TR3 CFS CO 93 LLOYD RELEASE-LLOYDONLYHOLM CFS AN 40 RIVER FLOW-TR4 CFS CP 94 LLOYD HOLMAVAILEL CFS AO 41 RIVER FLOW-MODMAX CFS CQ 95 LLOYD RELEASE-TOTHOLM CFS AP 42 RIVER FLOW-MODMAXLG CFS CR 96 LLOYD RELEASE-TOTLLOYD CFS AQ 43 RIVER FLOW-MODESTO CFS CS 97 LLOYD STORAGE AF AR 44 RIVER FLOW-TR5 CFS CT 98 LLOYD EVAP AF AS 45 MIDCANAL MIDAGPDAW AF CU 99 LLOYD STORAGE-SOFTTRG AF AT 46 MIDCANAL MIDMI AF CV 100 ELEANOR RELEASE-MINSTRMQ CFS AU 47 MIDCANAL MIDFACT PERCENT CW 101 ELEANOR RELEASE-7DAYENCRADVISE CFS AV 48 MIDCANAL MIDNOMGWPRVT AF CX 102 ELEANOR RELEASE-SNOWADVISE CFS AW 49 MIDCANAL MIDOPSPLS AF CY 103 ELEANOR TUNTRNSFCAP CFS AX 50 MIDCANAL MIDLOSS AF CZ 104 ELEANOR FLOW-TUNNEL CFS AY 51 MIDCANAL MIDINTCP AF DA 105 ELEANOR RELEASE-STREAM CFS AZ 52 MIDCANAL MIDNOMGWDIST AF DB 106 ELEANOR RELEASE-TOTELEANOR CFS BA 53 MIDCANAL MIDUPSYSLOSSDIV AF DC 107 ELEANOR STORAGE AF BB 54 MIDCANAL MIDLKDIV AF DD 108 ELEANOR EVAP AF BC 55 MIDCANAL MIDLKSTORCHNG AF DE 109 ELEANOR STORAGE-SOFTTRG AF 57
 of data for a parameter can be plotted. The parameter(s) to be plotted are identified by reference worksheet name and column.")
58 5.5 DSSAnyGroup Worksheet This worksheet (DSSAnyGroup) provides plotting of up to ten parameters provided in worksheet Output or another equally formatted worksheet of results. One calendar year (the same year or different years) of data for a parameter can be plotted. The parameter(s) to be plotted are identified by reference worksheet name and column. A snapshot of the identification parameters and result values is shown below. Values are plotted to either the primary y-axis or secondary y-axis. The axis reference indicates to which axis the value will be plotted by default. The designation of y-axis assignment is not modified by this field, and the user must edit the series data within the plot to change the y-axis assignment, graph type or line or shape characteristics. The enter graph year is a user entry. The same year or different year of a parameter or multiple parameters can be plotted. Sheet name is a user entry, and identifies from which Output-formatted worksheet the parameter is to be acquired. The enter column entry identifies from which column the parameter occurs. Refer to Table of the description for worksheet Output for the identification of the column associated with each parameter. Upon proper entry of a parameter a return of the parameter s label and source worksheet will occur in the data reference field. Values for the specified calendar year will also be returned in the data field. If a plotting position is not used, a #VALUE! or #REF! will be returned. The scaler field is provided to allow the conversion or scaling of the data returned from the result worksheet. For instance, if the daily data occurs in the result worksheet in units of daily average flow (cfs) it could be plotted in units of daily volume (acre-feet) by entering the conversion factor of The entry in the field acts as a multiplier to the value occurring in the result worksheet. This field can also be used to scale two different order of magnitude parameters to use the same y-axis. The results of up to ten parameters will be plotted. An example of the several plotted parameters from two different studies is shown below. 58
59 2,500,000 Don Pedro Operations CY ,000 9,000 2,000,000 8,000 Storage - AF 1,500,000 7,000 6,000 5,000 Flow - CFS 1,000,000 4,000 3, ,000 2,000 1, /1/1984 2/1/1984 3/1/1984 4/1/1984 5/1/1984 6/1/1984 7/1/1984 8/1/1984 9/1/ /1/ /1/ /1/1984 DONPEDRO STORAGE - AF (OUTPUT2) #REF! #REF! DONPEDRO STORAGE - AF (OUTPUT) LAGRANGE RELEASE-TOTAL - CFS (OUTPUT2) #REF! LAGRANGE RELEASE-MINQ - CFS (OUTPUT) LAGRANGE RELEASE-MINQ - CFS (OUTPUT2) LAGRANGE RELEASE-TOTAL - CFS (OUTPUT) #REF! Unused plotting positions will appear with values plotted at zero and will have legends of #VALUE! or #REF!. To create graphs without unused positions a copy of the plot can be made and positioned elsewhere in the worksheet. The unwanted positions can then be deleted from the plot. 59

60 5.6 DSSMonthTable Worksheet This worksheet (DSSMonthTable) provides summation or averaging, and plotting of up to four parameters provided in worksheet Output or another equally formatted worksheet of results. The function of this worksheet is to provide a synthesis of the daily result data into monthly results thus reducing the handling and display of over 14,000 values for each parameter (39 years of days) to 468 values (39 years of months). The parameter(s) to be plotted or tabled are identified by reference worksheet name and column, very similarly to the method identified for worksheet DSSAnyGroup. A snapshot of the identification parameters and result values is shown below. Each parameter is tabled and plotted separately for the entire 39-year simulation period. Sheet name is a user entry, and identifies from which Output-formatted worksheet the parameter is to be acquired. The enter column letter entry identifies from which column the parameter occurs. Refer to Table of the description for worksheet Output for the identification of the column associated with each parameter. Upon proper entry of a parameter a return of the parameter s label, source worksheet and the native unit of the parameter will occur. Depending on need, the conversion entry is provided. This entry, a keyed value of 0 to 5, directs the worksheet on the handling of the daily data. An entry of 1 will direct the worksheet to sum the daily data into monthly increments in the parameter s native units (e.g., daily acre-feet into monthly volumes). An entry of 1 will convert the daily data from a native unit of flow (cfs) into monthly volumes of acre-feet. An entry of 2 will convert the daily data from a native unit of volume (acre-feet) into a monthly sum of daily flow in units of cfs. An entry of 3 will act as an entry of 1 except convert the result into monthly volumes with units of 1,000 acre-feet. An entry of 4 will table and plot the daily value associated with the last day of each month in its native unit, and is primarily intended to analyze reservoir storage. An entry of 5 will report the average of daily values within a month. Depending on the entry in the conversion field, the converted unit will be returned to converted unit field. Values for the each month of the simulation period will also be returned in the data field. If a plotting position is not used, a #VALUE! or #REF! will be returned. A scaler field is also provided for each parameter (in the row above the data fields) to allow the conversion or scaling of the data returned from the result worksheet. The results of up to four parameters will be tabled and plotted. Examples of the formats of reports are shown below. 60
61 Standardized Tables An example of a standardized table for the illustration of results is shown below (Table 1 Form). In this example the current minimum daily flow requirement at La Grange Bridge has been synthesized into monthly volumes for the simulation period, and water year totals and for the annual period February through January. Conversion (0-5): 1 Sheet Name: Output1 Column Letter: Z Column No: 26 Label: ELEASE-MIN Native Unit: CFS Convert Unit: AF Table 1 LAGRANGE RELEASE-MINQ (Output1) AF WY Oct Nov Dec Jan Feb Mar Apr May Jun Jul Aug Sep Total Feb-Jan ,397 17,851 18,447 18,447 16,661 18,447 66,685 63,515 4,463 4,612 4,612 4, , , ,240 10,413 10,760 10,760 9,719 10,760 30,288 29,251 2,975 3,074 3,074 2, , , ,223 8,926 9,223 9,223 8,331 9,223 64,241 61,936 14,876 15,372 15,372 14, , , ,397 17,851 18,447 18,447 16,661 18,447 64,241 61,936 14,876 15,372 15,372 14, , , ,397 17,851 18,447 18,447 16,661 18,447 64,241 61,936 14,876 15,372 15,372 14, , , ,397 17,851 18,447 18,447 16,661 18,447 20,153 19,749 2,975 3,074 3,074 2, , , ,736 8,926 9,223 9,223 8,331 9,223 14,649 14,589 2,975 3,074 3,074 2,975 94,000 94, ,736 8,926 9,223 9,223 8,331 9,223 64,241 61,936 14,876 15,372 15,372 14, , , ,397 17,851 18,447 18,447 16,661 18,447 64,241 61,936 14,876 15,372 15,372 14, , , ,397 17,851 18,447 18,447 16,661 18,447 64,241 61,936 14,876 15,372 15,372 14, , , ,397 17,851 18,447 18,447 16,661 18,447 29,339 28,532 4,463 4,612 4,612 4, , , ,744 10,711 11,068 11,068 9,997 11,068 64,241 61,936 14,876 15,372 15,372 14, , , ,397 17,851 18,447 18,447 16,661 18,447 64,241 61,936 14,876 15,372 15,372 14, , , ,397 17,851 18,447 18,447 16,661 18,447 64,241 61,936 14,876 15,372 15,372 14, , , ,397 17,851 18,447 18,447 16,661 18,447 34,656 33,346 4,463 4,612 4,612 4, , , ,223 8,926 9,223 9,223 8,331 9,223 64,241 61,936 14,876 15,372 15,372 14, , , ,397 17,851 18,447 18,447 16,661 18,447 24,481 23,806 2,975 3,074 3,074 2, , , ,736 8,926 9,223 9,223 8,331 9,223 14,649 14,589 2,975 3,074 3,074 2,975 94,000 94, ,736 8,926 9,223 9,223 8,331 9,223 25,991 25,222 2,975 3,074 3,074 2, , , ,736 8,926 9,223 9,223 8,331 9,223 19,362 19,008 2,975 3,074 3,074 2, , , ,736 8,926 9,223 9,223 8,331 9,223 25,870 25,109 2,975 3,074 3,074 2, , , ,736 8,926 9,223 9,223 8,331 9,223 19,995 19,601 2,975 3,074 3,074 2, , , ,736 8,926 9,223 9,223 8,331 9,223 64,241 61,936 14,876 15,372 15,372 14, , , ,397 17,851 18,447 18,447 16,661 18,447 25,903 25,140 2,975 3,074 3,074 2, , , ,223 8,926 9,223 9,223 8,331 9,223 64,241 61,936 14,876 15,372 15,372 14, , , ,397 17,851 18,447 18,447 16,661 18,447 64,241 61,936 14,876 15,372 15,372 14, , , ,397 17,851 18,447 18,447 16,661 18,447 64,241 61,936 14,876 15,372 15,372 14, , , ,397 17,851 18,447 18,447 16,661 18,447 64,241 61,936 14,876 15,372 15,372 14, , , ,397 17,851 18,447 18,447 16,661 18,447 64,241 61,936 14,876 15,372 15,372 14, , , ,397 17,851 18,447 18,447 16,661 18,447 64,241 61,936 14,876 15,372 15,372 14, , , ,397 17,851 18,447 18,447 16,661 18,447 28,572 27,642 4,463 4,612 4,612 4, , , ,223 8,926 9,223 9,223 8,331 9,223 32,729 31,539 4,463 4,612 4,612 4, , , ,223 8,926 9,223 9,223 8,331 9,223 55,641 53,161 4,463 4,612 4,612 4, , , ,240 10,413 10,760 10,760 9,719 10,760 28,696 27,758 4,463 4,612 4,612 4, , , ,223 8,926 9,223 9,223 8,331 9,223 64,241 61,936 14,876 15,372 15,372 14, , , ,397 17,851 18,447 18,447 16,661 18,447 64,241 61,936 14,876 15,372 15,372 14, , , ,397 17,851 18,447 18,447 16,661 18,447 26,085 25,310 2,975 3,074 3,074 2, , , ,736 8,926 9,223 9,223 8,331 9,223 27,470 26,609 2,975 3,074 3,074 2, , , ,223 8,926 9,223 9,223 8,331 9,223 42,919 41,235 4,463 4,612 4,612 4, ,452 Average 16,957 13,625 14,079 14,079 12,717 14,079 46,531 44,910 9,078 9,381 9,381 9, , ,289 Min 7,736 8,926 9,223 9,223 8,331 9,223 14,649 14,589 2,975 3,074 3,074 2,975 94,000 94,000 Max 24,397 17,851 18,447 18,447 16,661 18,447 66,685 63,515 14,876 15,372 15,372 14, , ,923 61
62 The values could also be tabled in the parameter s native unit of flow (cfs) representing the average daily flow requirement during each month. Annual totals are not included as the value is non-sensible. Conversion (0-5): 5 Sheet Name: Output1 Column Letter: Z Column No: 26 Label: ELEASE-MIN Native Unit: CFS Convert Unit: Native Table 1 LAGRANGE RELEASE-MINQ (Output1) CFS Average Daily Value WY Oct Nov Dec Jan Feb Mar Apr May Jun Jul Aug Sep ,121 1, ,080 1, ,080 1, ,080 1, ,080 1, ,080 1, ,080 1, ,080 1, ,080 1, ,080 1, ,080 1, ,080 1, ,080 1, ,080 1, ,080 1, ,080 1, ,080 1, ,080 1, ,080 1, ,080 1, Average Min Max ,121 1, For each parameter the sequential, the chronological annual values and associated monthly values are also grouped by water type, in descending order of annual runoff. The rank ordering of the years within the simulation period is established by the naming of 6 year types, wet, above normal, normal, below normal, dry and critical. Using the water year runoff for the years 1921 through 2011 (91 years), the years were rank ordered from wettest to driest. The wettest 20 percent of the years (18 years) are designated the wet year type. The next wettest 18 years are designated the above normal year type. 62
63 And so on for the normal and below normal year types. The driest 20 percent of years are split between the dry and critical year types. After the demarcation occurs for each year the data set is reduced to only the 1971 through 2009 modeling period (39 years). A switch at cell X216 directs the monthly sequence of the year. For instance, if the year is to begin February 1 of the year and continue through January of the following year, the switch would be set to Feb. The switch can be set to any month February (Feb) through June (Jun). The first form of standardized table (Table 1a Form) for this information follows, which identifies the year type associated with each chronologically-based listed year. Averages for each year type follow the listing. Table 1a Prelim LAGRANGE RELEASE-MINQ (Output1) Relicense AF Yr-Type Yr Begin Feb Mar Apr May Jun Jul Aug Sep Oct Nov Dec Jan Total ,661 18,447 66,685 63,515 4,463 4,612 4,612 4,463 13,240 10,413 10,760 10, , ,719 10,760 30,288 29,251 2,975 3,074 3,074 2,975 9,223 8,926 9,223 9, , ,331 9,223 64,241 61,936 14,876 15,372 15,372 14,876 24,397 17,851 18,447 18, , ,661 18,447 64,241 61,936 14,876 15,372 15,372 14,876 24,397 17,851 18,447 18, , ,661 18,447 64,241 61,936 14,876 15,372 15,372 14,876 24,397 17,851 18,447 18, , ,661 18,447 20,153 19,749 2,975 3,074 3,074 2,975 7,736 8,926 9,223 9, , ,331 9,223 14,649 14,589 2,975 3,074 3,074 2,975 7,736 8,926 9,223 9,223 94, ,331 9,223 64,241 61,936 14,876 15,372 15,372 14,876 24,397 17,851 18,447 18, , ,661 18,447 64,241 61,936 14,876 15,372 15,372 14,876 24,397 17,851 18,447 18, , ,661 18,447 64,241 61,936 14,876 15,372 15,372 14,876 24,397 17,851 18,447 18, , ,661 18,447 29,339 28,532 4,463 4,612 4,612 4,463 12,744 10,711 11,068 11, , ,997 11,068 64,241 61,936 14,876 15,372 15,372 14,876 24,397 17,851 18,447 18, , ,661 18,447 64,241 61,936 14,876 15,372 15,372 14,876 24,397 17,851 18,447 18, , ,661 18,447 64,241 61,936 14,876 15,372 15,372 14,876 24,397 17,851 18,447 18, , ,661 18,447 34,656 33,346 4,463 4,612 4,612 4,463 9,223 8,926 9,223 9, , ,331 9,223 64,241 61,936 14,876 15,372 15,372 14,876 24,397 17,851 18,447 18, , ,661 18,447 24,481 23,806 2,975 3,074 3,074 2,975 7,736 8,926 9,223 9, , ,331 9,223 14,649 14,589 2,975 3,074 3,074 2,975 7,736 8,926 9,223 9,223 94, ,331 9,223 25,991 25,222 2,975 3,074 3,074 2,975 7,736 8,926 9,223 9, , ,331 9,223 19,362 19,008 2,975 3,074 3,074 2,975 7,736 8,926 9,223 9, , ,331 9,223 25,870 25,109 2,975 3,074 3,074 2,975 7,736 8,926 9,223 9, , ,331 9,223 19,995 19,601 2,975 3,074 3,074 2,975 7,736 8,926 9,223 9, , ,331 9,223 64,241 61,936 14,876 15,372 15,372 14,876 24,397 17,851 18,447 18, , ,661 18,447 25,903 25,140 2,975 3,074 3,074 2,975 9,223 8,926 9,223 9, , ,331 9,223 64,241 61,936 14,876 15,372 15,372 14,876 24,397 17,851 18,447 18, , ,661 18,447 64,241 61,936 14,876 15,372 15,372 14,876 24,397 17,851 18,447 18, , ,661 18,447 64,241 61,936 14,876 15,372 15,372 14,876 24,397 17,851 18,447 18, , ,661 18,447 64,241 61,936 14,876 15,372 15,372 14,876 24,397 17,851 18,447 18, , ,661 18,447 64,241 61,936 14,876 15,372 15,372 14,876 24,397 17,851 18,447 18, , ,661 18,447 64,241 61,936 14,876 15,372 15,372 14,876 24,397 17,851 18,447 18, , ,661 18,447 28,572 27,642 4,463 4,612 4,612 4,463 9,223 8,926 9,223 9, , ,331 9,223 32,729 31,539 4,463 4,612 4,612 4,463 9,223 8,926 9,223 9, , ,331 9,223 55,641 53,161 4,463 4,612 4,612 4,463 13,240 10,413 10,760 10, , ,719 10,760 28,696 27,758 4,463 4,612 4,612 4,463 9,223 8,926 9,223 9, , ,331 9,223 64,241 61,936 14,876 15,372 15,372 14,876 24,397 17,851 18,447 18, , ,661 18,447 64,241 61,936 14,876 15,372 15,372 14,876 24,397 17,851 18,447 18, , ,661 18,447 26,085 25,310 2,975 3,074 3,074 2,975 7,736 8,926 9,223 9, , ,331 9,223 27,470 26,609 2,975 3,074 3,074 2,975 9,223 8,926 9,223 9, , ,331 9,223 42,919 41,235 4,463 4,612 4,612 4,463 LAGRANGE RELEASE-MINQ (Output1) - AF Water Year Type Feb Mar Apr May Jun Jul Aug Sep Oct Nov Dec Jan Total W 1 12,663 14,019 64,241 61,936 14,876 15,372 15,372 14,876 24,397 17,851 18,447 18, ,497 AN 2 15,273 16,909 64,241 61,936 14,876 15,372 15,372 14,876 24,397 17,851 18,447 18, ,997 N 3 11,901 13,176 55,814 53,608 8,926 9,223 9,223 8,926 18,149 13,884 14,347 14, ,016 BN 4 11,108 12,298 28,792 27,848 3,613 3,733 3,733 3,613 8,798 8,926 9,223 9, ,908 D 5 14,579 16,141 25,172 24,497 3,347 3,459 3,459 3,347 9,360 9,372 9,684 9, ,101 C 6 11,663 12,913 18,786 18,467 2,975 3,074 3,074 2,975 7,736 8,926 9,223 9, ,035 All 12,717 14,079 46,531 44,910 9,078 9,381 9,381 9,078 16,762 13,514 13,964 13, ,289 63
64 The second form of report (Table 1b Form) for the water year type based ranking is shown below. This form rank orders the years according to descending volume of watershed runoff, named by the convention described above. The same averaging results occur for this format of report. Table 1b Prelim LAGRANGE RELEASE-MINQ (Output1) Relicense AF Yr-Type Yr Begin Feb Mar Apr May Jun Jul Aug Sep Oct Nov Dec Jan Total W ,661 18,447 64,241 61,936 14,876 15,372 15,372 14,876 24,397 17,851 18,447 18, ,923 W ,331 9,223 64,241 61,936 14,876 15,372 15,372 14,876 24,397 17,851 18,447 18, ,369 W ,997 11,068 64,241 61,936 14,876 15,372 15,372 14,876 24,397 17,851 18,447 18, ,880 W ,661 18,447 64,241 61,936 14,876 15,372 15,372 14,876 24,397 17,851 18,447 18, ,923 W ,661 18,447 64,241 61,936 14,876 15,372 15,372 14,876 24,397 17,851 18,447 18, ,923 W ,661 18,447 64,241 61,936 14,876 15,372 15,372 14,876 24,397 17,851 18,447 18, ,923 W ,661 18,447 64,241 61,936 14,876 15,372 15,372 14,876 24,397 17,851 18,447 18, ,923 W ,331 9,223 64,241 61,936 14,876 15,372 15,372 14,876 24,397 17,851 18,447 18, ,369 W ,331 9,223 64,241 61,936 14,876 15,372 15,372 14,876 24,397 17,851 18,447 18, ,369 W ,331 9,223 64,241 61,936 14,876 15,372 15,372 14,876 24,397 17,851 18,447 18, ,369 AN ,661 18,447 64,241 61,936 14,876 15,372 15,372 14,876 24,397 17,851 18,447 18, ,923 AN ,331 9,223 64,241 61,936 14,876 15,372 15,372 14,876 24,397 17,851 18,447 18, ,369 AN ,661 18,447 64,241 61,936 14,876 15,372 15,372 14,876 24,397 17,851 18,447 18, ,923 AN ,661 18,447 64,241 61,936 14,876 15,372 15,372 14,876 24,397 17,851 18,447 18, ,923 AN ,661 18,447 64,241 61,936 14,876 15,372 15,372 14,876 24,397 17,851 18,447 18, ,923 AN ,661 18,447 64,241 61,936 14,876 15,372 15,372 14,876 24,397 17,851 18,447 18, ,923 N ,331 9,223 64,241 61,936 14,876 15,372 15,372 14,876 24,397 17,851 18,447 18, ,369 N ,661 18,447 64,241 61,936 14,876 15,372 15,372 14,876 24,397 17,851 18,447 18, ,923 N ,661 18,447 64,241 61,936 14,876 15,372 15,372 14,876 24,397 17,851 18,447 18, ,923 N ,661 18,447 66,685 63,515 4,463 4,612 4,612 4,463 13,240 10,413 10,760 10, ,631 N ,331 9,223 42,919 41,235 4,463 4,612 4,612 4,463 N ,331 9,223 55,641 53,161 4,463 4,612 4,612 4,463 13,240 10,413 10,760 10, ,680 N ,331 9,223 32,729 31,539 4,463 4,612 4,612 4,463 9,223 8,926 9,223 9, ,567 BN ,331 9,223 25,991 25,222 2,975 3,074 3,074 2,975 7,736 8,926 9,223 9, ,975 BN ,719 10,760 28,696 27,758 4,463 4,612 4,612 4,463 9,223 8,926 9,223 9, ,678 BN ,661 18,447 34,656 33,346 4,463 4,612 4,612 4,463 9,223 8,926 9,223 9, ,854 BN ,719 10,760 30,288 29,251 2,975 3,074 3,074 2,975 9,223 8,926 9,223 9, ,713 BN ,331 9,223 27,470 26,609 2,975 3,074 3,074 2,975 9,223 8,926 9,223 9, ,328 BN ,331 9,223 25,870 25,109 2,975 3,074 3,074 2,975 7,736 8,926 9,223 9, ,740 BN ,661 18,447 28,572 27,642 4,463 4,612 4,612 4,463 9,223 8,926 9,223 9, ,067 D ,661 18,447 29,339 28,532 4,463 4,612 4,612 4,463 12,744 10,711 11,068 11, ,718 D ,661 18,447 26,085 25,310 2,975 3,074 3,074 2,975 7,736 8,926 9,223 9, ,710 D ,331 9,223 19,362 19,008 2,975 3,074 3,074 2,975 7,736 8,926 9,223 9, ,131 D ,661 18,447 25,903 25,140 2,975 3,074 3,074 2,975 9,223 8,926 9,223 9, ,846 C ,331 9,223 19,995 19,601 2,975 3,074 3,074 2,975 7,736 8,926 9,223 9, ,357 C ,331 9,223 14,649 14,589 2,975 3,074 3,074 2,975 7,736 8,926 9,223 9,223 94,000 C ,661 18,447 20,153 19,749 2,975 3,074 3,074 2,975 7,736 8,926 9,223 9, ,217 C ,661 18,447 24,481 23,806 2,975 3,074 3,074 2,975 7,736 8,926 9,223 9, ,603 C ,331 9,223 14,649 14,589 2,975 3,074 3,074 2,975 7,736 8,926 9,223 9,223 94,000 LAGRANGE RELEASE-MINQ (Output1) - AF Water Year Type Feb Mar Apr May Jun Jul Aug Sep Oct Nov Dec Jan Total W 1 12,663 14,019 64,241 61,936 14,876 15,372 15,372 14,876 24,397 17,851 18,447 18, ,497 AN 2 15,273 16,909 64,241 61,936 14,876 15,372 15,372 14,876 24,397 17,851 18,447 18, ,997 N 3 11,901 13,176 55,814 53,608 8,926 9,223 9,223 8,926 18,149 13,884 14,347 14, ,016 BN 4 11,108 12,298 28,792 27,848 3,613 3,733 3,733 3,613 8,798 8,926 9,223 9, ,908 D 5 14,579 16,141 25,172 24,497 3,347 3,459 3,459 3,347 9,360 9,372 9,684 9, ,101 C 6 11,663 12,913 18,786 18,467 2,975 3,074 3,074 2,975 7,736 8,926 9,223 9, ,035 All 12,717 14,079 46,531 44,910 9,078 9,381 9,381 9,078 16,762 13,514 13,964 13, ,289 Standardized Graphs Several standardized graphs are also provided for each parameter. The first graph provides a trace of the monthly sequence of data developed for the standardized chronological table. Following is the minimum flow requirement at La Grange Bridge synthesized as monthly volume during the simulation. 64
65 WY ,000 LAGRANGE RELEASE-MINQ 60,000 50,000 40,000 AF 30,000 20,000 10,000 0 Oct 1970 Oct 1971 Oct 1972 Oct 1973 Oct 1974 Oct 1975 Oct 1976 Oct 1977 Oct 1978 LAGRANGE RELEASE-MINQ (Output1) WY ,000 LAGRANGE RELEASE-MINQ 60,000 50,000 40,000 AF 30,000 20,000 10,000 0 Oct 1979 Oct 1980 Oct 1981 Oct 1982 Oct 1983 Oct 1984 Oct 1985 Oct 1986 Oct 1987 Oct 1988 LAGRANGE RELEASE-MINQ (Output1) WY ,000 LAGRANGE RELEASE-MINQ 60,000 50,000 40,000 AF 30,000 20,000 10,000 0 Oct 1989 Oct 1990 Oct 1991 Oct 1992 Oct 1993 Oct 1994 Oct 1995 Oct 1996 Oct 1997 Oct 1998 LAGRANGE RELEASE-MINQ (Output1) WY ,000 LAGRANGE RELEASE-MINQ 60,000 50,000 40,000 AF 30,000 20,000 10,000 0 Oct 1999 Oct 2000 Oct 2001 Oct 2002 Oct 2003 Oct 2004 Oct 2005 Oct 2006 Oct 2007 Oct 2008 LAGRANGE RELEASE-MINQ (Output1) 65
66 A user-defined graph is also available to depict a particular column of data from the water year-based standardized table (Table 1) described above. A column of interest within the Table 1 standardized table is selected (such as column AI representing a water year total volume) in cell AN116 to display the 39 annual values. Tab: Output1 Parmater: LAGRANGE RELEASE-MINQ (Output1) Table 1 Column Label: Total Native: CFS Convert: AF cell AN116 Table 1 Plotted Col: AI Title: Tuolumne River Minimum Annual Flow Requirement Y-Axis: Acre-feet Table 1 - Water Year Arranged Results 350,000 Tuolumne River Minimum Annual Flow Requirement 300, ,000 Acre-feet 200, , ,000 50,000 0 A similar display of columnar results can be keyed to the chronological sequence year table described above. Entry of the desired column of information from the table (e.g., Table 1a) is done at cell AN143. cell AN143 Table 1a Plotted Col: AI Table 1a Column Label: Total Year Beginning: Feb Table 1a - User Specified Year Results 350,000 Tuolumne River Minimum Annual Flow Requirement 300, ,000 Acre-feet 200, , ,000 50,000 0 The third version of standardized graph for the same information displays results from a column of a table that rank-ordered the years of simulation according to descending runoff (e.g., Table 1b). Entry of 66
67 the desired column of information from that table is done at cell AN170, with results exemplified by the following graph. cell AN170 Table 1b Plotted Col: AY Table 1b Column Label: Total Year Beginning: Feb Table 1b - User Specified Year Results in Descending Year Wetness 350,000 Tuolumne River Minimum Annual Flow Requirement 300, ,000 Acre-feet 200, , ,000 50,000 0 The same tables and graphics are provided for each of the three other parameters. Additionally, standardized graphics are provided for a columnar comparison of Table 1 and Table 2 values. An example of those graphics is shown below, with the column(s) of interest defined by the Table 1-specific and Table 2-specific entries. Tab: Output1 & Output2c Parmater: LAGRANGE RELEASE-MINQ (Output1) & LAGRANGE RELEASE-MINQ (Output2c) Table 1 Column Label: Total Native: CFS & CFS Table 2 Column Label: Total Convert: AF & AF Table 1 & Table 2 Plotted Col: AI & AI Title: Tuolumne River Minimum Flow Requiements Y-Axis: Acre-feet Table 1/2 - Water Year Arranged Results 800,000 Tuolumne River Minimum Flow Requiements 700, , ,000 Acre-feet 400, , , ,000 0 LAGRANGE RELEASE-MINQ (Output1) LAGRANGE RELEASE-MINQ (Output2c) A standardized graphic comparison of Table 1, Table 2, Table 3 and Table 4 form monthly data is also provided. The four-way comparison graphs are shown below. 67
68 WY ,000 Tuolumne River Minimum Flow Requirements Acre-feet 180, , , , ,000 80,000 60,000 40,000 20,000 0 Oct 1970 Oct 1971 Oct 1972 Oct 1973 Oct 1974 Oct 1975 Oct 1976 Oct 1977 Oct 1978 LAGRANGE RELEASE-MINQ (Output2c) LAGRANGE RELEASE-MINQ (Output1) LAGRANGE RELEASE-MINQ (Output3c) LAGRANGE RELEASE-MINQ (Output2b) WY ,000 Tuolumne River Minimum Flow Requirements 200,000 Acre-feet 150, ,000 50,000 0 Oct 1979 Oct 1980 Oct 1981 Oct 1982 Oct 1983 Oct 1984 Oct 1985 Oct 1986 Oct 1987 Oct 1988 LAGRANGE RELEASE-MINQ (Output2c) LAGRANGE RELEASE-MINQ (Output1) LAGRANGE RELEASE-MINQ (Output3c) LAGRANGE RELEASE-MINQ (Output2b) WY ,000 Tuolumne River Minimum Flow Requirements 200,000 Acre-feet 150, ,000 50,000 0 Oct 1989 Oct 1990 Oct 1991 Oct 1992 Oct 1993 Oct 1994 Oct 1995 Oct 1996 Oct 1997 Oct 1998 LAGRANGE RELEASE-MINQ (Output2c) LAGRANGE RELEASE-MINQ (Output1) LAGRANGE RELEASE-MINQ (Output3c) LAGRANGE RELEASE-MINQ (Output2b) WY ,000 Tuolumne River Minimum Flow Requirements 200,000 Acre-feet 150, ,000 50,000 0 Oct 1999 Oct 2000 Oct 2001 Oct 2002 Oct 2003 Oct 2004 Oct 2005 Oct 2006 Oct 2007 Oct 2008 LAGRANGE RELEASE-MINQ (Output2c) LAGRANGE RELEASE-MINQ (Output1) LAGRANGE RELEASE-MINQ (Output3c) LAGRANGE RELEASE-MINQ (Output2b) 68

69 5.7 XXGroup Worksheets These worksheets provide graphical display of a single calendar year of operation for several model components. The model components represent groupings of physical features of the Tuolumne River system that make up logical components of operation. The model components are: Don Pedro Reservoir, the Distircts facilities, and the Lower Tuolumne River Modeled with computational worksheet DonPedro and displayed by worksheet DPGroup Hetch Hetchy Reservoir, the San Joaquin Pipeline and downstream releases Modeled with computational worksheet SFHetchHetchy and displayed by worksheet HHGroup Lake Lloyd, Holm Powerhouse and its downstream releases Modeled with computational worksheet SFLloyd and displayed by worksheet LloydGroup Lake Eleanor, the Eleanor-Cherry Tunnel and its downstream releases Modeled with computational worksheet SFEleanor and displayed by worksheet ELGroup CCSF Water Bank and Supplemental Releases Modeled with computational worksheet SFWaterBank and displayed by worksheet WBGroup CCSF System Storage displayed by worksheet SFSysGroup. Both the Districts and CCSF s operations are additionally displayed for the 1986 through 1994 period by worksheets DPGroup86_94 and SFGroup86_94. These component-specific display worksheets provide plotting of numerous parameters provided in the computation worksheets. One calendar year (the same year) of data for all parameters can be plotted. These display worksheets are similar to worksheet DSSAnyGroup except they rely upon the data being computed by the current study within the computational worksheets. A comparison between the same parameter from two different studies is not possible. Those comparisons are intended to be made through the worksheet Output and its tools. The parameter(s) to be plotted are identified by reference worksheet name and column. A snapshot of the identification parameters and result values is shown below for worksheet DPGroup. 69
70 Values are plotted to either the primary y-axis or secondary y-axis. The axis reference indicates to which axis the value will be plotted by default. The designation of y-axis assignment is not modified by this field, and the user must edit the series data within the plot to change the y-axis assignment, graph type or line or shape characteristics. The enter graph year is a user entry. The same year or different year of a parameter or multiple parameters can be plotted. Sheet name is a user entry, and identifies from which Output-formatted worksheet the parameter is to be acquired. The enter column entry identifies from which column the parameter occurs. Upon proper entry of a parameter a return of the parameter s label and source worksheet will occur in the data reference field. Values for the specified calendar year will also be returned in the data field. If a plotting position is not used, a #VALUE or #REF will be returned. The scaler field is provided to allow the conversion or scaling of the data returned from the result worksheet. For instance, if the daily data occurs in the result worksheet in units of daily average flow (cfs) it could be plotted in units of daily volume (acre-feet) by entering the conversion factor of The entry in the field acts as a multiplier to the value occurring in the result worksheet. This field can also be used to scale two different order of magnitude parameters to use the same y-axis. An example of the several plotted parameters from an active scenario study is shown below. Don Pedro Reservoir Operation - Calendar Year ,500,000 25,000 2,000,000 20,000 Storage - AF 1,500,000 1,000,000 15,000 10,000 Flow/Release - CFS 500,000 5, /1/1983 2/1/1983 3/1/1983 4/1/1983 5/1/1983 6/1/1983 7/1/1983 8/1/1983 9/1/ /1/ /1/ /1/1983 Don Pedro Storage - AF COE Rainflood Space - AF #N/A #N/A Final Target Storage - AF - Minimum La Grange Req Release - CFS La Grange Release - CFS #N/A Unused plotting positions will appear with values plotted at zero and will have legends of #VALUE!, #REF! or #N/A. To create graphs without unused positions a copy of the plot can be made and positioned elsewhere in the worksheet. The unwanted positions can then be deleted from the plot. 70
. A snapshot of the data entry interface and a sample of graphical display are shown below.")
71 5.8 ModelYearofDaily Worksheet This worksheet (ModelYearofDaily) provides graphical and table display of the daily result for a single calendar or water year for any parameter within a Model component worksheet (e.g., worksheet DonPedro). A snapshot of the data entry interface and a sample of graphical display are shown below. The calendar year, Model worksheet, and column of interest are entered by the user. The result data are plotted by calendar year and water year. The result data are also tabled by calendar year (shown below) and water year. Minimum La Grange Req Release - CFS CY 1991 Jan Feb Mar Apr May Jun Jul Aug Sep Oct Nov Dec Ave AF 9,223 8,331 9,223 25,871 25,109 2,975 3,074 3,074 2,975 7,736 8,926 9,223 Annual 115,742 AF 160 Ave CFS 71
 of data for a parameter can be plotted. The parameter(s) to be plotted are identified by reference worksheet name and column.")
72 5.9 ModelAnyGroup Worksheet This worksheet (ModelAnyGroup) provides plotting of up to ten parameters provided in any Model component worksheet (e.g., worksheet DonPedro). One calendar year (the same year or different years) of data for a parameter can be plotted. The parameter(s) to be plotted are identified by reference worksheet name and column. A snapshot of the identification parameters and result values is shown below. This worksheet performs the same function as the DSSAnyGroup worksheet except the source of its data are the Model component worksheets instead of DSS interface worksheets. Values are plotted to either the primary y-axis or secondary y-axis. The axis reference indicates to which axis the value will be plotted by default. The designation of y-axis assignment is not modified by this field, and the user must edit the series data within the plot to change the y-axis assignment, graph type or line or shape characteristics. The enter CY graph year is a user entry. The same year or different year of a parameter or multiple parameters can be plotted. Sheet name is a user entry, and identifies from which Model component worksheet the parameter is to be acquired. The enter column entry identifies from which column the parameter occurs. Upon proper entry of a parameter a return of the parameter s label and source worksheet will occur in the data reference field. Values for the specified calendar year will also be returned in the data field. If a plotting position is not used, a #VALUE! or #REF! will be returned. The scaler field is provided to allow the conversion or scaling of the data returned from the result worksheet. For instance, if the daily data occurs in the result worksheet in units of daily average flow (cfs) it could be plotted in units of daily volume (acre-feet) by entering the conversion factor of The entry in the field acts as a multiplier to the value occurring in the result worksheet. This field can also be used to scale two different order of magnitude parameters to use the same y-axis. The results of up to ten parameters will be plotted. An example of the several plotted parameters from an active scenario is shown below. 72
73 2,500,000 Don Pedro Operations CY ,000 9,000 2,000,000 8,000 Storage - AF 1,500,000 7,000 6,000 5,000 Flow - CFS 1,000,000 4,000 3, ,000 2,000 1, /1/2004 2/1/2004 3/1/2004 4/1/2004 5/1/2004 6/1/2004 7/1/2004 8/1/2004 9/1/ /1/ /1/ /1/2004 Don Pedro Storage - AF (DonPedro) #N/A #N/A #N/A Reservoir Inflow - AF (DonPedro) Minimum La Grange Req Release - CFS (DonPedro) #N/A La Grange Release - CFS (DonPedro) #N/A #N/A Unused plotting positions will appear with values plotted at zero and will have legends of #VALUE! or #REF!. To create graphs without unused positions a copy of the plot can be made and positioned elsewhere in the worksheet. The unwanted positions can then be deleted from the plot. 73

74 5.10 ModelMonthTable Worksheet This worksheet (ModelMonthTable) provides summation or averaging, and plotting of up to four parameters provided in Model component worksheets (e.g., DonPedro worksheet). The function of this worksheet is to provide a synthesis of the daily result data into monthly results thus reducing the handling and display of over 14,000 values for each parameter (39 years of days) to 468 values (39 years of months). This worksheet and its functionality are identical to the DSSMonthTable worksheet except the source of its data are the Model component worksheets instead of DSS interface worksheets. The parameter(s) to be plotted or tabled are identified by reference worksheet name and column, very similarly to the method identified for the ModelAnyGroup worksheet. A snapshot of the identification parameters and result values is shown below. Each parameter is tabled and plotted separately for the entire 39-year simulation period. Sheet name is a user entry, and identifies from which Model component worksheet the parameter is to be acquired. The enter column letter entry identifies from which column the parameter occurs. Upon proper entry of a parameter a return of the parameter s label, source worksheet and the native unit of the parameter will occur. Depending on need, the conversion entry is provided. This entry, a keyed value of 0 to 5, directs the worksheet on the handling of the daily data. An entry of 1 will direct the worksheet to sum the daily data into monthly increments in the parameter s native units (e.g., daily acre-feet into monthly volumes). An entry of 1 will convert the daily data from a native unit of flow (cfs) into monthly volumes of acre-feet. An entry of 2 will convert the daily data from a native unit of volume (acre-feet) into a monthly sum of daily flow in units of cfs. An entry of 3 will act as an entry of 1 except convert the result into monthly volumes with units of 1,000 acre-feet. An entry of 4 will table and plot the daily value associated with the last day of each month in its native unit, and is primarily intended to analyze reservoir storage. An entry of 5 will report the average of daily values within a month. Depending on the entry in the conversion field, the converted unit will be returned to converted unit field. Values for the each month of the simulation period will also be returned in the data field. If a plotting position is not used, a #VALUE! or #REF! will be returned. 74
75 A scaler field is also provided for each parameter (in the row above the data fields) to allow the conversion or scaling of the data returned from the result worksheet. The results of up to four parameters will be tabled and plotted. The content formats of reports are identified below. Refer to section 5.5 DSSMonthTable for illustrations of each format. Standardized Tables Data synthesized into monthly volumes for the simulation period. Chronological annual values and associated monthly values are also grouped by water type, in descending order of annual runoff. Standardized Graphs Graphs providing a trace of the monthly sequence of data developed for the standardized chronological table. Graphs depicting a particular column of data from the water year-based standardized table. Graphs for the same information displayed rank-ordered according to descending runoff. Standardized graphics are provided for a columnar comparison of the four parameters. 75

76 5.11 DonPedro Worksheet This Model component worksheet (DonPedro) simulates the operation of Don Pedro Reservoir. Several sections of logic provide a systematic operation of the reservoir based on inflow and forecasted hydrology and water demands. As described earlier, the Model will direct releases from the Don Pedro Project under a hold-unless-need-to-release protocol, except as conditioned by minimum release requirements, diversions, preferred/maximum storage, and snowmelt management releases. The several sections of logic are illustrate and discussed below. Don Pedro Release Demands This section of logic assembles the underlying water demands placed for Don Pedro Reservoir releases. Reservoir inflow is derived from other Model component worksheets and is the sum of unregulated inflow to Don Pedro Reservoir (Hydrology worksheet) and regulated releases from the CCSF System (SFHetchHetchy worksheet, SFLLoyd worksheet and SFEleanor worksheet). The minimum flow requirement for the Tuolumne River is provided by worksheet LaGrangeSchedule as directed by worksheet UserInput. The Existing Level Full Diversion Demand is a projection of canal diversion requirements if no water supply shortages occurred and full demands are provided. Scenario Canal Diversion Demand is the canal diversions of MID and TID for the active scenario. These diversions are determined by either pre-processed computations of diversions (e.g, fixed Test Case diversions), user specified diversions, or dynamic computations. Total DP Demands are the summation of minimum release requirements for the river and canal diversions. Other information is developed in this section concerning the difference between scenario diversions and full diversion demand, and an overall summary of water disposition for the entire simulation period. Reservoir Evaporation / Initial Storage Computation and Encroachment Release This section performs an initial check of reservoir storage assuming the previously described minimum releases for the river and canals. A daily mass balance is performed: change in reservoir storage = inflow, minus outflow (releases), minus reservoir losses. The prior day s reservoir evaporation is included in the calculation. If the computation produces resulting Don Pedro Reservoir storage in excess (encroachment) of the preferred storage target, the encroachment is computed. Every 7 th day the model checks for an encroachment, and if it exists a check release is computed. It is assumed that a constant supplemental release (in excess of minimum releases) will be initiated at a rate equal to the encroachment divided equally over the next 10 days. This protocol repeats itself every 7 th day, 76


77 reestablishing the level of check release each time. The end result of this procedure will allow encroachment of storage space above the preferred storage target and not require unrealistic hard releases of water to exactly conform to the target. Snow-melt Management A second check release is made during the April through June period for management of anticipated snowmelt runoff. On the first day of each of these months a forecast is made of anticipated runoff into the reservoir and minimum releases and losses from the reservoir from the date of forecast through the end of June (the assumed target date of reservoir filling). These forecasts determine the volume of water (if any) that will require release in excess of minimum releases and losses and storage gain by the end of June. For April and May, the DWR 90 percent exceedence forecast is used for anticipated runoff, along with known minimum releases and losses, and upstream impairment. The user defines the percentage of volume (of the total volume) to be additionally released during each month. For April, 30 percent of the 3-month volume is advised for release, and during May 50 percent of the 2-month volume is advised for released. For June, the historically reported UF flow is assumed for the runoff computation. This assumes pre-knowledge of the runoff volume for the month, and 100 percent of the excess is spread across the month. The snowmelt check release is evenly distributed across the days of the month. The release made in a day is the greater of the two check releases or the minimum release. At no time is the maximum capacity of the reservoir (2,030,000 acre-feet) allowed to be exceeded, and if necessary a release, regardless of magnitude, will be made by the model to not exceed maximum storage capacity. 77
.")

78 Modesto Flood Control Objective, Don Pedro Reservoir, and Tuolumne River Release A Modesto flood control objective is incorporated into the release logic. The objective is to maintain a flow at Modesto no greater than a user-specified flow rate (assumed as 9,000 cfs). The logic checks against an allowable river release that would not exceed the flood control objective after considering the lower Tuolumne River accretions and Dry Creek flow. Logic is applied to the previous check releases in comparison to the allowable release. The La Grange release is then reduced if necessary to not exceed the Modesto flow target objective, even if it results in an encroachment in Don Pedro Reservoir. The exception is when the reservoir reaches full (2,030,000 AF). Any computed encroachment above a full reservoir is passed and the Modesto flow objective will be exceeded. The several advised releases, storage conditions and water demands all culminate in determining the Final La Grange River release. The Don Pedro Reservoir section of logic reports the final reservoir storage of a day and the computation of Don Pedro Reservoir losses. Reservoir losses are computed in accordance with procedures of the Fourth Agreement. Don Pedro Project Generation, and River Flows Based on the hydrologic operation of Don Pedro Reservoir in the Model, power characteristics of the scenario are computed. Equations of Don Pedro powerhouse generation characteristics define capacity (MW) and efficiency (kwh/af), based on reservoir storage. Capacity potential uses minimum storage of 78

79 the day, while efficiency uses average storage of the day. The maximum water through plant is assumed to be 5,400 cfs. Water that does not appear as passing through the generators is computed to be spilled-bypassed. The power generation is cutoff at reservoir storage of 308,960 acre-feet, the top of the dead pool. Flow in the river below La Grange diversion dam is computed and reported. The flow is a determined value by the Model. The same hydrologic information used within the Modesto flow objective logic is added to La Grange releases to estimate flow at downstream points in the river. Currently an estimate of total Tuolumne River accretion between La Grange Bridge and the confluence of Dry Creek is added to La Grange releases to provide an estimate of flow above the Dry Creek confluence. The estimated flow of Dry Creek is added to that estimate to provide an estimate of flow below the Dry Creek confluence at Modesto. Additional flow points can be added as information becomes available. Don Pedro Inflow Components This section of logic assembles the Don Pedro Reservoir inflow components from other Model component worksheets. 79

80 5.12 SFHetchHetchy Worksheet This Model component worksheet (SFHetchHetchy) simulates the operation of Hetch Hetchy Reservoir. Several sections of logic provide a systematic operation of the reservoir based on inflow and forecasted hydrology and water demands. As described earlier, the Model will direct releases from Hetch Hetchy Reservoir under a hold-unless-need-to-release protocol, except as conditioned by minimum release requirements, diversions, preferred/maximum storage, and snowmelt management releases. The several sections of logic are illustrate and discussed below. Hetch Hetchy Release Demands / Reservoir Evaporation / Initial Storage Computation and Encroachment Release This section of logic assembles the underlying water demands placed for Hetchy Hetchy Reservoir releases. Reservoir inflow is derived from worksheet Hydrology and is the unimpaired flow entering the reservoir. The initial releases are comprised of the minimum flow requirement below Hetch Hetchy Reservoir (from the worksheet CCSF) and represent requirements prior to consideration of Canyon Tunnel flows, Mountain Tunnel flows that consist of diversions for the SJPL (from the worksheet CCSF), Moccasin Fish Hatchery releases and diversions by Groveland CSD from Mountain Tunnel. This section also performs an initial check of reservoir storage assuming the previously described minimum releases for the river and Mountain Tunnel. A daily mass balance is performed: change in reservoir storage = inflow, minus outflow (releases), minus reservoir losses. The prior day s reservoir evaporation is included in the calculation. If the computation produces resulting Hetch Hetchy Reservoir storage in excess (encroachment) of the preferred storage target, the encroachment is computed. Every 7 th day the model checks for an encroachment, and if it exists a check release is computed. For the preferred reservoir storage target encroachment it is assumed that a constant supplemental release (in excess of minimum releases) will be initiated at a rate equal to the encroachment divided equally over the next 7 days. This protocol repeats itself every 7 th day, reestablishing the level of check release each time. The end result of this procedure will allow encroachment of storage space above the preferred storage target and not require unrealistic hard releases of water to exactly conform to the target. 80
 and snowmelt management releases (described later).")
81 Supplemental Releases and Final Reservoir and Release Computation This section of logic performs the final computation of reservoir storage and releases. Incorporated into the logic is inclusion of user specified supplemental releases (from WaterBankRel or SFWaterBank worksheets) and snowmelt management releases (described later). Reservoir losses are computed in accordance with procedures of the Fourth Agreement. Snow-melt Management A second check release is made during the February through June period for management of anticipated snowmelt runoff. On the first day of each of these months a forecast is made of anticipated runoff into the reservoir and minimum releases and losses from the reservoir, from the date of forecast through the end of June (assumed target of reservoir filling). These forecasts determine the volume of water (if any) that will require release in excess of minimum releases and losses and storage gain by the end of June. 81
82 Pre-knowledge is used for anticipated runoff, minimum releases and losses. The user defines the percentage of volume (of the total volume for the period) to be additionally released during each month. For February through April, 10 percent of the additional release volume is advised for release, and may be additionally capped. This approach tends to hold Hetch Hetchy Reservoir releases for later release during May. The snowmelt check release is evenly distributed across the days of the month and can be capped in terms of rate (cfs) or minimum volume of the reservoir to which it can be drawn during the month. The particular release made in a day is the greater of the two check releases or the minimum release. At no time is the maximum capacity of the reservoir allowed to be exceeded, and if necessary a release, regardless of magnitude, will be made by the model to not exceed maximum storage capacity. 82

83 5.13 SFLloyd Worksheet This Model component worksheet (SFLloyd) simulates the operation of Lake Lloyd. Several sections of logic provide a systematic operation of the reservoir based on inflow and forecasted hydrology and water demands. The Model will direct releases from Lake Lloyd under a hold-unless-need-to-release protocol, except as conditioned by minimum release requirements, diversions, preferred/maximum storage, snowmelt management releases and target releases for Holm Powerhouse. The several sections of logic are illustrate and discussed below. Lake Lloyd Release Demands, Initial Storage Computation and Encroachment Release This section of logic assembles the underlying water demands placed for Lake Lloyd releases. Reservoir inflow is derived from the Hydrology worksheet and is the unimpaired flow entering the reservoir. The initial releases are comprised of the minimum flow requirement below Lake Lloyd (from worksheet CCSF) and target releases for Holm Powerhouse (from worksheet CCSF). This section also performs an initial check of reservoir storage assuming the previously described minimum releases for the river and Holm Powerhouse. A daily mass balance is performed: change in reservoir storage = inflow, minus outflow (releases), minus reservoir losses. The prior day s reservoir evaporation is included in the calculation. If the computation produces resulting Lake Lloyd storage in excess (encroachment) of the preferred storage target, the encroachment is computed. Every 7 th day the model checks for an encroachment, and if it exists a check release is computed. It is assumed that a constant supplemental release (in excess of minimum releases) will be initiated at a rate equal to the encroachment divided equally over the next 7 days. This protocol repeats itself every 7 th day, reestablishing the level of check release each time. The end result of this procedure will allow encroachment of storage space above the preferred storage target and not require unrealistic hard releases of water to exactly conform to the target. User specified supplemental releases are reported in this section but are not incorporated into the worksheet s logic until later. 83
84 Supplemental Releases, Lake Eleanor Transfers and Final Reservoir and Release Computation This section of logic performs the final computation of reservoir storage and releases, including consideration of snowmelt management releases (described later) and transfers from Lake Eleanor. Both the initial check release for preferred storage encroachment and the snowmelt check release are computed and advised for reservoir operations. If supplemental releases above minimum releases are computed the Model routes the additional release through Holm Powerhouse up to its available capacity. The remainder of the supplemental release is routed to the stream below Lake Lloyd. A comparison is made between Lloyd-only use of Holm Powerhouse capacity and maximum capacity for passage to the Lake Eleanor model component. The operation goal linkage between Lake Lloyd and Lake Eleanor assumes that Lake Eleanor will transfer water from its watershed to Lake Lloyd for the purpose of enhancing power generation at Holm Powerhouse. Thus, any available capacity at Holm Powerhouse after the Lloyd-only operation is assumed available and desired for use of a Lake Eleanor transfer. If water is transferred from Lake Eleanor the Model assumes the water to be directly routed to Holm Powerhouse which then becomes additional release from Lake Lloyd. Also incorporated into the logic is inclusion of user specified supplemental releases (from the WaterBankRel or SFWaterBank worksheets). Supplemental releases are added to any other release established for Lake Lloyd. Reservoir losses are compute in accordance with procedures of the Fourth Agreement. 84

 that will require release in excess of minimum releases and losses and storage gain by the end of June.")
85 Snow-melt Management A second check release is made during the February through June period for management of anticipated snowmelt runoff. On the first day of each of these months a forecast is made of anticipated runoff into the reservoir and minimum releases and losses from the reservoir, from the date of forecast through the end of June (assumed target of reservoir filling). These forecasts determine the volume of water (if any) that will require release in excess of minimum releases and losses and storage gain by the end of June. Pre-knowledge is used for anticipated runoff, minimum releases and losses. The user defines the percentage of volume (of the total volume for the period) to be additionally released during each month. For February through May, a varying percentage of the additional release volume is advised for release, and is capped in rate as a means to confine releases within the capacity of Holm Powerhouse. The snowmelt check release is evenly distributed across the days of the month. The release can also be capped in terms of minimum volume of the reservoir to which it can be drawn during the month. 85

86 5.14 SFEleanor Worksheet This Model component worksheet (SFEleanor) simulates the operation of Lake Eleanor. Several sections of logic provide a systematic operation of the reservoir based on inflow and forecasted hydrology and water demands. The Model will direct releases from Lake Eleanor under a hold-unless-need-to-release protocol, except as conditioned by minimum release requirements, diversions, preferred/maximum storage, snowmelt management releases. When advised releases exceed the minimum Model logic attempts to transfer water to Lake Lloyd. The several sections of logic are illustrated and discussed below. Lake Eleanor Release Demands, Initial Storage Computation and Encroachment Release This section of logic assembles the underlying water demands placed for Lake Eleanor releases. Reservoir inflow is derived from the Hydrology worksheet and is the unimpaired flow entering the reservoir. The initial releases are comprised of the minimum flow requirement below Lake Eleanor (from the CCSF worksheet). An initial check of reservoir storage occurs assuming the minimum releases for the river. A daily mass balance is performed: change in reservoir storage = inflow, minus outflow (releases), minus reservoir losses. The prior day s reservoir evaporation is included in the calculation. If the computation produces resulting Lake Eleanor storage in excess (encroachment) of the preferred storage target, the encroachment is computed. Every 7 th day the model checks for an encroachment, and if it exists a check release is computed. For the preferred reservoir storage target encroachment it is assumed that a constant supplemental release (in excess of minimum releases) will be initiated at a rate equal to the encroachment divided equally over the next 7 days. This protocol repeats itself every 7 th day, reestablishing the level of check release each time. The end result of this procedure will allow encroachment of storage space above the preferred storage target and not require unrealistic hard releases of water to exactly conform to the target. 86
 and transfers from Lake Eleanor to Lake Lloyd.")
87 Lake Eleanor Transfers and Final Reservoir and Release Computation This section of logic performs the final computation of reservoir storage and releases, including consideration of snowmelt management releases (described later) and transfers from Lake Eleanor to Lake Lloyd. Both the initial check release for preferred storage encroachment and the snowmelt check release are computed and advised for reservoir operations. If excess releases above minimum releases are computed the Model routes the additional release through the tunnel up to the limit of its available capacity or the capacity available at Holm Powerhouse. The remainder of the supplemental release is routed to the stream below Lake Eleanor. The Lake Eleanor operation protocol will transfer water that would otherwise be released in excess of minimum flow requirements (largely dependent upon the preferred target storage and snowmelt releases) but it will not allow water to be pulled from Lake Eleanor to Lake Lloyd. The operation goal linkage between Lake Lloyd and Lake Eleanor assumes that Lake Eleanor will transfer water from its watershed to Lake Lloyd for the purpose of enhancing power generation at Holm Powerhouse. Thus, any available capacity at Holm Powerhouse after the Lloyd-only operation is assumed available and desired for use of a Lake Eleanor transfer. If water is transferred from Lake Eleanor the model assumes the water to be directly routed to Holm Powerhouse which then becomes additional release from Lake Lloyd. Reservoir losses are computed in accordance with procedures of the Fourth Agreement. 87
88 Snow-melt Management A second check release is made during the February through June period for management of anticipated snowmelt runoff. On the first day of each of these months a forecast is made of anticipated runoff into the reservoir and minimum releases and losses from the reservoir, from the date of forecast through the end of June (assumed target of reservoir filling). These forecasts determine the volume of water (if any) that will require release in excess of minimum releases and losses and storage gain by the end of June. Pre-knowledge is used for anticipated runoff, minimum releases and losses. The user defines the percentage of volume (of the total volume for the period) to be additionally released during each month. For February through May, a varying percentage of the additional release volume is advised for release. The snowmelt check release is evenly distributed across the days of the month. The release can also be capped in terms of minimum volume of the reservoir to which it can be drawn during the month. 88
.")
89 5.15 SFWaterBank Workheet This worksheet (SFWaterBank) provides for entry of daily supplemental releases from the CCSF System. The worksheet is comparable to worksheet WaterBankRel except that this worksheet provides alternative methods of identifying supplemental releases (UI 3.10 = 0). Employing this option, the user can identify year type table-based supplemental flow, without or without addition of the pre-processed Test Case supplemental release. Without any other manual intervention the Model will direct releases from the CCSF System under a hold-unless-need-to-release protocol. Additional releases greater than provided by the default protocol may be needed. An example of such a need is during periods when CCSF System operations would otherwise deplete the Water Bank Account to a point of a negative balance. The manual adjustment to releases from the CCSF System is provided to allow the user to pull additional water from the CCSF System as supplemental inflow to Don Pedro Reservoir. An entry of supplemental release is established that will first pull water from Lake Lloyd so that water supply is preserved in the Hetch Hetchy Reservoir system for diversion to the SJPL. At a point when such supplemental releases strain Lake Lloyd storage, the supplemental releases are directed to Hetch Hetchy Reservoir. The supplemental release is directed from a reservoir at a point in logic after the default protocol releases occur. Thus, the release occurs in addition to what operation is already occurring by default. Such a release can affect the following day s default operation or previous periods operations, thus results require review to determine if the user s desired result occurs. SF Water Bank Account Balance Accounting, CCSF La Grange Flow Responsibility and Test Case Supplemental Releases Shown below is a snapshot of the worksheet. The worksheet provides the daily accounting of the Water Bank Account Balance for the Model. Information ported from other worksheets of the Model into this worksheet is Don Pedro Reservoir inflow (Column E) and the unimpaired flow at La Grange (Column F). These data and the protocols associated with Fourth Agreement Water Bank Account Balance accounting (Columns G through Column O) derive the daily credit or debit of CCSF and then the daily balance of the Water Bank Account (Column M). 89

90 For purposes of the FERC investigation, the protocols of Fourth Agreement Water Bank Accounting have been amended to incorporate a hypothetical implementation of shared responsibility for incremental increases in FERC-required flows for the Tuolumne River. 4 If running the scenario with shared responsibility has been selected (worksheet UserInput Switch UI 1.31 = 1), the incremental increase in FERC-required flows is determined by the daily difference between the current 1995 FERC Settlement requirements and scenario-required minimum flows. This computation occurs in worksheet LaGrangeSchedule with information regarding the scenario-required flows directed through worksheet UserInput. Approximately fifty-two percent ( %) of the incremental difference between the flow schedules is assigned as CCSF s responsibility and is ported into the worksheet in Column Q as a debit. This debit then enters the current protocols of Fourth Agreement Water Bank Accounting at Column J, and subsequently contributes to the determination of the daily Water Bank Account Balance (Column M). Water Bank Account Balances which are less than zero ( negative ) are highlighted, and the minimum balance, whether negative or positive, is reported in Cell M14. By default, the base supplemental releases to maintain a positive Water Bank Account Balance at or above zero have been entered into Column T (WB Supplemental Release). An alternative time series can be used. The Model will first direct the supplemental release to Lake Lloyd, and continue releases until storage at Lake Lloyd is drawn to a specified 45,000 acre-feet minimum level (shown in Cell Q10 and entered at worksheet CCSF Switch 3.00). Subsequent supplemental releases will be drawn from Hetch Hetchy Reservoir any time storage is less than the Lake Lloyd minimum. User Specified Table of Supplemental Releases and Reservoir Status Computation The snapshot below illustrates the section of logic that incorporates a user Specified table of supplemental releases (UI 3.40) into the Model. A daily time series (Column Y) of supplemental releases is developed from the user specified table in worksheet UserInput. By selection, the user identifies whether or not the year type table-based supplemental release is added the preprocessed Test Case supplemental releases (Column T previously described). The Model then uses the selected supplemental release in its computation of operations. 4 The shared responsibility assumption is presented for the purpose of evaluating alternative operations. The assumption shall not be used as evidence in any proceeding relating to and shall not act as precedence for any allocation of Tuolumne River water between CCSF and the Districts for any purpose under the Fourth Agreement. 90

91 The result of entering the supplemental release will cause a recalculation of the entire Model with results refreshed in the worksheet. Lake Lloyd, Hetch Hetchy Reservoir and Don Pedro Reservoir storage is ported from other worksheets to provide the status of their storage as supplemental releases are entered. Warnings and advice are provided in the worksheet when several conditions occur. The snapshots below illustrate the occurrence of these conditions. Example 1: A Reservoir Empties and the Model Crashes Note: This screen save is from the worksheet WaterBankRel description. Identical warnings are included in worksheet SFWaterBank. A warning has been provided that a reservoir has likely been depleted by the current operation assumptions. In this particular example, Tuolumne River minimum flows were increased with responsibility shared with CCSF, and a set of supplemental releases were established. In this iteration of results it is discovered in Column X (Hetch Hetchy Reservoir storage) an error (reported as #N/A ) on August 26, 1992 has occurred in the Model. By review of the previous day s storage results for Lake Lloyd (Column W), Hetch Hetchy Reservoir (Column X) and Don Pedro Reservoir (Column Y), and the rate of depletion for each of these reservoirs, it is concluded that Hetch Hetchy Reservir likely drained on August 26 and thus crashed the Model. Although noted, a negative Water Bank Account Balance (Column M) will not cause the Model to crash. To remedy the condition, the user uses worksheet UserInput to revise (lower) SJPL diversions from Hetch Hetchy Reservoir (UI 4.10 and UI 4.20) and retain water in Hetchy Hetchy Reservoir for release. If Don Pedro Reservoir storage was the culprit of causing the Model to crash, the user uses worksheet UserInput to revise (lower) MID and TID canal diversions (UI 2.10, UI 2.20 and UI 2.30 to retain water in Don Pedro Reservoir for release. Alternatively, the user could reduce the scenario s designated minimum flow requirement, which would change flow needed from the upstream systems. 91

92 Example 2: Water Bank is Negative. Note: This screen save is from the worksheet WaterBankRel description. Identical warnings are included in worksheet SFWaterBank. A warning has been provided that the Water Bank Account Balance is negative for one or more days of the scenario. In this instance, all Model reservoirs are operating within a viable operation (the Model did not crash due an emptying reservoir); however, the objective to maintain a positive Water Bank Account Balance has been violated. Upon inspection of the results the user can find the first instance of violation and remedy the violation by entry into Column T an amount of release that maintains at least a zero balance in the Water Bank Account Balance, and/or modify the year type table-based supplemental flows in worksheet UserInput. For the first day of violation the reported negative balance (e.g., -3,253 acre-feet) is needed as a supplemental release. The ensuing days of supplemental release are informed by Column P. It is possible that within the remedy of Example 2 the error exemplified by Example 1 may occur as Hetchy Hetchy Reservoir may be drained through the efforts of maintaining a positive Water Bank Account Balance. At that point, the procedures of Example 1 will be required and the values already derived for supplemental releases may need to be revisited and possibly changed. 92
 either the current 1995 FERC schedule is selected (UI 1.10 = 0) or the user defined minimum flow requirement is selected (UI 1.10 = 1).")
93 5.16 LaGrangeSchedule Workheet This worksheet (LaGrangeSchedule) assembles the designation of the minimum flow requirement for the Tuolumne River. By user specification (UI 1.10) either the current 1995 FERC schedule is selected (UI 1.10 = 0) or the user defined minimum flow requirement is selected (UI 1.10 = 1). If the current 1995 FERC schedule is selected the computation of the schedule is computed in this worksheet (later described). Minimum Flow Requirement Options When using current 1995 FERC minimum flow requirements, the user can within worksheet Control (C 1.60) direct which shape of releases to assume for pulse flows during April and May. This section of the worksheet performs the parsing the monthly flow requirements into daily flow requirements. If using the user specified flow schedule (identified and processed in worksheet UserInput), this section prepares the use of that data for use by the Model. Upon selection of the flow requirement, Column F is used to provide the minimum flow requirement to the rest of the Model. Although not directly linked through user switches, this section of the worksheet illustrates an example of developing an alternative flow requirement for testing. Columns M through Column Q perform a synthesis of an alternative flow requirement as has been suggested by the SWRCB. This particular flow requirement currently serves as the example alternative requirement for this documentation. The specifics of this component of flow requirement (February through June) in combination with the current 1995 FERC minimum flow requirement has been provided to worksheet UserInput for illustration purposes. April May Daily Parsing of Flow Requirements This section of the worksheet provides information to parse monthly-designated minimum flow requirements into daily patterns during April and May. Worksheet Control designates which parsing pattern is to be used. 93


94 Computation of 1995 FERC Minimum Flow Requirement This section of the worksheet computes the current 1995 FERC flow requirement. Several elements of information provided in this worksheet and from worksheet Control provide the computation of flow requirement based on 1995 FERC Settlement procedures and flow rates. The basis of the year type flow requirements is the SWRCB San Joaquin River Basin index. The annual flow schedules are assumed to be apply on a April through March year, with the interpolation water of the schedules applied to April and May pulse flows. A snapshot of the worksheet s computation area is shown below. San Francisco La Grange Responsibility Also performed in this worksheet is the computation of the hypothetical responsibility of CCSF for Tuolumne River incremental flow requirements. 5 A snapshot of the computation area is shown below. 5 The shared responsibility assumption is presented for the purpose of evaluating alternative operations. The assumption shall not be used as evidence in any proceeding relating to and shall not act as precedence for any allocation of Tuolumne River water between CCSF and the Districts for any purpose under the Fourth Agreement. 94

95 The 1995 FERC flow requirement and the scenario flow requirement are compared on a daily basis to identify the difference between the two schedules. The CCSF 52% responsibility factor is applied to the total difference, which values are then provided to the WaterBankRel and SFWaterBank worksheets for use if selected. 95

96 5.17 DailyCanalsCompute Workheet This worksheet (DailyCanalsCompute) performs the computation of the daily canal demands of the MID and TID. The computation of canal demands incorporate the PDAW and canal operations practices of the districts. This worksheet also incorporates the application of a Water Supply Factor (from worksheet DPWSF) that reduces canal diversions during limited water supply conditions. The results from this worksheet have been provided to the Model for the Test Case scenario. Projected Demand for Applied Water and Don Pedro Water Supply Factor This section of logic incorporates two components of information into the computation of canal demands. The PDAW for each District is a pre-processed Model entry based on an estimate developed by the California Department of Water Resources Consumptive Use model. The monthly time series for PDAW for the simulation period is modified prior to use in the computation to refine the demand to recognize the local districts delivery records. The second component of information is the Don Pedro Water Supply Factor (WSF). This fraction is computed in worksheet DPWSF and reflects limited water supplies during periods of drought. The factor is used to reduce canal diversions, based on antecedent reservoir storage and forecasted inflow to Don Pedro Reservoir. There are several versions of the WSF available for use in the Model if user access is allowed. The full demand WSF will produce a canal demand/diversion equal to full needs, as if the available water supply is sufficient to meet the full canal demands. The WSF table included in the Model represents canal demands including reductions from full diversions, and manages water supplies to produce a reservoir operation similar to that occurred during the drought. District Canal Demand Calculation The sections of logic shown below illustrate the components of District canal operations that factor into the computation of daily canal demands/diversions. These components build on top of the PDAW to develop a daily canal demand from Don Pedro Reservoir. The PDAW is represented as a daily varying demand based on recent historical daily diversion shapes while the canal operation parameters are generally represented by an even distribution pattern within each month. 96


97 District Canal Operation Assumptions The canal operation assumptions, e.g., seepage and losses and canal operation spills, are identified in this worksheet (entered into worksheet Control). These parameters are provided to the computations shown above. The canal operation assumptions for each District are shown below. 97
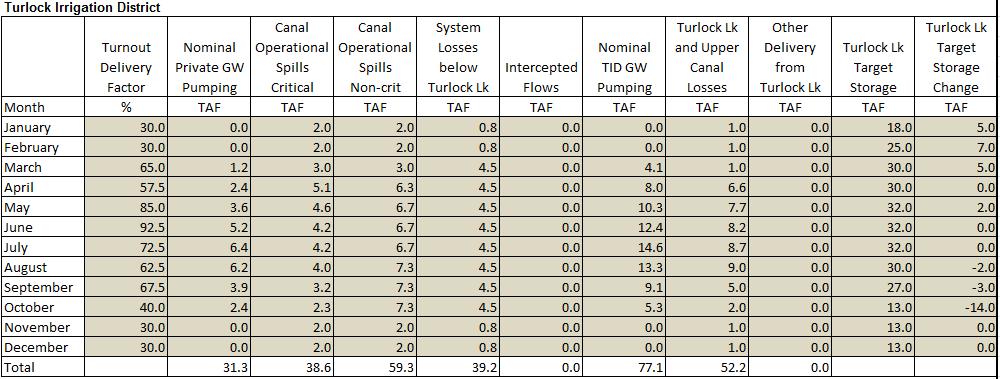
98 98


99 5.18 DailyCanals Workheet This worksheet (DailyCanals) assembles the appropriate canal demands for the scenario. While worksheet DailyCanalsCompute is capable of providing several versions of canal demands, worksheet DailyCanals readies either those selected demands or alternatively defined demands for the Model. Model (scenario) Canal Demands The section of logic shown above illustrates the two columns of data used by the Model (worksheet DonPedro) for canal diversions by MID and TID. The data version of demand used is user specified. If using the worksheet UserInput interface, UI 2.10 selects whether pre-processed Test Case diversions are used or a user specified table of diversions are used. If access to worksheet DailyCanalsCompute is granted, a time series of canal diversions from worksheet DailyCanalsCompute is used. Test Case and Alternative Canal Diversions This section of logic provides the Model either a pre-processed time series of canal diversions (Test Case) or a time series of canal diversions that has been specified by the user in worksheet UserInput (UI 2.20 and UI 2.30) as monthly canal demands for the simulation period. A snapshot of the worksheet is shown below. This section of logic also parses the user specified monthly table of canal diversions into a daily diversion pattern based on the Test Case scenario s daily pattern of diversions. 99

100 Adjacent to the above illustrated area of computations are several components of data assemblage. The monthly time series columns serve to summarize daily Test Case diversions assumptions and provide user specified monthly diversions for daily parsing. The chronological matrices provide an alternative listing of the monthly data. 100

101 5.19 DPWSF Workheet This worksheet (DPSWF) computes the Don Pedro Water Supply Factor (WSF). The premise of the WSF factor is to reduce the amount of water diverted to the canals during years when lack of carryover storage at Don Pedro Reservoir becomes a concern. The modeling mechanism used to reduce canal diversions is a factor applied to the PDAW of the canal demand. This mechanism results in a reduction to the amount of water turned out to the customers while still recognizing the relatively constant efficiencies of canal operations. The WSF is established by forecasting upcoming water supply, based on antecedent storage and anticipated inflow to Don Pedro Reservoir. The forecasting procedure begins in February and ends in April. The Factor Table is based on April forecast results. The February and March Forecasts act as adjustments to get to the April 1 state. The forecasts have the following protocol: February Forecast (forecasting April 1 state): End of January storage + Feb-Jul UF - Feb-Jul US adjustment - Feb-Mar minimum river March Forecast (forecasting April 1 state): End of February storage + Mar-Jul UF - Mar-Jul US adjustment - Mar minimum river April Forecast: (final) End of March storage + Apr-Jul UF - Apr-July US adjustment Pre-knowledge of unimpaired runoff for each forecast period is assumed, as well as knowledge of upcoming upstream impairment of the runoff. The WSF factor / Don Pedro Storage + Inflow relationship is developed through iterations of multi-year system operation simulations. The WSF depicts actions that may be implemented during times of drought, and the projected canal diversions and reservoir storage operation during drought periods. The factors and index triggers were developed reviewing reservoir storage levels that occurred during the drought. A snapshot of the worksheet is shown below. 101

102 5.20 CCSF Workheet This worksheet (CCSF) identifies, assembles and directs several elements of CCSF System operations, and provides input to other Model component worksheets. San Joaquin Pipeline Diversions The first section of logic concerns the identification of SJPL diversions. A snapshot of this section is shown below. By user selection (UI 4.10) either pre-processed Test Case SJPL diversions are used, or a user specified table of monthly diversions for the simulation period are used. This section assembles the user selected version of diversions for use by the Model. These two versions of SJPL diversions are available for selection through worksheet UserInput. If access is granted, a third version of SJPL diversions is provided which revises Test Case diversions based on circumstances of the scenario that changes CCSF s operation. Procedures are described below the monthly diversion matrix describing how to employ this third version of SJPL diversions. CCSF System Storage and Action Levels This section of logic provides reporting and computational functions. The CCSF System action level computation analyzes scenario results concerning CCSF s reservoir storage and extrapolates that information into advised action levels within the CCSF System. Germane to the FERC investigation is the potential effect that flow responsibility placed upon CCSF may have upon its water system and deliveries. The relationship between CCSF System reservoir storage and action levels (translated to increased delivery rationing) is incorporated into this worksheet. Upon changed conditions within a scenario (as compared to Test Case conditions), the change in action levels is identified. This change is also provided the SJPL diversion logic described above, and if allowed to be selected this worksheet will perform an adjustment to SJPL diversions. 102


103 Hetch Hetchy Reservoir Control This section of logic identifies several underlying operation constraints for Hetch Hetchy Reservoir. Snapshots of this section are shown below. The minimum stream release below Hetch Hetchy Reservoir is computed in this section. Also identified in this section are reservoir storage targets and limits. This information is used in worksheet SFHetchHetchy for several operational constraints and objectives. 103


104 Lake Lloyd Control This section of logic identifies several underlying operation constraints for Lake Lloyd. A snapshot of this section is shown below. The minimum stream release below Lake LLoyd is computed in this section. Also identified in this section are reservoir storage targets and limits, and the target release objective for Holm Powerhouse. The maximum drawdown of Lake Lloyd due to supplemental releases is identified. This information is used in worksheet SFLloyd for several operational constraints and objectives. Lake Eleanor Control This section of logic identifies several underlying operation constraints for Lake Eleanor. A snapshot of this section is shown below. The minimum stream release below Lake LLoyd is computed in this section. Also identified in this section are reservoir storage targets and limits. This information is used in worksheet SFEleanor for several operational constraints and objectives. 104