Evolution of Modeling Tools to Support Management and Restoration of the Great Lakes
|
|
|
- Cameron Wiggins
- 5 years ago
- Views:
Transcription


1 NCER 2011 Conference Baltimore, MD August 1-5, 2011 Evolution of Modeling Tools to Support Management and Restoration of the Great Lakes Joseph DePinto, Todd Redder, Ed Verhamme, Tim Dekker LimnoTech Ann Arbor, MI
2 Presentation Outline Perspective on Integrated Decision Support Modeling in the Great Lakes Case Studies Maumee River sediment and nutrient Management Lower Don River, Toronto Redevelopment Design Great Lakes water level regulation Policies The Future
3 Modeling for Great Lakes Management whole lake models Focus on nutrient eutrophication modeling Models used to establish P as limiting nutrient in Great Lakes Models used to set targets loads for phosphorus to lakes Lake Erie 1980 present Focus on persistent, bioaccumulative, toxics Models used to assess exposure to PBTs Models used to quantify time-dependent load response relationships Fish bioenergetics and population dynamics models Models help understand the upper food web of each Great Lake Models used to support stocking and harvest decisions 3
4 Drivers for Development of Integrated Decision Support Models in Great Lakes (1990 present) Concern about relative impacts of multiple stressors acting in concert to produce multiple ecosystem responses issue feedback models (e.g., impact of ANS invasions on trophic conditions; effects of trophic conditions on toxics exposure, effects of water levels on coastal ecosystems) Concern about nearshore impacts (link fine-scale physical models to nutrient-eutrophication models) Quantify linkage between land use/watershed actions and lake trophic state (link watershed models to lake models) Ecosystem Forecasting needed to support Ecosystem Restoration in the Great Lakes
5 Integrated Decision Support Modeling: Converting Data to a Decision Increasing Integration and Utility Decision Knowledge and Understanding Information Data Increasing Resource and Knowledge Requirements


6 Lower Maumee River Lake Erie western basin Model (LMR-MB) Example of Integrated Decision Support Modeling for Management Decisions: Regional sediment management and rivermouth harmful algal bloom management
 >70% open-lake disposal Nutrients nuisance & harmful algal blooms Support USACE management decisions: Minimize need for")
 Navigation Coastal")
7 LMR-MB Model Project Objectives Model ecological response to external (Maumee Watershed) and internal (winddriven resuspension) sources: Sediment sedimentation and turbidity Annual navigation channel dredging ~640,000 yd 3 (~$5M/yr) >70% open-lake disposal Nutrients nuisance & harmful algal blooms Support USACE management decisions: Minimize need for dredging and associated impacts Beneficial reuse of dredged material for habitat enhancement Nutrient Eutrophication problems LMR-MB model is one component of a linked watershed-receiving water model to support comprehensive system management planning: Sediment management Nearshore water quality management (GLRI - WLEBP) Navigation Coastal erosion Flood control
 Water Quality Linkage Flows Suspended solids")
8 Lower Maumee River-Western Basin Modeling Framework Simulating Waves Nearshore (SWAN) Wind-Wave Sub-Model Hydrodynamics Water level Current velocity Wind-Waves Significant height Direction Frequency EFDC Model Hydrodynamic Sub-Model Shear Stress Current velocity Sediment Transport Sub-Model Nutrient & Eutrophication Sub-Model (RCA) Water Quality Linkage Flows Suspended solids Settling/resuspension rates

9 WinModel Data Analysis and Visualization Tool Comprehensive framework for model processing and visualization Spatial and temporal profiles Map-based; animations Scenario comparisons Configured for use with multiple modeling tools Significantly improves model management and calibration/application efficiency Provides user-friendly tools for evaluating model results and regulatory and management alternatives 9

10 WinModel Visualization Tools Water quality and sediment sub-model results Spatial and temporal plots Compare multiple scenarios/variables View different longitudinal profiles / maps Display results on the model grid/map Animate through time/space Export Results Monitoring data by source/program 10
")

11 Model-Data Comparison for Total Suspended Solids (6/18/2004) Maumee Flow: 28,200 cfs Data provided by Tom Bridgeman, University of Toledo

12 Simulation of Bed Elevation Changes in Proposed Shoal Areas During


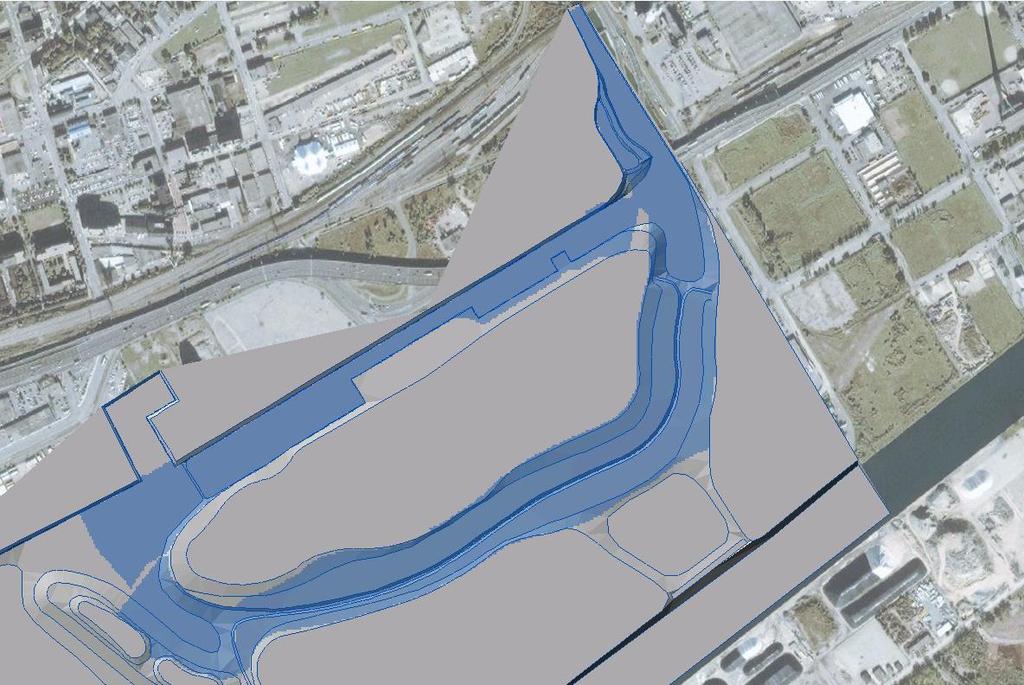
13 Lower Don River, Toronto hydraulic-sediment transport model Example of Integrated Decision Support Modeling for Restoration Design Decisions: Redesign river channel to support multiple ecosystem services

14 Lower Don River, Toronto Toronto Waterfront Revitalization Corporation (now Waterfront Toronto) supported a design project to produce a bold and compelling concept for the Lower Don River LimnoTech worked with Michael Van Valkenburgh Assoc. and Applied Ecological Services to produce a redevelopment design
15 Donlands Design Drivers Provide a restored, sustainable rivermouth ecosystem at the mouth of the Don River Create a continuous riverfront park system Provide for harmonious new development Connect waterfront neighborhoods Prioritize public transit Develop a gateway into the port lands Promote sustainable development Expand opportunities to interact with the water Manage floodwaters and sediment load 15

16
17
18

19 Bed Elevation Change for 5-year Event Design Simulation Sediment trap ~ 11,250 m3 deposition
20 Maintenance Schedule: Baseline Trap (71 m elevation, ~ 15,000 m3) For a typical year: Anticipate dredging trap at least twice per year: Expect drop in trap efficiency at ~ 60-75% full (~9,000-11,250 m3). Similar to the deposition in the 39-day simulation and the 2-yr design event. Dredging when 33% full (~ 5,000 m3) would leave enough capacity for a 2-yr event and would require dredging approximately four times per year. Events: 2-yr event and larger expected to necessitate maintenance. 5-yr event captured only if trap starts empty. 25-yr event overfills trap.

21 21

22 Integrated Ecological Response Models Example of Integrated Decision Support Modeling for Policy Decisions: Evaluation of water level and flow regulation plans for Lake Ontario and St. Lawrence River (LOSL-IERM) and for Upper Great Lakes (IUGLS-IERM2)
 Lower St.")

23 LOSL Regulation Study Area Moses Saunders Dam (Plan 1958DD) Lower St. Lawrence River Trois-Rivieres Quebec Montreal Canada U.S. Toronto Lake Ontario Rochester Upper St. Lawrence River
24 Role of IERM in Study ETWG researchers H&H-PI Relationships Water regulation plans, natural hydrology Other Interests Integrated Ecological Response Model (IERM) Shared Vision Model (SVM) Regulation plan
25 IERM Conceptual Model LO/USL/LSL Water Levels & Discharge Wetland Vegetation Abundance & Diversity Fish Habitat Supply & Abundance Wetland Bird Abundance & Diversity Herptile Habitat Supply Mammal Habitat Supply Species-At-Risk Habitat Supply

26 IERM Decision Support Tool

27 IERM Target Diagram

28 IERM PI Time Series Diagram
29 Environmental Performance for Plan Selection (Ratio relative to no regulation based on historical supplies) Performance Indicators Current Plan New Plan Lake Ontario Wetland Meadow Marsh Community Least Bittern reproductive index Virginia Rail reproductive index Black Tern reproductive index King Rail preferred breeding habitat Upper St. Lawrence River Northern Pike YOY net productivity Virginia Rail reproductive index Muskrat house density Lower River Muskrat surviving houses Out of the 19 environmental performance indicators examined on the Lake and Upper River, those listed above showed a significant difference between the current and new plan. None of the 13 PIs on the Lower River showed any significant difference including the muskrat. 29


30 The Future - Continued Development of: Multi-stressor, multi-response aquatic ecosystem models Multi-media models, including linked watershed receiving water models Fine-spatial scale linked hydrodynamic sediment transport water quality models Integrated Models with Decision Support Systems Integrate ecological systems with human systems models Downscaling of GCMs to Great Lakes region and analysis of climate change impacts
31 Joseph V. DePinto LimnoTech
32 Great Lakes Restoration Initiative Largest investment in the Great Lakes in over two decades. Task force of 11 federal agencies developed an action plan for Addresses five urgent issues (themes): Cleaning up toxics and areas of concern; Combating invasive species; Promoting nearshore health by protecting watersheds from polluted run-off; Restoring wetlands and other habitats; and Tracking progress and working with strategic partners. 596 projects funded in 2010 (>$400M)

33 33
34 Bed Elevation (m) Initial and Ending Bed Elevation Profiles: 5-yr Event Design Simulation Initial Ending ~ 11,250 m 3 deposition within trap Upstream Distance (m)
35 LOSL Technical Working Groups Study Board IM Coastal processes Environmental Domestic, industrial and municipal water uses Recreational boating Commercial navigation Hydropower Hydrology and hydraulics Plan formulation and evaluation Public interest advisory group