Update on Cuyama Basin Groundwater Modeling
|
|
|
- Marcus West
- 5 years ago
- Views:
Transcription
1 Cuyama Basin Groundwater Sustainability Agency Update on Cuyama Basin Groundwater Modeling December 3, 2018


2 Approach for Cuyama Basin Model Development Develop a Robust and Defensible Integrated Water Resources Model Robust Model Grid Agricultural and Domestic Water Demands Include physical features affecting movement of surface and groundwater Consider interaction between groundwater and surface water systems Unconfined Aquifer Confined Aquifer Irrigated Agriculture Aquitard River Agriculture Supply Well Runoff Stream Groundwater Table Domestic Water Use Deep Monitoring Well Shallow Monitoring Well Domestic Supply Well
3 Cuyama Basin Integrated Water Resources Model Development Schedule Develop Water Assess Available Data and Model Options Develop an Integrated and Comprehensive Model Calibrate and Verify Model Budgets and Intrabasin Flows Support GSP: Evaluate Sustainability Options Cuyama Basin Stakeholders


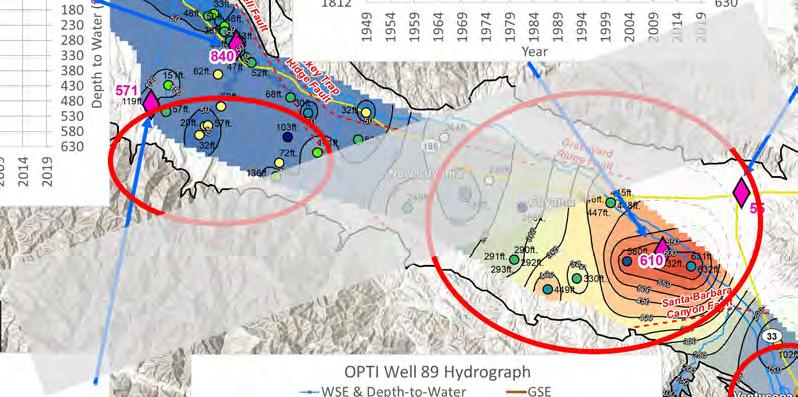
4 Model Network Model Grid 6,582 elements Avg element size: 36.8 acres Includes faults, stream and drainage system, and jurisdictional boundaries
5 Data Used in the Model Model Period: Calibration Period: Daily Rainfall Daily Streamflow Reconstruction Runoff Geologic & Hydrogeologic Characterization Land Use and Cropping Patterns River Stream Domestic Water Use Soil Conditions Population and Domestic Water Use Irrigated Agriculture Groundwater Wells Irrigation Practices Other Data as Needed Unconfined Aquifer Confined Aquifer Aquitard Agriculture Supply Well Groundwater Table Deep Monitoring Well Shallow Monitoring Well Domestic Supply Well
6 Model Calibration Calibration Goals: Develop water budgets to reasonably represent the conditions for each area Match short and long term model groundwater levels to observed groundwater levels at select target wells Match model streamflows to observed (or reconstructed) stremflows Minimize overall uncertainties between model results and reported and/or observed data
7 Model Calibration: Groundwater Levels
8 Model Calibration: Groundwater Levels
9 Model Calibration Statistics Basin Wide
10 Water Budgets Time Frames Historical Conditions Historical hydrology, land use and population ( ) Current Conditions 2017 land use and population historical hydrology Future Conditions Year 2040 land use and population Assumed to be the same as Current Conditions historical hydrology With and without climate change
 Average Annual Precipitation: Entire Basin: 12.6 inches Valley Floor: 11.0 inches Foothills: 14.")
11 Cuyama Basin Adjusted PRISM Precipitation Cuyama Basin Annual Precipitation (based on adjusted PRISM dataset) Average Annual Precipitation: Entire Basin: 12.6 inches Valley Floor: 11.0 inches Foothills: 14.2 inches

12 Cuyama Basin Land Use Land Use under Historical Conditions Irrigated: 17,400 acres Domestic: 520 acres Population: 1,072 Unit Water Use: 170 GPCD
 Inflows Precipitation 223 TAF (~11 in) Applied Water 60 TAF Outflows Ag. Actual ET 58 TAF Native Veg.")
13 Draft Land Surface Water Budget: Basin Wide *Preliminary results, subject to change. Average Annual (20 years) Inflows Precipitation 223 TAF (~11 in) Applied Water 60 TAF Outflows Ag. Actual ET 58 TAF Native Veg. Actual ET 182 TAF Domestic Actual ET <0.1 TAF Deep Perc. 32 TAF Runoff 11 TAF
 Ag. Pumping: 60 TAF Ag. Demand: 60 TAF Domestic Pumping: 0.")
14 Draft Land & Water Use Budget: Basin Wide *Preliminary results, subject to change. Average Annual (20 years) Ag. Pumping: 60 TAF Ag. Demand: 60 TAF Domestic Pumping: 0.2 TAF Domestic Demand: 0.2 TAF
 Inflows: Deep Perc.")
15 Draft Groundwater Budget: Basin Wide *Preliminary results, subject to change. Average Annual (20 years) Inflows: Deep Perc. Stream Seepage Boundary Flow Outflows: GW Pumping *Preliminary results, subject to change.
16 Draft Groundwater Budget: Basin Wide *Preliminary results, subject to change. *Preliminary results, subject to change. Average Annual (20 years) Inflows: Deep Perc. Stream Seepage Boundary Flow Outflows: GW Pumping GW Storage Change 20 TAF /Yr

17 Draft Overall Water Budget: Basin Wide *Preliminary results, subject to change. *Average Annual Values in TAF (20 years)
18 Water Budgets Time Frames Historical Conditions Historical hydrology, land use and population ( ) Current Conditions 2017 land use and population historical hydrology Future Conditions Year 2040 land use and population Assumed to be the same as Current Conditions historical hydrology With and without climate change
 Average Annual Precipitation (50 years) Entire Basin: 13.1 inches Valley Floor: 11.5 inches Foothills: 14.")
19 Future Conditions Cuyama Basin Adjusted PRISM Precipitation Cuyama Basin Annual Precipitation (based on adjusted PRISM dataset) Average Annual Precipitation (50 years) Entire Basin: 13.1 inches Valley Floor: 11.5 inches Foothills: 14.8 inches

20 Future Conditions Cuyama Basin Land Use Year 2017 Land Use estimates based on data from private landowners and remote sensing Land Use under Future Conditions Irrigated: 16,700 acres Domestic: 800 acres Population: 1,072 Unit Water Use: 170 GPCD
 Applied Water 49 TAF Outflows Ag. Actual ET 52 TAF NV Actual ET 188 TAF Dom. Act. ET <0.1 TAF Deep Perc. 29 TAF Runoff 10 TAF")
21 Future Conditions Land Surface Water Budget: Basin Wide *Preliminary results, subject to change. *Preliminary results, subject to change. Average Annual (50 years) Inflows Precipitation: 230 TAF (~11.4 in) Applied Water 49 TAF Outflows Ag. Actual ET 52 TAF NV Actual ET 188 TAF Dom. Act. ET <0.1 TAF Deep Perc. 29 TAF Runoff 10 TAF
22 Future Conditions Groundwater Budget: Basin Wide *Preliminary results, subject to change. Average Annual (50 years) Inflows: Deep Percolation Stream Seepage Boundary Flow Outflows: GW Pumping


23 Future Conditions Groundwater Budget: Basin Wide Historical Average Annual Storage Change: 20 TAF *Preliminary results, subject to change. Upper Bound ~ 12 TAF Lower Bound ~ 22 TAF Average Annual (50 years) Inflows: Deep Percolation Stream Seepage Boundary Flow Outflows: GW Pumping
24 Future Conditions Overall Water Budget: Basin Wide *Preliminary results, subject to change. *Average Annual Values in TAF (50 years)

25 Projects and Actions to Close the Gap Between Water Supplies and Demands Demand Reduction Actions Pumping restrictions/allocations Water accounting Water metering Water market Supply Enhancement Projects Storm and flood water capture Water supply imports/exchanges
26 Questions and Discussion Groundwater Modeling Clarifying Questions? How the model works Historical conditions and trends Water budgets under current and future conditions In addition to what has been presented, what other information from the model would help you understand water resources in the Cuyama Valley?
27 Cuyama Basin Groundwater Sustainability Agency Review of Preliminary Thresholds December 3, 2018
28 Preliminary Thresholds Presentation Overview Purpose of presentation Minimum Thresholds Overview Measurable Objectives Overview Threshold Regions Overview Threshold Rationale Component Examples Preliminary Threshold Rationales Next Steps
29 Purposes of Presentation Present preliminary threshold rationales for threshold regions Gain consensus on recommended threshold rationales Gain clarification on threshold rationales in regions without a recommendation Some regions have differing perspectives on appropriate threshold rationale Threshold rationale options present today meet technical/regulatory requirements Local control via CBGSA Board allows board to select appropriate thresholds
30 Why Minimum Thresholds? Required by SGMA Establish Range of Operation in Groundwater Basin Protect other Groundwater Pumpers For Example: Keep Groundwater Levels High Enough to: 1. Ensure adjacent pumpers have access to groundwater 2. Protect access to groundwater in Community Services District well

31 Minimum Thresholds and Measurable Objectives Example Groundwater Elevation Time in Years

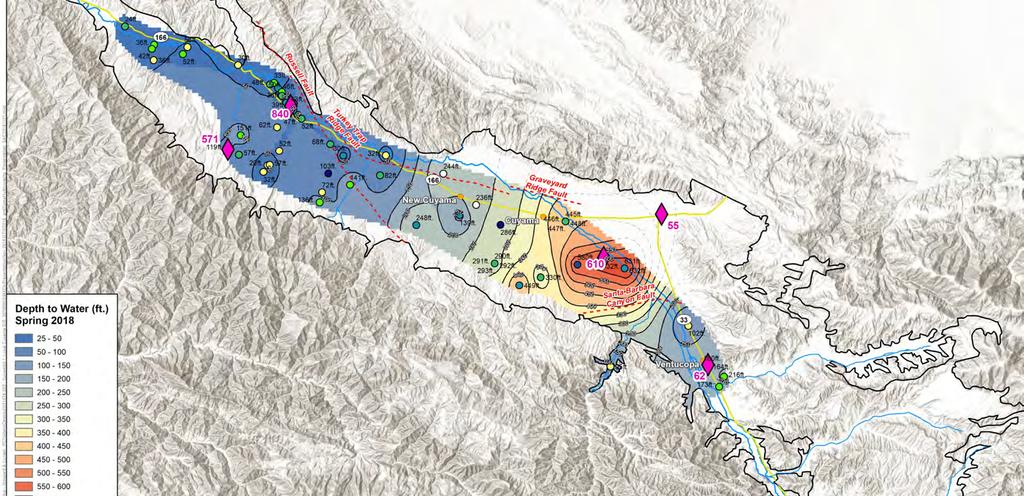
32 Where are Thresholds Applied? Minimum Thresholds are only applied to Representative Wells within the Monitoring Network.
33 Minimum Thresholds Indicate that above this threshold undesirable results are not occurring The lowest the basin can go at this monitoring point without something significant and unreasonable happening to groundwater Are set on the monitoring network at each monitoring point Set by using a rationale to reach a quantitative threshold
34 Measurable Objectives (MOs) Overview MOs are quantitative goals that are set to create a useful Margin of Operational Flexibility (MoOF). The MoOF is an amount of groundwater above the MT that should accommodate droughts, climate change, conjunctive use operations, or GSP implementation activities. The MoOF should be used to provide a buffer in groundwater levels so that the basin can be managed without reaching minimum thresholds during drought periods 8

35 What if Thresholds are Not Met During GSP Implementation? GSP regulations and BMPs do not encourage management of discrete portions of the basin as they relate to individual monitoring wells For each individual monitoring well: When a minimum threshold is unexpectedly reached, the GSA should investigate why, and evaluate whether the threshold is reasonable or not, given current conditions compared to conditions when the GSP was adopted. Will be discussed in Management Actions Section of GSP As thresholds relate to the entire basin: The Undesirable Result is considered to occur during GSP implementation when XX% of representative monitoring wells (XX of 49) for levels fall below their minimum groundwater elevation thresholds for (#) of consecutive years.
36 Threshold Regions a way to describe which areas use which threshod rationales Need a way to document how we established threshold rationales in which portions of the basin Allowable under regulations Terminology reflects use of area with different threshold rationale Has no management action implications Is not related to project and management actions in any way


37 Why Threshold Regions?
38 Board Direction on Minimum Thresholds Approved Motion from November 7, 2018 Board Meeting Direct Woodard & Curran to use Option D to develop preliminary threshold numbers.
39 Option D
40 Schedule for Thresholds Discussion Tech Forum Oct 23 SAC Nov 1 Board Nov 7 Input and Discussion Tech Forum Nov 28 SAC Nov 29 Initial Recommendations Board Dec 3 Public Workshop Dec 3 Board Direction on Sustainability Thresholds Jan 9 Release Thresholds GSP Section Jan 18 SAC Jan 31 Discussion on Draft GSP Section
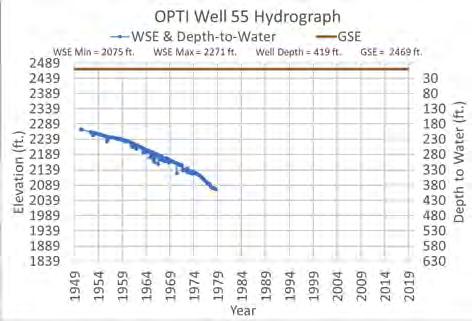
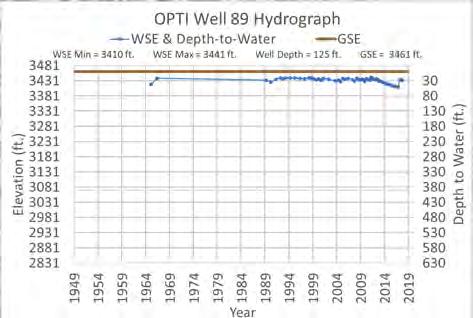
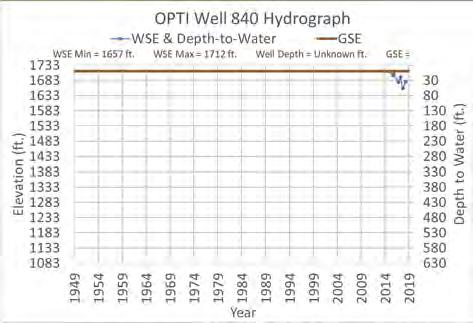
41 Threshold Rationale Components Example Hydrograph Refresher Ground Surface Level Elevation above sea level Measurement Point Depth to Water Years
42 Threshold Rationale Components Example Nearest to January 1, 2015 Elevation above sea level March, 2015 Depth to Water Years
43 Threshold Rationale Components Example 5 Years of Storage 5 years before 2015 Elevation above sea level MoOf 5 years Depth to Water Years

44 Depth to Water Threshold Rationale Components Example 20% of Range Historic High Historic Low Elevation above sea level Range of Measurements 30 feet 20% of Range = 6 feet Years
45 Measurable Objectives (MOs) & Minimum Thresholds (MTs) Key Thoughts Thresholds in the 2020 Cuyama GSP are a *Starting Point* to identify what is sustainable in the basin No single rationale or method works across the entire basin Limited periods of record in monitoring in some wells cause uncertainty in defining thresholds and will require updates as more data is collected over time Thresholds will be updated in GSP update in
46 Southeastern Region
47 Southeastern Region Propose 20% of Range Measurable Objective 5 years of Storage Minimum Threshold 20% of Range below 1/1/2015 Measurement
48 Southeastern Region Advantages/ Disadvantages 20% of Range as Basis for Minimum Thresholds Advantages Maintains 5 years of storage between minimum threshold and measurable objective Maintains groundwater elevations 6 feet below 2015 levels Disadvantages Maintains groundwater elevations 6 feet below 2015 levels
49 Eastern Region

50 Eastern Region Propose 20% of Range Measurable Objective 5 years of Storage Minimum Threshold 20% of Range below 1/1/2015 Measurement
51 Eastern Region Advantages/ Disadvantages 20% of Range as Basis for Minimum Thresholds Advantages Maintains 5 years of storage between minimum threshold and measurable objective Maintains groundwater elevations at 2017 levels Disadvantages May not restore groundwater levels to 2015 conditions Maintains groundwater elevations at 2017 levels
52 Central Region
53 Three Minimum Threshold Options for Central Region Use 20% of Range below 1/1/2015 measurement Use 2015 measurement as minimum threshold Use 2015 measurement as measurable objective

54 Central Region 20% of Range Measurable Objective 5 years of Storage Minimum Threshold 20% of Range below 1/1/2015 Measurement
 January 1,")
55 Central Region 2015 as MT Measurable Objective 5 years of Storage Minimum Threshold Measurement Closest to (but after) January 1, 2015
 Minimum Threshold 5 years of drought")
56 Central Region 2015 as MO Measurable Objective 1/1/2015 (or closest Measurement, or calculated) Minimum Threshold 5 years of drought storage
57 Central Region Advantages/ Disadvantages of Three Options for Minimum Thresholds Advantages 20% of Range Recognizes current conditions 2015 as Minimum Threshold Attempts to regain 2015 groundwater levels 2015 as Measurable Objective Provides flexibility to adjust land and water use practices Disadvantages 20% of Range Lower long term groundwater levels 2015 as Minimum Threshold Current levels are below minimum threshold 2015 as Measurable Objective Lower long term groundwater levels
58 Western Region
59 Western Region 2018 as MO, 10 feet as MT Measurable Objective 2/1/2018 Measurement Minimum Threshold 10 feet below Measurable Objective
60 Western Region Advantages/ Disadvantages of Using 2018 for Measurable Objective Advantages Recognizes lack of historic data Provides flexibility for moving forward, can adjust as needed Maintains estimated 5 years of storage between minimum threshold and measurable objective Disadvantages

61 Northwestern Region
62 Three Minimum Threshold Options for Northwestern Region Use 2015 measurement as measurable objective Minimum threshold based on subsidence & saturated aquifer thickness
63 Northwestern Region Use 2015 as MO Measurable Objective 1/1/2015 (or closest Measurement, or calculated) Minimum Threshold 5 years of drought storage
64 Northwestern Region MT based on subsidence & saturated aquifer thickness Measurable Objective 5 years of Storage Minimum Threshold 225 ft. below Ground Surface Elevation
65 Northwestern Region Advantages/ Disadvantages of Three Options for Minimum Thresholds Advantages 2015 as Measurable Objective Provides flexibility to adjust land and water use practices Based on subsidence & saturated aquifer thickness Provides more flexibility for operations Disadvantages 2015 as Measurable Objective Lower long term groundwater levels Based on subsidence & saturated aquifer thickness Lowest long term groundwater levels
66 Next Steps/Public Involvement Prepare thresholds for wells in Representative Monitoring Network for review by Standing Advisory Committee meeting and consideration by the Board in January 2019 Check CGBSA website (cuyamabasin.org) for meeting dates Members of the public are encouraged to attend the Standing Advisory Committee and Board meetings to provide input Prepare draft Thresholds GSP Section