Connection btwn Smart Growth and. Watershed. Approach
|
|
|
- Bertram Bridges
- 5 years ago
- Views:
Transcription

1 Connection btwn Smart Growth and Integrating Watershed Planning Watershed and Approach Transportation Planning Robert Goo Office of Wetlands, Oceans and Watersheds U.S. EPA
2 What is the Connection Between Transportation Systems and Water Resources Protection? Transportation Systems can: Increase Pollutant Loadings Metals Hydrocarbons Runoff volumes/peak runoff rates Cause unintended consequences Direct Indirect, e.g., cumulative Result in habitat destruction/degradation
 and the Safe Drinking Water Act (SDWA) with our traditional water programs alone.")
3 Meeting water quality goals Given current trends in development patterns, we will be unable to meet the goals of the Clean Water Act (CWA) and the Safe Drinking Water Act (SDWA) with our traditional water programs alone.
4 Water Quality Goals Protect existing water quality surface and ground water, wetlands Meet water quality standards Protect drinking source waters Restore impaired waters TMDL listed waters (CWA Section 303(d))
5 Rate of Land Development vs. Rate of Population Growth U.S. Population (millions) Rate of land development vs. population growth Acres of Developed Land (millions) Population Developed Land It s how and where we are growing that are driving our significantly increasing rate of land consumption, not domestic population growth.

6 Charleston CharlestonMetropolitan MetropolitanArea: Area: ,001 acres 45,001 acres
7 Charleston CharlestonMetropolitan MetropolitanArea: Area: ,222 acres 160,222 acres

8 Charleston CharlestonMetropolitan MetropolitanArea: Area: ,520 acres 555,520 acres
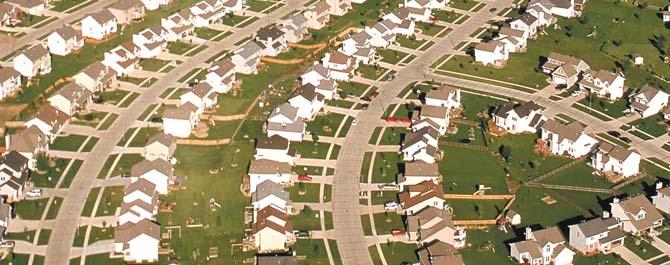
9 0% >60% Percent Development Low-density urban development is the predominant pattern of urban land cover in the United States.
10 Lot Size of New Construction, > 5 acres 9% < 1/4 acre 37% 1/4-5 acres 54%
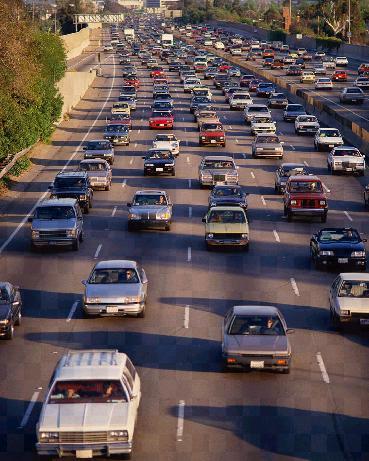
11 Trends in Vehicle Miles Traveled 3,000 1,000 2,500 Vehicle Miles Traveled Vehicle Miles Traveled Population Vehicle Miles Traveled (billions) 2,000 1,500 1, Population (millions) Year Note: 2000 figures based on nine months of data Source: Dana Beach, Pew Oceans Commission 0

12 Hydrologic units animation 1
13 Hydrologic units animation 2

14 Development Impacts on Watershed Hydrology BEFORE AFTER 40% 30% evapotranspiration 10% 50% infiltration 55% runoff 15% Development increases the volume and rate of runoff from a site, and reduces groundwater recharge and evapotranspiration. Streambase flow may also be reduced.


15 Consequences of Development to Urban Streams Large Storm Higher and More Rapid Peak Discharge Small Storm More Runoff Volume Higher Baseflow Lower and Less Rapid Peak Gradual Recession Pre-development Post-development
16 Potential Impacts of Transportation Systems on Water Resources Degradation of stream channel stability, habitat quality, and water quality (pollutants discharges) Increased frequency and volume of storm water discharges and CSOs Reduction of aquatic, fish and macro- invertebrate, biodiversity Increased water temperatures


17 Urbanization can cause localized flooding due to increases in runoff, contribute to algal blooms from nutrients, and creates erosion and sedimentation problems.
18 Atmospheric Transport & Transformation (measurements & models) (measurements Deposition Direct Load to Water Effects & models) Watershed Effects Watershed Transport Emissions (inventories) Indirect Load to Water (measurements & models)
19 Relative Contribution of Sources of Nitrogen Loads to the Bay Atmospheric Deposition to Tidal Water 7% Atmospheric Deposition to Non- Tidal Water 1% Manure 18% Atmospheric Deposition from Land 24% Chemical Fertilizer (Agriculture) 16% Septic 4% Point Source 21% Urban/MO Runoff (Non- Atmospheric) 9% ~305 million lbs. in 2000 (~98 million due to Air; 32% of inputs)


20 Multiple Factors Influence the Way We Develop Transportation Funding The 1956 Highway Act Federal Financing Programs FHA Mortgage Insurance

21 The 1949 Housing Act coupled with failed urban renewal strategies destabilized older urban neighborhoods


22 Planning and zoning dictate the pattern shown above as the path of least resistance for developers. Ordinances must be changed in order to facilitate mainstreaming of innovative alternatives.
23 Smart Growth s Guiding Principles Create a Range of Housing Opportunities and Choices Create Walkable Neighborhoods Encourage Community and Stakeholder Collaboration Foster Distinctive, Attractive Places with a Strong Sense of Place Make Development Decisions Predictable, Fair and Cost Effective Mix Land Uses Preserve Open Space, Farmland, Natural Beauty and Critical Environmental Areas Provide a Variety of Transportation Choices of Smart Growth Strengthen and Direct Development Towards Existing Communities Take Advantage of Compact Building Design

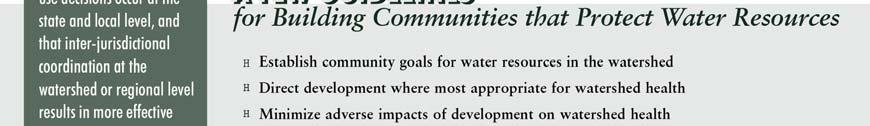
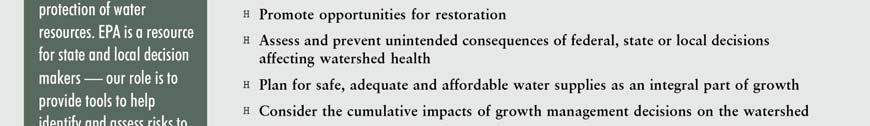
24 SG Principles For Protection of Water Resources Establish community goals for water resources in the watershed Direct development where most appropriate for watershed health Minimize adverse impacts of development to watershed health Promote opportunities for restoration Assess/prevent unintended consequences of federal/state/local programs affecting watershed health Plan for safe and adequate water supplies Promote evaluation of cumulative impacts to ensure that water quality and beneficial uses are not being adversely affected by growth Monitor/evaluate success of initiatives
25 Solutions? Regional approaches Site level strategies Integrated Planning and Design
26 Integrated Planning is Critical To Protect Water Resources - Protect drinking water quality and supply - Protect surface water quality and aquatic habitat, e.g., lakes, streams, wetlands, coastal waters - Manage runoff/storm water as a resource - Recharge groundwater aquifer - Reuse storm water - Identify hot spots for attention, e.g., CWA 303(d) impaired waters, drinking water aquifers, wetlands - Focus on managing cross-media inputs, e.g., atmospheric deposition - Restore degraded watersheds
27 Protect Water Supplies Plan for maximum future build-out Protect watershed catchments (forests) Develop watershed level water budget Water withdrawals (surface and groundwater) Ensure adequate groundwater recharge (replenish aquifers and ensure stream base flow)


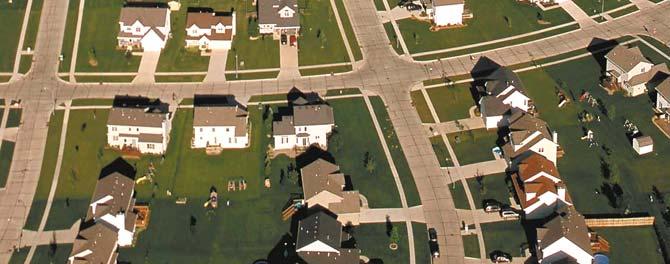
28 Low-density Development Pattern Smart Growth Development Pattern Two alternatives for future growth at a regional scale. The same number of people are accommodated in both scenarios.

29 Getting to Smart Growth Location/Brownfields Brownfields can help save natural lands from urbanization s sprawl by redeveloping existing aging urban infrastructure into new urban uses such as shops, commercial buildings and entertainment complexes. In this redeveloped Brownfield in Providence, Rhode Island, innovative engineering practices are used to detain and treat stormwater runoff onsite.
30 Characteristics of Sprawl Above ground utilities Sprawl Low Density Development Single use district No parking in rear Auto-oriented development Narrow Sidewalks WIDE STREETS Source:


31 Designing for Smart Growth High Density Development Street Trees TOD District Belowground utilities Mixed-Use (Residential and Commercial) Pedestrianfriendly area Median for light rail Bike Lanes Source:


32 The challenge is to make this function like this
33 Use Low Impact Development Strategies (LID) Definition: LID is a strategy to manage runoff that integrates land use planning, engineering, and storm water management designs to protect maintain and restore the ecological functions and health of watersheds. - The primary goal of LID is to preserve or restore the predevelopment hydrology of the watershed.
34 Potential Benefits of LID Provide urban habitat/ecosystem protection Reduce air and water pollution Reduce urban heat island impacts/energy consumption Reduce overall treatment costs Provides aesthetically pleasing amenities

35 Getting to Smart Growth - Street Design SEA Street, Seattle monitoring results for two years: 99% reduction in total runoff volume
36 Lid Designs Lot Level Source Controls Conservation Porous Pavement Rain Gardens Amended Soils Rain Barrel Narrower Streets Open Drainage Create a Hydrologically Functional Lot or Transportation System Photo By: Mark Bright (Ellwood Bluffs Vernal Pool Complex, Southern California)
37 Suggested Approaches Better coordination between MPOs and natural resource agencies Develop regional growth management plans (plan/manage on regional scale) Invest in improved data management systems e.g., GIS Invest in models (trends, options) Share data Invest in more comprehensive resource inventories, e.g., wetlands delineation Integrate more environmental considerations into local land use planning
38 Suggested Approaches Integrate plans: land use/air/water quality Adopt a multi-disciplinary effort Promote public participation, e.g., visioning exercises (scenario planning) Strive for multiple purpose outcomes Use water sensitive design Engage in early and frequent communication Conduct assessments -collect data/trend information
39 Design to Protect Water Resources Concentrate on infill development Select long-term solutions with regional benefits Avoid development in areas where preservation of natural systems difficult Use systems planning to preserve natural resources for the long-term Establish a carrying capacity metric to regionally protect water quality and quantity Provide a spine of rapid transit to anchor/force growth into density centers
40 Use a Holistic Approach Integrate transportation and land use planning Use a system approach to address multiple objectives, e.g., transportation systems economic and cultural concerns environmental protection Integrate planning with programming and project development Develop performance measures monitor and evaluate achievement of environmental and transportation goals
41 The Development of Good Watershed Plans Helps make managing water resources a more deliberate process Requires integrated thinking and a coordinated approach. The planning process must turn commitments into action. (NAS 1999) Were the only factor with high correlation to potential positive environmental outcomes (Trout Unlimited, Pacific Rivers Council, 1999)


42
43
44
45
46 Drivers Connecting Air to Water

47 Portions of Bay and Tidal Rivers listed as impaired waters under the CWA. Low Dissolved Oxygen Levels; Poor Water Clarity Algae Blooms Nutrient and Sediment Pollution Impaired Water
48 Making the Connections Between Air and Water


49 Primary Sources of NOx Mobile Area Electric Generating Units Industry


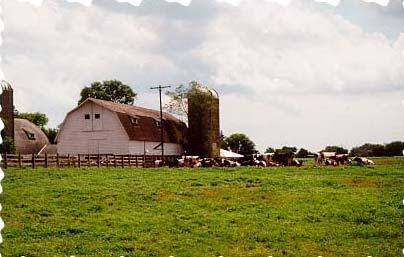
50 Primary Sources of Ammonia Confined Animal Operations Fertilizers Area Mobile
51 Atmospheric Transport & Transformation (measurements & models) (measurements Deposition Direct Load to Water Effects & models) Watershed Effects Watershed Transport Emissions (inventories) Indirect Load to Water (measurements & models)
52 Cross-Media Models of the Chesapeake Bay Regional Acid Deposition Model Regression Analysis Chesapeake Bay Watershed Model Chesapeake Bay Estuary Model Package Hydrodynamic Model of Bay and Coastal Ocean
53 Relative Contribution of Sources of Nitrogen Loads to the Bay Atmospheric Deposition to Tidal Water 7% Atmospheric Deposition to Non- Tidal Water 1% Manure 18% Atmospheric Deposition from Land 24% Chemical Fertilizer (Agriculture) 16% Septic 4% Point Source 21% Urban/MO Runoff (Non- Atmospheric) 9% ~305 million lbs. in 2000 (~98 million due to Air; 32% of inputs)
54 Atmospheric Nitrogen Deposition And Delivered Loads Atmospheric Deposition Delivered Load to the Bay from All Sources 450 Nitrogen Deposition (input) = NO3, NH4, Org N (million pounds TN per year) ~ 21 million lbs is direct deposition to Tidal Waters Of the total nitrogen load delivered to the Bay from all sources, about 98 million lbs. or 32% is attributable to atmospheric deposition Baseline


55 Air Deposition N Load to the Bay Model estimates N loads to the Bay based on many terrestrial processes. Average N deposition (2000) = 10.3 pounds/acre. For forest lands (~57% forest), model calculates 76% of N deposition is attenuated For impervious urban areas, WSM calculates 20% of N deposition is attenuated
56 Opportunities Improve Scientific Understanding: Better Assess Atmospheric Sources Improve emissions inventories; Improve transport models Focus on hotspots which requires more monitoring in urban and agricultural areas. Conduct collaborative research (cross- media, cross-disciplinary, cross- agency)
57 Opportunities Improve Communication & Technical Exchange: Develop policy options for reducing nitrogen pollution. Engage stakeholders in developing solutions to the problem. Communicate the issues to the public.