Texas Water Plan and Region C Water Plan. UTA Water Systems Design Class March 26, 2009
|
|
|
- Rosamund Harmon
- 5 years ago
- Views:
Transcription
1 Texas Water Plan and Region C Water Plan Tom Gooch Freese and Nichols UTA Water Systems Design Class March 26, 2009
2 Introduction Who Am I Tom Gooch tcg@freese.com 817/ Vice President, Freese and Nichols Hydrologist, water supply planner 30+ years experience Regional Water Planning for Metroplex
3 Introduction Thoughts Whiskey is for drinking; water is for fighting Water will flow uphill to money. Water, not oil, is the life blood of Texas - James A. Michener


4 Introduction Thoughts
5 Introduction Topics History Texas Water Development Board and Planning The Regional Water Planning Process The 2007 State Water Plan Region C Water Plan
6 Introduction Topics History Texas Water Development Board and Planning The Regional Water Planning Process The 2007 State Water Plan Region C Water Plan
7 History TWDB and Planning


8 History TWDB and Planning
9 History TWDB and Planning In Texas, planning is driven by drought Texas Water Development Board founded in 1957 ( drought) $200 million water development fund Formal planning process State plans from Austin in 1961, 1968, 1984, 1990, 1992, 1997 Early yplans emphasized reservoirs
10 Storage in Texas Reservoirs 45 servoirs (Millio on Acre-Feet) Storage in Re s Drought Year
11 History TWDB and Planning Early days Growing population Springs and reliable streams Reservoirs and wells Drought of 1950s More oereservoirs s Drought of 1990s Now Increased planning Need for timely new supplies
12 Introduction Topics History Texas Water Development Board and Planning The Regional Water Planning Process The 2007 State Water Plan Region C water plan
13 Regional Water Planning Process Senate Bill 1 - Tx. Legislature in 1997 Spurred by 1996 drought Population projected to double by 2060 Bottom up water planning process Texas Water Development Board Adopted rules Set out 16 regions Named initial planning group members
14 Regional Water Planning Areas
15 Regional Water Planning Process Local and regional decision-making Open to public Statutory interests: Public Counties Municipalities Industries Agriculture Environment Small business Electric generating utilities River authorities Water districts Water utilities
16 Regional Water Planning Process Role of Legislature Created process Provides funding Updates laws Role of Texas Water Development Board Creates rules and guidelines Oversees planning Approves plans Develops state plan
17 Regional Water Planning Process Role of Regional Water Planning Group Oversees planning for the region Approves plan for TWDB review Role of Consultant Provides technical information Provides recommendations to planning group Drafts plan for planning group approval
18 Regional Water Planning Process 50-year planning period Project population and water demand Existing supply Evaluate need for additional water Recommend strategies
19 Regional Water Planning Process A proposed project must address a need in a manner that is consistent with an approved Regional Water Plan to be considered for: TWDB funding TCEQ surface water right permit
20 Introduction Topics History Texas Water Development Board and Planning The Regional Water Planning Process The 2007 State Water Plan Region C Water Plan
21 2007 Texas State Water Plan
22 Palmer Drought Severity Index
23 Public Systems Hit by Drought
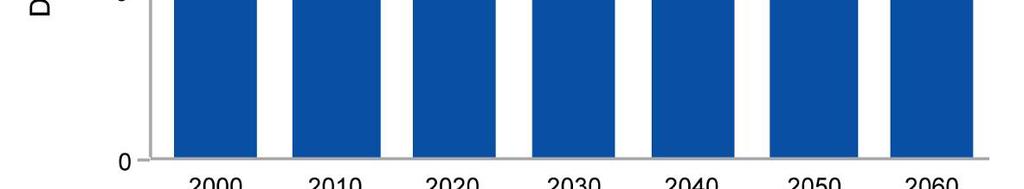
24 Historical and Projected Population Millions) Texa as Population ( Year Historical Projected


25 Population Growth Rate


26 Projected Demand

27 Projected Demand


28 Overview of Texas Water Supply Issues Year 2000 demand of 17 million acre-feet per year 24% municipal 14% industrial 62% agricultural Projected year 2060 demand of 22 million acre-feet per year 38% municipal 20% industrial 42% agricultural
29 Projected Supply


30 Supply Surface Water Surface Water Supplies (millions of acre-feet)


31 Supply Groundwater


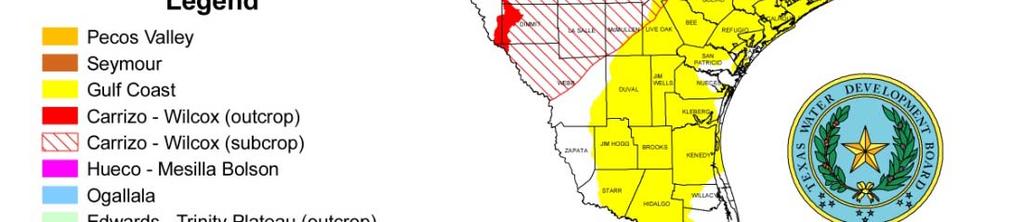
32 Major Aquifers
33 Historical Groundwater Level Declines Water level decline in feet less than 50 or undetermined 50 to to to to to to 800 greater than 800


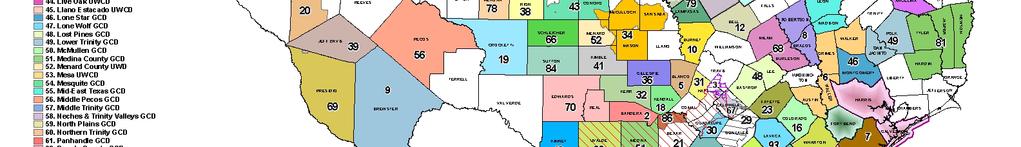
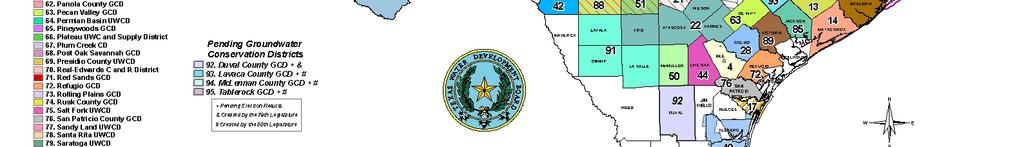
34 Groundwater Districts
35 Hydro Graph Ogallala Aquifer


36 Hydro Graph Edwards Aquifer
37 Needs Texas does not have enough water today to meet future demand d during times of drought
38 Water Supply Needs
39 Water User Groups
40 Cities - Cities: 956
41 Utilities - Cities: Utilities: 378
42 County-Others - Cities: Utilities: County-Others: 254
43 Manufacturing - Cities: Utilities: County-Others: Manufacturing: 174
44 Steam Electric - Cities: Utilities: County-Others: Manufacturing: Steam Electric: 83
45 Livestock - Cities: Utilities: County-Others: Manufacturing: Steam Electric: 83 - Livestock: 254
46 Mining - Cities: Utilities: County-Others: Manufacturing: Steam Electric: 83 - Livestock: Mining: 226
47 Irrigation - Cities: Utilities: County-Others: Manufacturing: Steam Electric: 83 - Livestock: Mining: Irrigation: 239
48 Total = 2,564 - Cities: Utilities: County-Others: Manufacturing: Steam Electric: 83 - Livestock: Mining: Irrigation: 239
49 Strategies Process Regions identified 4,500 strategies Evaluated strategies based on: Water quantity and reliability Financial costs Impacts to environment and agriculture Impacts to water quality Other factors such as regulatory requirements, time required to implement, etc.


50 Water Volume from Recommended Water Management Strategies
51 New Supplies 2007 State Water Plan in Acre-Feet/Year Desalination, 300,000 Conjunctive Use, 200,000 Municipal Conservation, 600,000 Groundwater, 800,000 Connect Surface Water, 3,300,000 New Reservoirs, 1,100,000 Reuse, 1,300, Irrigation Conservation, 1,400,000
52 Recommended Major and Minor Reservoirs
53 Costs Total capital costs : $30.7 billion
54 Costs of Not Implementing Plan Businesses and workers: $9.1 billion in 2010, $98.4 billion in 2060 Lost local and state taxes: $466 million in 2010, $5.4 billion in 2060 About 85 percent of the state s t population will not have enough water by 2060 in drought of record
55 Water Conservation Major emphasis in State Water Conservation Advisory Council In 2007 Water Plan Municipal Conservation 600,000 ac-ft/yr 47% Region C, 16% Region H Irrigation Conservation 1,400,000 ac-ft/yr 32% Region M, 24% O, 21% A, 10% K Implementation continues
56 Regional Water Planning Areas
57 Current Water Supply Issues Reuse Differing approaches to reuse Direct before return to stream easy to permit Indirect returned to stream and rediverted difficult to permit Important part of future water supply Should be encouraged Low environmental impact Low cost
58 Reuse in the 2006 Regional Plans Projected for 1.66 million acre-feet per year by 2060 Slight majority in Region C (Metroplex) Significant amounts in Regions D, H, K, and dl Some reuse in 14 of 16 regions
59 Year 2060 Reuse Supplies Region C 874,000 acre-feet per year Region H 197,000 acre-feet per year Region K 106, acre-feet per year Region D 80,000 acre-feet per year Region L 78,000 acre-feet per year Region E 71,000 acre-feet per year All others 250, acre-feet per year


60 Regional Water Planning Areas
61 Year 2060 Reuse Supplies IJ K L M N O P A B H G F E D C


62 Major Existing Interbasin Transfers in Texas


63 Major Proposed Interbasin Transfers in Texas G1 C1 G2 L1 C7 H2 C2 C8 C3 C4 C6 C9 H1 C5 N1 N2 N3 L2 N4 M1
64 Introduction Topics History Texas Water Development Board and Planning The Regional Water Planning Process The 2007 State Water Plan Region C Water Plan
65 Water Supply for the Metroplex Region C 16 county area Includes Dallas, Tarrant, Denton, Collin 1/4 of Texas population 1/12 of Texas water use 1/12 of Texas water use in 2000
66 Region C
67 Region C Water Supplies 90% is surface water 35 wholesale water providers and 351 water user groups 3 largest wholesale providers provide 75% ½ of the water used is returned as treated effluent Reuse could be a significant source of supply A small fraction is currently reclaimed and reused
68 Comparison of Currently Available Supplies and Projected Demands for Region C 3,500,000 3,000,000 Dem mand and Supply in Acre-Feet per Year 2,500,000 2,000,000 1,500,000 1,000, ,000 Reuse Groundwater Local Supplies Imports Region C Reservoirs Demand
69 Largest Region C Suppliers Dallas Supplies many other communities Current Supply Lakes Ray Roberts, Lewisville, Ray Hubbard and Tawakoni Planned supplies Conservation Reuse Existing Lakes Fork, Palestine, Wright Patman New Lake Fastrill
70 Dallas Planned Supplies Sup pply and Demand in Acre-Feet per Year 1,400,000 1,200,000 1,000, , , , ,000 Lake Fastrill Lake Wright Patman Lake Lewisville Indirect Reuse Connect Lake Palestine Lake Ray Hubbard Indirect Reuse Additional Direct Reuse Connect Lake Fork Contract for Return Flows Additional Dry Year Supply Conservation (DWU Current and Future Customer Cities) Conservation (DWU Retail) Direct Reuse (Cedar Crest GC) Lake Grapevine Lake Tawakoni Lake Ray Hubbard Decade Lake Ray Roberts/Lake Lewisville System Demands Total Currently Available Supplies
71 Largest Region C Suppliers Tarrant Regional Water District Supplies Fort Worth, Arlington, many others Current Supply Lakes Bridgeport, Eagle Mountain, Cedar Creek, Richland-Chambers Planned supplies Conservation Reuse Existing Toledo Bend Lake and Oklahoma supplies New Marvin Nichols Lake
72 TRWD s Planned Supplies 1,200,000 Oklahoma Water Sup pply and Demand in Acre-Feet per Year 1,000, , , , , Decade Toledo Bend Reservoir Marvin Nichols Reservoir Third Pipeline and Reuse Conservation Richland-Chambers Cedar Creek Lake Benbrook West Fork System Total Currently Available Supplies Projected Demands
73 Largest Region C Suppliers North Texas Municipal Water District Supplies communities north and east of Dallas Current Supply Lakes Lavon, Chapman, and Texoma and reuse Planned supplies Conservation Additional reuse Existing Toledo Bend, Texoma, Oklahoma water New Marvin Nichols and Lower Bois d Arc Lakes
74 NTMWD s Planned Supplies 1,200,000 Oklahoma Water Toledo Bend Phase 1 Sup ply and Demand in Acre-Feet per Year 1,000, , , , ,000 Marvin Nichols Reservoir Lower Bois d'arc Creek Reservoir New Lake Texoma Upper Sabine Basin Interim GTUA Supply Additional Lake Lavon Yield East Fork Reuse Wilson Creek Reuse (new) Interim DWU Supply Conservation Lake Bonham Wilson Creek Reuse (permitted) Lake Chapman Decade Lake Texoma Lk Lake Lavon Total Currently Available Supplies Projected Demands
75 Planned Supplies in the Region C Plan Current Surface water 29% Current rrentgroundwater 2% Conservation and Reuse 28% New Reservoirs 18% New Groundwater 0% Connect Existing Supplies 23%


76 Current Issues Water Conservation and Reuse North Texas often cited as water hogs High per capita municipal use Low per capita overall use Very little agricultural use Low per capita industrial use
77 Municipal Per Capita Water Use Municipal Per Capita Water Use (Year 2000) Per Capita Water Use (gpcd) 0 A J C F E G Total O K B N M I H L D P Region
78 Municipal Per Capita Water Use Municipal Per Capita Water Use (Year 2006) Per Capitaa Water Use 50 0 F N A K J C Texas G L O E M I D H B P Region
79 Total Per Capita Water Use Total Per Capita Water Use (Year 2000) ,000 8,908 4,876 4, Pe er Capita Water Use (gp pcd) O A P F E M K Total I D B G L J H N C Region
80 New Reservoirs Last major new reservoirs in area about 20 years ago Currently difficult to permit new reservoirs 4 major new reservoirs in Region C plan Compare to over 30 in last 50 years Sometimes least expensive and best option
81 Current Water Supply Issues Drought Projected Storage Trace Months after Dec 2005 Worst 1 Year (1956) Lowest 2-Year Inflow ( ) Lowest 3-Year Inflow ( ) Normal Year Top of Sediment Pool Top of Conservation
82 Closing Thoughts New supplies are needed Conservation is essential Reuse should be encouraged Environmental flow needs are an issue Interbasin transfers are essential Current state law burdensome Law needs revision
83 Closing Thoughts New reservoirs are also needed Current drought emphasizes importance of water supply Environmental issues continue to increase in importance in water supply development Public support is needed to move forward
84 Contact Info Tom Gooch - tcg@freese.com, 817/ Texas Water Development Board Web Site p Region C Web Site t