ANNOUNCEMENT REGARDING SPEAKER SLIPS
|
|
|
- May Merryl Webster
- 5 years ago
- Views:
Transcription

1 City of Calimesa Regular Meeting of the City Council AGENDA Monday, May 2, :00 p.m. Norton Younglove Multipurpose Senior Center 908 Park Avenue, Calimesa, CA Jeff Hewitt, Mayor Joyce McIntire, Mayor Pro Tem Bill Davis, Council Member Jim Hyatt, Council Member Ella Zanowic, Council Member Bonnie Johnson, City Manager Kevin Ennis, City Attorney In compliance with the Americans with Disabilities Act, if you need special assistance to participate in a City meeting or other services offered by this City, please contact the City Clerk s Office, (909) Notification of at least 48 hours prior to the meeting or time when services are needed will assist the City staff in assuring that reasonable arrangements can be made to provide accessibility to the meeting or service. Any public writings distributed by the City to at least a majority of the Council Members regarding any item on this regular meeting agenda will be made available at the public counter at City Hall located at 908 Park Avenue, Calimesa, CA ANNOUNCEMENT REGARDING SPEAKER SLIPS Anyone wishing to address the City Council either during Communications from the Public or on any item on the agenda should fill out a blue speaker slip and give that slip to the City Clerk prior to the item being heard. Please write the number of the agenda item or the subject of your presentation on the slip. Please observe a time limit of three (3) minutes when giving your presentation. When called upon, please step forward to the microphone, state your name for the record, whom you represent and any statement you wish to make. Please be advised that you may not defer your three (3) minutes to another speaker. CALL TO ORDER ROLL CALL: STAFF: MAYOR HEWITT, MAYOR PRO TEM MCINTIRE, COUNCIL MEMBER DAVIS, COUNCIL MEMBER HYATT, COUNCIL MEMBER ZANOWIC. CITY MANAGER JOHNSON, CITY ATTORNEY ENNIS, CITY CLERK GERDES, PUBLIC WORKS DIRECTOR FRENCH, COMMUNITY DEVELOPMENT DIRECTOR GARDNER, CITY ENGINEER THORNTON, FIRE CHIEF SMITH AND POLICE CHIEF BURCH. PLEDGE OF ALLEGIANCE PRESENTATIONS Proclamation May is Mental Health Month Riverside University Health System Behavioral Health COMMUNICATIONS FROM THE PUBLIC Anyone wishing to address the Council on any item within the Council s jurisdiction that is not on the agenda may do so at this time. This is not a time for City Council discussion of non-agenda items. After receiving public comments, Council Members or staff, after being recognized by the Mayor, may briefly respond to statements made by the public or questions posed by the public. In addition, Council Members may ask questions for clarification or make a referral to staff for factual information to be reported back to the Council at a later meeting. APPROVAL OF THE AGENDA RECOMMENDATION: Move to approve the agenda Motion Second Vote Regular Meeting of the Calimesa City Council May 2, 2016 Page 1 of 4 Page 1 of 146
2 CONSENT CALENDAR The following Consent Calendar items are expected to be routine and non-controversial. Council will act upon them at one time without discussion. Any Council Member or staff member may request removal of an item from the Consent Calendar for discussion. 1. APPROVAL OF CITY COUNCIL ACTION MINUTES. a) April 18, 2016 Regular City Council Meeting Action Minutes. 2. RECEIVE AND FILE CITY COMMISSION & BOARD MINUTES. a) There are no minutes ready for approval at this time. 3. APPROVAL OF WARRANT REGISTERS. a) Check Register Report with a total of $158, (Check Nos to 30015) b) April 21, 2016 Payroll of $23, WAIVE FULL READING OF ANY PROPOSED ORDINANCES ON THE AGENDA. This permits reading the title only in lieu of reciting the entire text of the Ordinances. This does not take policy action on the Ordinances or approve or disapprove any Ordinances on the agenda. 5. LETTER OF SUPPORT FOR RTA S SUBMITTAL OF A GRANT APPLICATION FOR THE FTA 5339(b) BUS AND BUS FACILITIES COMPETITIVE GRANT PROGRAM. RECOMMENDATION: That the City Council provide direction to staff regarding the draft letter to the Federal Transit Administration. 6. AWARD OF WEED ABATEMENT CONTRACT RECOMMENDATION: That the City Council award the Bid for the year 2016 Weed Abatement Season to Howards Weed Abatement and authorize the City Manager to execute the contract documents. 7. ADOPTION OF RESOLUTION NO , AUTHORIZING SUBMITTAL OF APPLICATIONS TO CALRECYCLE FOR GRANT FUNDING OF VARIOUS PROJECTS FOR WHICH THE CITY OF CALIMESA IS ELIGIBLE. RECOMMENDATION: That the City Council adopt Resolution No , A Resolution of the City Council of the City of Calimesa, California authorizing submittal of applications for grant funding for all CalRecycle grants which the City is eligible. 8. TREASURER S REPORT FOR THE QUARTER ENDED MARCH 31, RECOMMENDATION: That the City Council receive and file the Treasurer s report for the Quarter ended March 31, CHIEF OF POLICE COMMENTS & REPORTS FIRE CHIEF COMMENTS & REPORTS MAYOR & COUNCIL MEMBER REPORTING OF COUNTY & REGIONAL MEETINGS This is the time for comments, announcements and/or reports on meetings attended at public expense as required by AB Regular Meeting of the Calimesa City Council May 2, 2016 Page 2 of 4 Page 2 of 146
3 PUBLIC HEARINGS The order of business for the Public Hearing shall be: A. Open Public Hearing B. Staff Presentation C. Applicant/Representative Presentation D. Public Testimony E. Applicant Rebuttal (if necessary) F. Public Testimony Closed G. Close Public Hearing H. Council/Agency/Authority Discussion I. Council/Agency/Authority Motion and Vote Speakers are encouraged to be brief and remain within the established time limit of three (3) minutes per speaker. Once the public hearing has been closed, no further testimony will be taken. 9. CONTINUED PUBLIC HEARING: - ZONING TEXT AMENDMENT (ORDINANCE NO. 343) RECOMMENDATION: That the City Council review and discuss the options presented in this staff report as recommended by the Planning Commission, and then open the public hearing and take testimony on proposed Ordinance No. 343 (Zone Text Amendment 16-01), close the public hearing, deliberate, and take one of the following actions: 1. Planning Commission Recommendation. The Council should consider the results of the Planning Commission resolution regarding the proposed amendments to Ordinance No. 343 that includes the following: Revise the definition of sensitive receptor to exclude playgrounds, youth centers, and wildlife corridors. Require a minimum separation between a proposed warehouses and any sensitive receptor of 250 lineal feet. Set no minimum separation requirement between a proposed warehouse and any other warehouse, and establish the minimum separation requirement on a project-by-project. Exempt lots of four acres or less from maximum size and minimum separation requirements. Set no cap on the size of warehouses, and determine the maximum size on a project-by-project basis. 2. Take action on the Council direction from the January 19 th meeting regarding the following proposed amendments to Ordinance No. 343 (Attachment A): Require a minimum of 1,000 lineal feet separation between warehouse uses and sensitive receptors. Set the definition of sensitive receptors to mean all of the following uses: any residential use, school, daycare center (other than daycare facilities provided for the employees of any such facility), preschool, nursery school and other care facilities for children, playground, hospital, youth center, recreational facility, elderly, group or congregate care facility, and any wildlife corridor. Establish that the method to measure the minimum 1,000-foot separation between a warehouse use and a wildlife corridor is from the edge of the wildlife corridor closest to the project to the property line of the project. Establish a minimum separation of some distance between warehouse buildings on the same lot or parcel. When a warehouse use is proposed for a lot or parcel adjacent to an existing or proposed warehouse use on an adjacent lot or parcel, require a minimum separation of 250 feet between the properties. (This separation requirement is a staff recommendation and not something the Council specifically decided at its January 19 th meeting.) Exempt Parcels of four (4) acres of less from the separation and size limitations. Limit the maximum size of warehouses to 100,000, 250,000 or some other square foot size. 3. Take no action. BUSINESS ITEMS 10. REQUEST FOR FEE WAIVER PROPOSED OPEN MARKET RECOMMENDATION: That the City Council consider one of the following options: 1. Approve the request for fee waiver for the proposed City of the Rose Open Market. Total fee waiver is estimated at $6, Deny the request for fee waiver for the proposed City of the Rose Open Market. Regular Meeting of the Calimesa City Council May 2, 2016 Page 3 of 4 Page 3 of 146
4 11. CONSIDERATION OF COOPERATIVE AGREEMENT FOR THE COLLECTION OF FACILITY CAPACITY FEES BY AND BETWEEN SAN GORGONIO PASS WATER AGENCY AND THE CITY OF CALIMESA RECOMMENDATION: That the City Council discuss and consider possible action on one of the following: 1. Approve, in concept, the Cooperative Agreement for the Collection of Facility Capacity Fees by and between San Gorgonio Pass Water Agency (SGPWA) and the City of Calimesa. Authorize the City Attorney and City Manager to work with SGPWA to finalize the agreement. 2. Defer taking action on the Cooperative Agreement for the Collection of Facility Capacity Fees by and between San Gorgonio Pass Water Agency (SGPWA) and the City of Calimesa. Direct staff to continue working with all parties regarding a regional resolution on water supply. 3. Provide alternative direction to staff. 4. Take no action. COUNCIL MEMBERS COMMENTS & REPORTS This is the time for additional general comments, announcements, reports on meetings attended at public expense as required by AB 1234, requests of staff, and other issues of concern to Council Members may be presented briefly at this time. The Council may not legally take action on any item presented at this time other than to direct staff to investigate a complaint or place an item on a future agenda unless (1) by a majority vote, the Council determines that an emergency situation exists, as defined by Government Code or (2) by a four-fifths vote, the Council determines that there is a need for immediate action and the need for action arose subsequent to the agenda being posted as required by Government Code (b). CITY MANAGER COMMENTS & REPORTS CLOSED SESSION ITEMS A. CONFERENCE WITH LEGAL COUNSEL ANTICIPATED LITIGATION Significant Exposure to Litigation pursuant to paragraph (2) of subdivision (d) of Government Code Section Number of Cases: One (1) case B. CONFERENCE WITH LEGAL COUNSEL ANTICIPATED LITIGATION Potential Initiation of Litigation pursuant to paragraph (4) of subdivision (d) of Government Code Section Number of Cases: One (1) case ADJOURNMENT Adjourn to the Regular Meeting of the City Council on Monday, May 16, 2016 at 6:00 p.m. Regular Meeting of the Calimesa City Council May 2, 2016 Page 4 of 4 Page 4 of 146
5 Page 5 of 146
6 Page 6 of 146

7 Page 7 of 146

8 Page 8 of 146

9 Page 9 of 146

10 Page 10 of 146
11 Page 11 of 146

12 Page 12 of 146
13 Page 13 of 146
14 Page 14 of 146
15 Page 15 of 146
16 Page 16 of 146
17 Page 17 of 146
18 Page 18 of 146
19 Page 19 of 146

20 Page 20 of 146

21 Page 21 of 146

22 Page 22 of 146

23 Page 23 of 146

24 Page 24 of 146

25 Page 25 of 146

26 Page 26 of 146
27 Page 27 of 146

28 Page 28 of 146
29 Page 29 of 146

30 Page 30 of 146
31 Page 31 of 146
32 Page 32 of 146
33 Page 33 of 146
34 Page 34 of 146
35 Page 35 of 146
36 Page 36 of 146
37 STAFF REPORT CITY OF CALIMESA CITY COUNCIL MEETING Agenda Item No. 9 SUBJECT: PUBLIC HEARING: Zone Text Amendment (Ordinance No. 343) REQUEST: APPLICANT: LOCATION: GENERAL PLAN DESIGNATION: ZONING: Zone Text Amendment to Impose Size Limitations, Separation Requirements and Other Development Standards for Warehouse, Storage and Distribution facilities in the Industrial Zone Districts City-Initiated All Industrially Zoned Property, including the Business Park areas of the Summerwind Specific Plan Light Industrial and Business Park Light Industrial (L-I) and Business Park (B-P) MEETING DATE: May 2, 2016 PREPARED BY: Mark Teague, Senior Planner Kevin G. Ennis, City Attorney, and Amy Greyson, Assistant City Attorney RECOMMENDATION: It is respectfully requested that the City Council review and discuss the options presented in this staff report as recommended by the Planning Commission, and then open the public hearing and take testimony on proposed Ordinance No. 343 (Zone Text Amendment 16-01), close the public hearing, deliberate, and take one of the following actions: 1. Planning Commission Recommendation. The Council should consider the results of the Planning Commission resolution regarding the proposed amendments to Ordinance No. 343 that includes the following: Revise the definition of sensitive receptor to exclude playgrounds, youth centers, and wildlife corridors. Require a minimum separation between a proposed warehouses and any sensitive receptor of 250 lineal feet \ v1.doc Page 37 of 146
38 Zoning Text Amendment regarding Warehouses (cont.) City Council Meeting of May 2, 2016 Page 2 Set no minimum separation requirement between a proposed warehouse and any other warehouse, and establish the minimum separation requirement on a project-by-project. Exempt lots of four acres or less from maximum size and minimum separation requirements. Set no cap on the size of warehouses, and determine the maximum size on a project-by-project basis. 2. Take action on the Council direction from the January 19 th meeting regarding the following proposed amendments to Ordinance No. 343 (Attachment A): Require a minimum of 1,000 lineal feet separation between warehouse uses and sensitive receptors. Set the definition of sensitive receptors to mean all of the following uses: any residential use, school, daycare center (other than daycare facilities provided for the employees of any such facility), preschool, nursery school and other care facilities for children, playground, hospital, youth center, recreational facility, elderly, group or congregate care facility, and any wildlife corridor. Establish that the method to measure the minimum 1,000-foot separation between a warehouse use and a wildlife corridor is from the edge of the wildlife corridor closest to the project to the property line of the project. Establish a minimum separation of some distance between warehouse buildings on the same lot or parcel. When a warehouse use is proposed for a lot or parcel adjacent to an existing or proposed warehouse use on an adjacent lot or parcel, require a minimum separation of 250 feet between the properties. (This separation requirement is a staff recommendation and not something the Council specifically decided at its January 19 th meeting.) Exempt Parcels of four (4) acres of less from the separation and size limitations. Limit the maximum size of warehouses to 100,000, 250,000 or some other square foot size. 3. Take no action. Proposed Ordinance No. 343, included with this staff report as Attachment A, contains all these proposed amendments to the Zoning Code based on the Council s direction at the January 19 th meeting. PROJECT OVERVIEW: ZTA is a City-Council initiated proposal to amend Chapter 18.30, Industrial Zone Districts, of Title 18 of the Calimesa Municipal Code, pertaining to the development regulations applicable to warehouse, storage and distribution facility uses in the City of Calimesa, to prohibit warehouse, storage or distribution facilities greater than a certain size, and to establish additional development standards including a requirement for a minimum of 1,000 square feet between warehouse uses and sensitive receptors, as defined, and a minimum separation \ v1.doc Page 38 of 146
39 Zoning Text Amendment regarding Warehouses (cont.) City Council Meeting of May 2, 2016 Page 3 distance between a warehouse, storage or distribution facility and any other warehouse, storage and distribution facility. For ease of reference, in the remaining portions of this staff report, when the term warehouse is used, the term is meant to include warehouses, storage or distribution facility and not just warehouses. BACKGROUND: At the September 21, 2015, the City Council directed staff to initiate an amendment to the General Plan and Zoning Code to restrict warehouse types of uses in the City of Calimesa. On November 2, 2015, the City Council approved an amendment to the Zoning Code (Zoning Text Amendment 15-01) creating a special Council-approved Conditional Use Permit for any warehouse, warehouse distribution and transportation and trucking yards. This requirement took effect on December 2, 2015, and remains in place for all of the options discussed in this staff report. On January 19, 2016, the City Council directed staff to develop additional amendments to Chapter to prevent the development of very large warehouses (sometimes referred to as mega-warehouses ) and to further regulate the potential impacts of warehouse, storage and distribution facilities in the Light Industrial and Business Park zone districts, including but not limited to additional requirements relating to their size, distance from sensitive uses, and separation distance from each other, and to submit those proposed amendments to the Planning Commission for their review and recommendation. Planning Commission Review and Recommendation On March 14, 2016, the Planning Commission conducted a duly-noticed public hearing and considered proposed Ordinance No After public testimony and in response to the staff report, the following questions and issues were posed to the Commission. Listed below are the issues considered by the Commission and the Commission s policy direction on each of those issues. (Commission position is indicated in italics.) Issue (a) Whether the Commission agrees with the City Council that the required spacing (in feet) between sensitive receptors and warehouses should be 1,000 feet? The Planning Commission recommended that the minimum separation requirement between a proposed warehouse and a sensitive receptor be 250 feet. Issue (b) Whether the definition of sensitive receptor should include existing residential uses and land zoned for residential use (even if currently vacant)? \ v1.doc Page 39 of 146
40 Zoning Text Amendment regarding Warehouses (cont.) City Council Meeting of May 2, 2016 Page 4 The Planning Commission recommended that the definition of sensitive uses should exclude playgrounds and youth centers, but should include all existing residential uses and all land zoned for residential use even if currently vacant. Issue (c) Whether the Commission agrees with the City Council that the definition of sensitive receptor should include wildlife corridors? The Commission recommended that wildlife corridors be excluded from the definition of sensitive receptors. Issue (d) From what point in or along a wildlife corridor should the required spacing be measured (middle of corridor, nearest edge of corridor, etc.)? Since the Commission recommended that wildlife corridors be removed from the definition of sensitive receptors, they did not make any recommendation on this issue. Issue (e) Whether the spacing requirement from sensitive receptors should apply to all warehouse uses or only to warehouse uses above a certain size? (exempt lots less than 4 acres from the spacing requirement)? The Planning Commission recommended that lots less than 4 acres be exempt from any separation requirement, as well as any maximum size. Issue (f) What should be the methods to measure the minimum separation requirements between sensitive receptors and a proposed warehouse? The Planning Commission did not make any recommendation on this issue. Based on these answers to the issues, the Planning Commission adopted Resolution No which incorporated the following recommendations on each issue outlined above: Revise the definition of sensitive receptor to exclude playgrounds, youth centers, and wildlife corridors. Require a minimum separation between a proposed warehouses and any sensitive receptor of 250 lineal feet. No minimum separation requirement between a proposed warehouse and any other warehouse, and establish the minimum separation requirement on a project-by-project. Exempt lots of four acres or less from maximum size and minimum separation requirements. No cap on the size of warehouses, and determine the maximum size on a project-by-project basis. A copy of Resolution No , containing the Planning Commission recommendations, is included as Attachment B to this staff report \ v1.doc Page 40 of 146
41 Zoning Text Amendment regarding Warehouses (cont.) City Council Meeting of May 2, 2016 Page 5 DISCUSSION: (1) Mandatory Spacing from Existing or Proposed Sensitive Receptors For purposes of discussion a Sensitive Receptor is proposed to be defined as: Sensitive Receptor shall mean any residential use, school, daycare center (other than daycare facilities provided for the employees of any such facility), preschool, nursery school and other care facilities for children, playground, hospital, youth center, recreational facility, elderly, group or congregate care facility, and any wildlife corridor. The Planning Commission recommended that playgrounds, youth centers and wildlife corridors be excluded from the definition of a sensitive receptor. During the meeting the Commission discussed the potential for sports parks and open space to be located in setback areas and industrial parks. The definition prohibiting them would reduce the possibility of these types of land uses. The Commission also discussed that each project would be different and the City should have the flexibility to consider the project on its own merits. The Council previously discussed a mandatory spacing of 1,000 lineal feet from a warehouse use to sensitive receptors. 1 The Planning Commission recommended a minimum separation requirement of 250 feet. The Commission discussed the need to consider each project individually and base their decision on design and operational factors. Figures 1 and 2 show how the various separation requirements might affect both the Stearns property and the applicable property within the Summerwind Specific Plan. As shown in Figure 1, a separation requirement of 1,000 feet would prevent development of a warehouse on the Stearns property. Because the Summerwind Specific Plan is larger and has a variety of non-residential uses that could be developed in the setback area, Figure 2 shows that there is more available land to accommodate a warehouse. 1 This separation requirement would be different than a typical setback as defined by the Municipal Code. Ordinarily the setback would be measured from the property line to a building and the parcel would need to contain both the building and the setback. Under the typical setback definition, no building of any kind may be constructed within the setback. The proposed separation requirement would not preclude construction of another building or use within the separation area so long as it is not a warehouse use, and so long as that other use is allowed as a permitted or conditional use under the applicable zoning requirements and any Specific Plan \ v1.doc Page 41 of 146
 City Council Meeting of April 18, 2016 Page 6 Figure 1, Setbacks shown on Stearns Property")
42 Zoning Text Amendment regarding Warehouses (cont.) City Council Meeting of April 18, 2016 Page 6 Figure 1, Setbacks shown on Stearns Property \ v1.doc Page 42 of 146
 City Council Meeting of April 18, 2016 Page 7 Figure 2, Setbacks shown on Summerwind Specific")
43 Zoning Text Amendment regarding Warehouses (cont.) City Council Meeting of April 18, 2016 Page 7 Figure 2, Setbacks shown on Summerwind Specific Plan Area \ v1.doc Page 43 of 146
44 Zoning Text Amendment regarding Warehouses (cont.) City Council Meeting of April 18, 2016 Page 8 (2) Spacing between Warehouses on Same Lot or Adjacent Lot(s) An additional issue is on a large parcel of land, should there be minimum spacing between warehouse buildings so that if there is a limitation on warehouse building size, that limitation cannot be circumvented by crowding in multiple warehouse buildings all meeting the maximum size on the same lot or on adjoining lots, but cumulatively, the property contains the equivalent of one or more mega warehouses? Staff requested a recommendation from the Planning Commission whether there should be a minimum of 100, 250 or some other foot distance between each warehouse building on lots larger than four (4) acres. The Planning Commission recommended that the minimum separation requirement be established on a project-by-project basis. The Commission also recommended that lots smaller than four acres should be exempt from any such spacing requirement. The Commission did not provide any recommendation regarding the method to measure the separation requirement. Staff recommends that any required spacing between warehouse buildings located on the same lot be based on the distance between the outer walls of each warehouse building; and that any required spacing between warehouse buildings located on different lots be based on the distance of each warehouse building to the property lines of its lot. The distance between buildings will affect the number of warehouses that could be located on any parcel. During the Commission meeting, testimony was provided demonstrating a warehouse with loading docks on both sides of the building. The room to maneuver and park trucks and trailers was such that in the demonstration building there was approximately 200 feet between the building wall and the property line. The need to drive completely around the building and provide large truck access to each of the building doors establishes a large project footprint. If the warehouses were designed to operate independently, then it is reasonable to assume that each building would need its own maneuver and parking areas thereby making the spacing between the buildings a minimum of 400 feet. If the buildings were part of a larger project designed to function as a single entity, it is reasonable to assume the buildings would share access and usage of the maneuver and park area. Shared use of this area could lower the space between the buildings to between 250 and 300 feet. With these distance issues between warehouse buildings in mind, there are too many variables to determine how many buildings could be constructed on any given parcel. Parcel size, shape, topography, building shape, access and other restrictions that are both project design and site related all affect the calculations and potential buildings. Larger setbacks between buildings obviously result in fewer buildings on a given parcel. Assuming a square shaped 40 acre parcel of land (1,320 feet x 1,320 feet) and a maximum building of either 100,000 square feet (100 feet x 1,000 feet) or 250,000 square feet (250 feet x 1,000 feet) the table below shows how a warehouse to warehouse separation requirement of 250 and 300 feet would affect the number of warehouses on the parcel \ v1.doc Page 44 of 146
45 Zoning Text Amendment regarding Warehouses (cont.) City Council Meeting of May 2, 2016 Page 9 Setback # of Buildings 100,000 Max Building Size (sq. ft) # of Buildings 250,000 Max Building Size (sq. ft) , , ,000 75,000 68,000 51, , ,000 Note that the above analysis does not factor in the sensitive receptor setback, or any other design requirements such as landscaping, access, power lines, etc., that would affect the ability to build and building location on the site. The different building sizes are a result of an assumption that a developer would try to maximize the use of the land while complying with the setback requirements. (3) Limitation on Warehouses over a Certain Size At the January 19, 2016 City Council meeting, the City Council asked staff to bring the proposed Ordinance No. 343 to the Planning Commission for their review and recommendation on a size limitation for warehouses that would range between 100,000 and 250,000 square feet. (See Attachment C to this staff report) The Planning Commission recommended that no maximum cap on size be adopted and instead recommended that each application be considered on a project-by-project basis. For purposes of drafting the ordinance, the City Council should direct language to be included in Ordinance No. 343 on the following issues: (a) What size limitation on warehouses should be imposed? Should that limitation be 100,000 square feet, 250,000 square feet, some number in between, a sliding scale up to 100,000 or 250,000 square feet based on objective criteria, or some other number entirely? (b) Should lots and parcels four acres or less in size be exempt from the size limitation because with smaller lots, the size of the lot will effectively control the size of the warehouse that can be built on that lot? The draft ordinance attached to this staff report includes a placeholder for the Council to set the size limitation at 100,000 or 250,000 square feet or some other number. The ordinance also includes an exemption for parcels or lots of four acres or less. Additional Considerations At the Planning Commission meeting, Staff also requested input from the Commission whether design standards should be developed for warehouse, storage and distribution facilities. The Commission recommended that any design issues be addressed on a case-by-case basis. Design standards would apply to all the alternatives discussed in this staff report. The design standards could also address warehouse separation to avoid circumventing a limit by locating several warehouses on adjacent land \ v1.doc Page 45 of 146
46 Zoning Text Amendment regarding Warehouses (cont.) City Council Meeting of May 2, 2016 Page 10 Environmental Analysis Zone Text Amendment is considered a project pursuant to the California Environmental Quality Act (CEQA) and the State CEQA Guidelines (14 CCR Â et seq.). The project is considered exempt from CEQA pursuant to CEQA Guidelines Section 15061(b)(3) because the project is covered by the general rule that CEQA applies only to projects, which have the potential for causing a significant effect on the environment. The project only modifies certain language within the Zoning Code to add additional restrictions on the development of warehouse, storage and distribution facilities, prohibits mega-warehouses, and modifies some of the development standards to minimize potential adverse impacts on the surrounding community. Any future project will be required to undergo an environmental assessment for any potential impacts. Therefore, the project of and by itself does not result in any physical changes in the environment. FISCAL IMPACT: The proposed change in zoning would increase the cost of application for private development in the City. However, the City requires deposits to cover the cost of processing most development applications resulting in no impact to the General Fund. ATTACHMENTS: Attachment A: Attachment B: Proposed Ordinance No. 343, an Ordinance Imposing Size Limitations, Separation Requirements and Other Development Standards for Warehouse, Storage and Distribution facilities in the Industrial Zone Districts and Amending Title 18 of the Calimesa Municipal Code, and Making Environmental Findings in Support Thereof (Zone Text Amendment 16-01) Planning Commission Resolution No , A Resolution of the Planning Commission of the City of Calimesa Recommending that the City Council adopt an Ordinance to Impose Size Limitations, Separation Requirements and Other Development Standards for Warehouse, Storage and Distribution facilities in the Industrial Zone Districts and Amending Title 18 of the Calimesa Municipal Code, and Making Environmental Findings in Support Thereof (Zone Text Amendment 16-01), and including Exhibit A, proposed Ordinance No \ v1.doc Page 46 of 146

47 Page 47 of 146

48 Page 48 of 146

49 Page 49 of 146

50 Page 50 of 146
51 Page 51 of 146
52 Page 52 of 146

53 Page 53 of 146

54 Page 54 of 146
55 Page 55 of 146

56 Page 56 of 146

57 Page 57 of 146

58 Page 58 of 146

59 Page 59 of 146
60 Page 60 of 146

61 Page 61 of 146
62 Page 62 of 146
63 Page 63 of 146
64 Page 64 of 146
65 Page 65 of 146
66 Page 66 of 146

67 Page 67 of 146

68 Page 68 of 146

69 Page 69 of 146
70 Page 70 of 146
71 Page 71 of 146
72 DAVID TAUSSIG & Associates, Inc. CAPACITY FEE STUDY FOR SAN GORGONIO PASS WATER AGENCY JULY 21, 2015 Public Finance Facilities Planning Urban Economics Newport Beach Riverside San Francisco Chicago Page 72 of 146
73 CAPACITY FEE STUDY FOR SAN GORGONIO PASS WATER AGENCY JULY 21, 2015 Prepared for SAN GORGONIO PASS WATER AGENCY 1210 Beaumont Avenue Beaumont, California (951) Prepared by DAVID TAUSSIG & ASSOCIATES, INC Birch Street, Suite 6000 Newport Beach, California (949) Page 73 of 146
74 Table of Contents Executive Summary... i I. Background... 1 II. Introduction to Analysis... 2 III. Definitions... 5 IV. Demographics Existing Number of Residential Units and Non-Residential Square Footage Future Residential and Non-Residential Development... 9 V. Facility Component of the Facility Capacity Fee Facility Costs Methodology Facility Fee Structure VI. Water Component of the Facility Capacity Fee Appendix A Demographic Background Appendix B Facility Costs Letter to Jeff Davis from Webb Associates, July 17, 2015 Appendix C Section 1 of Implementation Plan For Capacity Fee, Webb Associates, October 2010 Appendix D Updated Water Rights Appraisal Memo from Water Consultancy, July 20, 2014 Page 74 of 146
75 Executive Summary The San Gorgonio Pass Water Agency ( SGPWA or Agency ) is a State Water Project ( SWP ) contractor located in the northwest portion of Riverside County east of San Bernardino, California. The mission of SGPWA "is to import supplemental water and to protect and enhance local water supplies for use by present and future water users and to sell imported water to retail water distributors within the service areas of the SGPWA service area." 1 The SGPWA provides, or can potentially provide, wholesale water service within its boundaries to and including the City of Banning, the Beaumont-Cherry Valley Water District, Cabazon Water District, South Mesa Water Company, Banning Heights Mutual Water Company, High Valleys Water District, Mission Springs Water District, and Yucaipa Valley Water District. To provide capacity in SGPWA's system, sufficient water supply and levels of service to existing and future development over the next twenty years consistent with the mission of the Agency, SGPWA will need to invest at least $12.6M in infrastructure during this period. This infrastructure will include a basin recharge facility and the purchase of additional capacity in existing pipelines that convey SWP water along the route from the SWP turnout at Devil Canyon to the SGPWA service area. Also, due to uncertainties related to the quantity of SWP allotments year to year, SGPWA will need to purchase additional water rights outside of the SWP contract. The current price of additional water rights is estimated at $6,200 per acre-ft and will be purchased on an asneeded basis. To ensure that new development pays its fair share of these costs, SGPWA will implement a facility capacity fee as authorized by SGPWA Law (Water Code App ) and consistent with California Government Code Section 66013, which requires that the capacity fee shall not exceed the estimated reasonable cost of providing the service for which the fee or charge is imposed. In 2011 a nexus study was prepared that proposed the implementation of a Facility Capacity Fee to be imposed on new development. The SGPWA board approved the nexus study, however the fee was not adopted at that time. This nexus study is a new and independent evaluation of (1) current demographics; (2) reconciliation of various local demographic estimates; (3) assessment of facilities and water supplies needed to serve new and expanded development; (4) and the allocation of costs reflecting current demographics and current cost estimates of facilities; and (5) calculation of new fee schedules. The proposed capacity fee has two components: the Facility Fee, and the Water Capacity Fee. The Facility Fee will fund a portion of the new infrastructure and the Water Capacity Fee will fund a portion of the purchase of new water rights and/or entitlements. The future capital projects are evaluated on a project-by-project basis to determine the costs that should be allocated to future development. Based on this approach, projects that are required to only meet the needs of future development are allocated 100% to such development. Projects that benefit both existing demands and future development are allocated to both existing demands and future development proportionally according to appropriate factors. 1 The SGPWA Mission Statement as indicated in the Agency's website Page 75 of 146
76 The Table below shows the proposed fee per residential dwelling unit that represents the reasonable fair share contribution of new residential development to the cost of the required infrastructure. Residential Facilty Fee Land Use Facility Element ($ unit ) Admin Element ($ per Unit) Total Facility Fee per DU Single Family $ $ 0.86 $ Multi-Family $ $ 0.42 $ The fees for the non-residential uses (commercial/retail and industrial) are determined in a similar manner. Because water demand from commercial/retail and industrial uses varies widely with building uses, meter size is a reasonable indicator of water demand and basis for allocation. The allocations to non-residential uses in the 2011 Study used building size and water use factors to allocate costs based on equivalent dwelling units ("EDUs"). This Study converts the non-residential allocations to meter size, using a 5/8 inch meter (typical of a single family residence) as the baseline, whose demand is equivalent to a single family dwelling unit, or one (1) EDU. The Table below shows the proposed fee structure that represents the reasonable fair share contribution of new non-residential development to the cost of the required infrastructure. Non-Residential Facilty Fee Meter Size Facility Element Admin Element Total Facility Fee 5/8" $ $ 0.86 $ /4" $ $ 0.94 $ " $ $ 1.20 $ /2" $ $ 1.54 $ " $ $ 2.48 $ " $ 1, $ 9.41 $ 1, " $ 2, $ $ 2, " $ 3, $ $ 3, " $ 4, $ $ 4, Finally, to maintain reliability for the benefit of future development, SGPWA will need to purchase additional water rights and entitlements outside of its SWP contract. The Table below shows the recommended fee charged to new development to fund the purchase of new water rights and entitlements over the twenty-year period. Page 76 of 146
77 Water Capacity Fee Item units Fee Fee for New Water Rights and Entitlements $ per ac-ft $ 6, Administrative Overhead $ per ac-ft $ Total $ 6, Please note that the above tables represent the maximum fee that the board can adopt and impose on new development, based on the cost of facilities and water rights or entitlements planned to be constructed or acquired prior to 2035 and identified in this Study. Also, it is recommended that SGPWA review these fee structures periodically to adjust for changes in demographics, water demands, and facility requirements, as well as adjustments for inflation. Based on the above fee structures, a typical single family house would pay a Facility Fee of $170.89, and using an average water use factor of acre-feet per year, that same single family house would be subject to a water capacity fee of $3, ($6, per acre-feet per year x 0.548), for a total of $3, Page 77 of 146
78 I. Background In 1961 SGPWA was formed pursuant to Chapter 101 of the California Water Code Appendix as a result of the approval by the voters of the Burns-Porter Act, which authorized the financing and construction of the SWP. SGPWA entered into a contract with the Department of Water Resources ( DWR ) in 1962 for Table A Water capacity in the SWP, which is currently 17,300 acre-ft per year ( AFY ), to bring supplemental water to the SGPWA service area. The SWP system originates at Oroville Reservoir in Northern California and water is delivered through a series of dams, pipelines, rivers, Sacramento Delta canals, sloughs, reservoirs and pumping stations to the SGPWA turnout at Devil Canyon in San Bernardino County. From that point it is delivered by pipeline, pump stations and reservoir to the SGPWA SWP terminus at Cherry Valley, in Northern Riverside County. The primary source of local water supply to the SGPWA service area at the present time is natural surface runoff and groundwater basins. The major groundwater basin is the Beaumont Storage Unit ( BSU ), which serves the City of Beaumont and the community of Cherry Valley through the Beaumont-Cherry Valley Water District ( BCVWD ), the City of Calimesa through the Yucaipa Valley Water District ( YVWD ), the City of Banning and the South Mesa Water Company ( SMWC ). The BSU was determined by the Riverside Superior Court in 2004 to be in overdraft and a Watermaster was appointed to manage the BSU through controlled overdraft (temporary surplus) through The BSU is now required to operate in a balanced condition, replacing an amount of water equal to the amount removed from the basin to meet local demands, over time. The Beaumont Basin Adjudication is an official document of the State of California, on file with the Riverside County Superior Court as Case No. RIC , and on file with SGPWA. Increased demand from new development and decreasing reliability of imported water supplies will continue to exert pressure on the ability of SGPWA to deliver supplemental water on a reliable basis. Adjudication of the BSU, requiring a balanced operating condition, will also exert pressure on the SGPWA to find additional reliable sources of water to meet increasing demands. Revenue from the proposed Facility Capacity Fee program is necessary to provide reliable water service to new development by helping fund new capacity in delivery pipelines, new recharge basins, related land acquisitions and the purchase of new water rights and entitlements. These investments are necessary to continue to provide an adequate level of service and reliability to retail agencies over time. No revenues from this Facility Capacity Fee program will be used to fund the correction of existing deficiencies in the system. 2 See also, San Gorgonio Pass Water Agency Report on Water Conditions (Reporting Period 2013), dated December Page 78 of 146
79 II. Introduction to Analysis The San Gorgonio Pass Water Agency ( SGPWA or Agency ), a State Water Project ( SWP ) Contractor, authorized David Taussig & Associates, Inc. ( DTA ) to prepare a nexus study ("Study") for proposed Facility Capacity Fees that the appropriate retail water agencies and/or land use planning agencies would collect from new development on behalf of SGPWA. These fees will provide a source of revenue for SGPWA needed to mitigate the regional water related impacts of such new development. California Government Code et seq ("Mitigation Fee Act") governs the imposition by a local agency of a fee or charge to a development project for "...the purpose of defraying all or a portion of the cost of public facilities related to the development project...". California Government Code 66013(b)(3) further defines a Capacity Charge as "... charges for new public facilities to be acquired or constructed in the future that are of proportional benefit to the person or property being charged.'' New public facilities are further defined in Section as "facilities for the storage, treatment and distribution of non-agricultural water." California Water Code authorizes SGPWA to impose a Facility Capacity Fee, which is in the nature of a connection fee, for the right to make a new retail connection to the water distribution system of any retail water distributor that is located within the boundaries of the SGPWA and that obtains all or any portion of its water supplies from SGPWA. For the purposes of this Study, the term "Facility Capacity Fee" shall mean Capacity Charge as defined in the Mitigation Fee Act. The Facility Capacity Fee is imposed and authorized in California Water Code and will meet the requirements of California Government Code Section 66013, and will achieve the following goals related to said Section: Ensure that the Facility Capacity Fee does not exceed the estimated reasonable cost of providing the service for which the fee is imposed; and Provide a clear and concise document that will serve as the basis for the proposed fee levels. The Board of Directors of SGPWA may contract with the counties in which SGPWA is located, and cities and retail water distributors located within the boundaries of SGPWA, for the collection of the Facility Capacity Fees subject to certain conditions. SGPWA water made available through facilities built, and/or water rights acquired, with capacity fee revenue will be sold to retail water distributors who in turn serve SGPWA water to new and expanded water users. This Study and the resulting fee structure will focus on the use of the SGPWA Facility Capacity Fee to fund (1) the purchase of capacity in existing pipeline systems owned by other public agencies; (2) an additional basin recharge project for underground water storage in the Beaumont groundwater basin, including land purchases associated with such basin facility; and (3) the purchase of new water and/or water rights and entitlements to meet future water demand. The underlying principle that supports the identification and allocation of costs to new development for these facilities and new water rights or entitlements is that new development throughout the SGPWA service will have access to additional water delivery capacity, additional storage capacity Page 79 of 146
80 and additional water rights and entitlements necessary to meet the demands of future development. This is more fully discussed in Section V, "Facility Component of the Facility Capacity Fee." The Facility Capacity Fee will consist of two components: the Facility Component of the Facility Capacity Fee ( Facility Fee ). This component will fund the facilities identified in items (1) and (2) above; and the Water Component of the Facility Capacity Fee ( Water Capacity Fee ). This component will fund the purchase of new water and/or water rights or entitlements, as identified in item (3) above. The Facility Fee will be charged to all new development within the SGPWA service area (except the Morongo Tribal Land as discussed in Section IV, Demographics ) and is designed to fund the cost of facilities needed to mitigate the cost of facilities needed to meet the additional demands of such new development through the year The steps followed in calculating the Facility Fee component include: Demographic Assumptions: Identify future development through 2035 that represents the increased demand for facilities. The demographic assumptions are discussed in Section IV, Demographics. Facility Needs and Costs: List the public facilities that can be clearly identified and have a reasonably accurate estimate of costs, that best mitigate the demands of new development through The needs list and estimate of costs are presented in Section V.1, Facility Costs. Cost Allocation: Allocate costs between new and existing residential and non-residential development based on estimated percentage utilization factors related to a proposed conjunctive use facility and additional capacity in the East Branch Extension ("EBX" pipeline system owned by other public agencies). Further allocate costs between single family and multi-family land use by equivalent dwelling unit ( EDU ) methodology, and between non-residential buildings by meter sizes. A detailed discussion of the cost allocation methodology is included in Section V.2, Methodology. Fee Schedule: Calculate the fee per residential unit or per non-residential meter size based on weighted average water usage factors, providing a uniform fee structure for the SGPWA service area. The resulting Facility Fee component structure is presented in Section V.3 Fee Structure. The Water Capacity Fee will be charged to new development based upon the amount of new water capacity needed to serve such development. The steps to calculate the Water Capacity Fee is discussed in Section VI, Water Component of the Facility Capacity Fee. It is important to note that all new development will be required to pay the Facility Fee and the Water Capacity Fee. While the Facility Fee is a fixed amount, depending upon land use, the Water Capacity Fee will be calculated based on expected water demands on a project by project basis. This revenue is required for SGPWA to build the proposed facilities and purchase the necessary Page 80 of 146
81 water rights and entitlements discussed herein that are needed to provide reliable water deliveries to water retailers. It is expected that the SGPWA will review both the Facility Fee and the Water Capacity Fee at reasonable intervals to incorporate changes in prices, facility requirements, water demands and demographics in order to ensure that the Facility Capacity Fees are allocated fairly and continue to generate sufficient revenues. The Facility Capacity Fee program will work in conjunction with SGPWA s other sources of revenue to play a part in a coordinated financing plan that provides a balance of rates and charges needed to fund current and future costs of service. For instance, the current commodity rate structure the amount charged for actual water deliveries includes an allocation to partially fund the purchase of new water rights and entitlements needed to enhance the reliability of water deliveries for existing development. Thus the commodity rates will work in conjunction with Water Capacity Fee revenues and other general fund revenue to fund the purchase of new water rights and entitlements over time that are needed to provide an ongoing reliable water source for both new and existing development. Page 81 of 146
82 III. Definitions The following key defined terms are used throughout this Study: Acre-foot ( AF ) a volumetric unit of measurement commonly used for water supply purposes. It is the amount of water required to cover one acre of land one foot deep, one acre being equal to 43,560 square feet. For illustrative purposes, it is the amount of water required to cover a football playing field, including end zones, 9 inches deep. AFY Acre-feet per year. A unit of measurement commonly used for large scale water supply purposes to represent flow, or volume of water over a period of time. BSU - the Beaumont Storage Unit, an adjudicated groundwater basin underlying a portion of the SGPWA service area. Build Out or Build Out Condition The state of development within the SGPWA service area in which there are no longer any undeveloped parcels or lots identified as residential or non residential uses on approved local land use plans from which capacity fees can be collected. Conjunctive Use is the interactive use of SWP supplemental water and local groundwater for water deliveries. The recharge of groundwater basins with SWP and local surface water during years of surplus and the pumping of stored groundwater to augment SWP allocations during years of deficit assist SGPWA in providing water deliveries on a reliable basis. cfs - cubic feet per second, a measure of volumetric rate of water conveyance DTA David Taussig & Associates, Inc., the public finance consulting firm that prepared the 2011 Capacity Fee Study and this current Capacity Fee Study. DWR - State of California ( State ) Department of Water Resources, the agency that contracts on behalf of the State with SGPWA to deliver water through the SWP under the terms of Contract Between the State of California Department of Water Resources and San Gorgonio Pass Water Agency, For Water Supply. EDU Factor the ratio of the water demand for a unit of a given land use to the baseline water demand for a single family residential unit. Equivalent Dwelling Unit ( EDU ) for given land uses, a method of comparison of that land use to a baseline land use, using a common demand variable. A demand variable is a measurable factor that is directly related to the required size or extent of a public facility. For the purposes of this Study the demand variable used is water demand, in gallons per day or acre-feet per year ( AFY ), and the baseline demand is that of a single family residential unit, which is the assumed baseline land use. For non-residential uses costs are allocated by meter size. A 5/8" meter is assumed as the baseline, equivalent in demand to a single family unit. Page 82 of 146
83 Existing Development - residential and non-residential land use improvements that exist as of June, 2014, within the SGPWA service area. The sources of data used to quantify the extent of such improvement includes local agency permit activity and studies, local UWMPs and County of Riverside demographic data. Facility Capacity Fee a charge imposed by a local water agency on new development, or increased usage (such as remodels or expansions), to fund or to recover the estimated reasonable cost of providing water, water conveyance or water storage facilities to the person or property being charged. For purposes of this Study the Facility Capacity Fee consists of two components: the facility component ( Facility Component of the Facility Capacity Fee or Facility Fee ) and the water component ( Water Component of the Facility Capacity Fee or Water Capacity Fee ). Facility Component of the Facility Capacity Fee for the purposes of this Study and hereafter referred to as the Facility Fee, is a facility capacity fee imposed on new development to pay that development s fair share of the costs to construct water storage and conveyance facilities that benefit such development. Floor Area Ratio ( FAR ) is the ratio of useable non-residential building square feet to the area, in square feet, of the property within whose boundaries the building is located. For the purposes of this Study a FAR of 0.40 for commercial/retail uses and an FAR of 0.20 for industrial uses was assumed, these ratios being common industry norms and generally accepted where site specific local investigations related to non-residential densities do not exist. Future Development - projected residential and non-residential land use improvements within the SGPWA service area anticipated to occur by the year The sources of data used to quantify the extent of such improvement includes local agency demographic projections, local UWMPs and County of Riverside demographic studies. KSF the unit of measurement used for non residential building size equal to one thousand square feet. SBVMWD - San Bernardino Valley Municipal Water District State Water Project ( SWP ) the system of dams, reservoirs, channels, pipelines, pumping stations, delivery structures and all other conveyance systems whose purpose is to convey and deliver water from the Sacramento-San Joaquin Delta to the various water contractors, including SGPWA. Specific to SGPWA such deliveries are in accordance with the terms of Contract Between the State of California Department of Water Resources and San Gorgonio Pass Water Agency, For Water Supply. Table A Water - The total annual amount of SWP water, entitled by DWR to SGPWA under the terms of Contract Between the State of California Department of Water Resources and San Gorgonio Pass Water Agency, For Water Supply, Amendment No. 18 dated December 26, Table A of that contract, as amended by Amendment No. 18, indicates that the current maximum annual entitlement to SGPWA is 17,300 Acre-feet. UWMP is an Urban Water Management Plan. California Water Code et. seq. directs certain water agencies to carry out long term planning to ensure that adequate water supplies are Page 83 of 146
84 available to both existing demand and new development. Agencies that are required by this code to produce this plan must document its long-term planning effort in an Urban Water Management Plan. This planning document is required to be updated every five years. Water Component of the Facility Capacity Fee - for the purposes of this Study and hereafter referred to as the Water Capacity Fee, is a facility capacity fee imposed on new development to pay that development s fair share of the costs to purchase new water or new water rights or entitlements necessary to meet future water demands and ensure acceptable levels of reliability with regard to the ability of the servicing agency or special district to deliver water in the future. Water Use Factor ( WUF ) a measure of average water demand for a given land use within a given area, expressed as Acre-feet per year per acre (AFY/acre) Study a capacity fee nexus study prepared by David Taussig & Associates, Inc. for SGPWA in This study was adopted by SGPWA but not implemented. The demographic analysis for existing residential units and non-residential building square feet in the 2011 Study is used in this Study as the baseline demographics for Existing Development through Page 84 of 146
85 IV. Demographics The SGPWA boundary includes the areas within the Cities of Banning, Beaumont, and Calimesa, the communities of Cabazon, Cherry Valley, Poppet Flat, the Morongo Indian Reservation, and other portions of the unincorporated area of Riverside County ( County ). A small area of undeveloped land within the service area at the headwaters of the San Gorgonio River extends into San Bernardino County. At the eastern edge of the SGPWA the Mission Springs Water District straddles the boundary line, serving a portion of the community of Verbania. Water is provided or is planned to be provided to retail customers by various retail water agencies, including the City of Banning, Beaumont Cherry Valley Water District, Cabazon Water District, South Mesa Water Company, Banning Heights Mutual Water Company, High Valleys Water District, Mission Springs Water District, and Yucaipa Valley Water District. As noted in this Study, certain of these agencies will require additional water deliveries and the facilities to convey that water sooner while other agencies may not require additional water and facilities until after the planning period used in this Study. Note that, for purposes of this Study, any property designated as Morongo Tribal Land has been excluded from our analysis because the Morongo Band of Mission Indians is a sovereign nation. Property within the Morongo Tribal lands will not be subject to either component of the Facility Capacity Fee. Therefore, the demographic analysis as described below reflects the property located within the three cities mentioned above and the unincorporated area of Riverside County excluding the Morongo Tribal Land. For purposes of this Study David Taussig & Associates, Inc. ( DTA ) categorized developed residential land uses as Single Family Residential and Multi-Family Residential units. Single Family Residential units include detached and attached residential units, while Multi-Family Residential units include those units with two or more living units on one Assessor s parcel as well as mobile homes. Non-residential land uses are categorized as Commercial/Retail or Industrial. Because it is difficult to assign a specific year in the distant future in which the Build Out state (as identified by the various local agencies) is realized, the year 2035 was determined to present a reasonable horizon to achieve funding and construction goals. This planning horizon is also consistent with 2035 horizons identified in county and local city studies and local water district UWMPs. 1. Existing Number of Residential Units and Non-Residential Square Footage The estimate of the number of current residential units and non residential square feet in the Cities of Beaumont, Banning, and the unincorporated areas emanate from the 2011 Study and are used as a baseline level of development (see Appendix A). The numbers for residential units and nonresidential square footage in the 2011 Study represented existing development through DTA then added to the 2009 baseline numbers the number of residential units and non-residential square footage indicated by building permits issued, not necessarily constructed, within the three cities and the unincorporated area for the years 2010 to mid 2014 to establish the present baseline. The permit data was provided by the respective planning departments. The City of Calimesa provided existing land use data as of year 2014 and projected land use data at build out conditions. Page 85 of 146
86 A detailed discussion of the demographic assumptions and methods used to determine the increase in development from 2009 to mid 2014 can be found in Appendix A of this Study. The estimated existing residential units by jurisdiction and by single family and multi-family land uses are shown in Table 1 below: Residential Land use TABLE 1 Existing Residential Units Through June City of Banning City of Beaumont City of Calimesa Unincorporated Area Total Existing Residential Units Single Family 9,900 12,700 2,200 6,200 31,000 Multi-Family 2,300 1,500 1,500 1,400 6,600 Totals 12,200 14,200 3,700 7,600 37, Rounded to the nearest 100 units The estimated existing non-residential building square feet, rounded to the nearest 1,000, by jurisdiction and by Commercial/Retail and Industrial land uses is shown in Table 2 below: Non-Residential Land use TABLE 2 Existing Non-Residential Square Feet Through June City of Banning City of Beaumont City of Calimesa Unincorporated Area Total Existing Non Residential Square Feet Comercial/Retail 4,536,000 3,639,000 1,482,000 3,780,000 13,437,000 Industrial 4,231,000 1,982, ,000 60,000 6,685,000 Totals 8,767,000 5,621,000 1,894,000 3,840,000 20,122, Rounded to the nearest 1,000 square feet 2. Future Residential and Non-Residential Development Although projections for Build-Out conditions can be found in studies by various other sources, it was felt that the year 2035 is consistent with local studies and provides a period from which a reasonable prediction of new development growth may be estimated. This quantified estimate of growth may then be used to allocate the cost of facilities that SGPWA staff has determined are needed at this time to mitigate the impacts of current and future demands. There are several sources that project future residential and non-residential demographics for various horizons within SGPWA boundaries, including housing elements from City General Plans, Urban Water Management Plans ( UWMP ) and development projections from interested agencies such as the Southern California Association of Governments ( SCAG ). Differing development trends unique to jurisdictional areas within the Agency boundary suggest that the local retail water agencies UWMP projections or projections from independent studies might be the most in tune with actual development trends within their purview. Specifically, the growth projections for the Cities of Beaumont and Banning Page 86 of 146
87 were taken from the Beaumont Cherry Valley Water District UWMP and the City of Banning UWMP, respectively; however the City of Calimesa provided current growth projections based on its own independent study. Development projections for unincorporated areas within the Agency are more difficult to determine using local UWMP s as a source. Some retail water districts include unincorporated areas within their boundaries. Those areas may or may not be within the Agency. Also, there are unincorporated areas within the SGPWA that are not covered by a local UWMP. For this reason the County of Riverside was contracted to provide a special study, or addendum, to their 2013 Progress Report that compiles data from only unincorporated areas within census tracts that lie within the SGPWA boundary. In this special study the County estimated the housing units in such census tracts in the year The results of this study are shown graphically in Figure 1, Appendix A, "Demographic Background." Furthermore, the Yucaipa Valley Water District UWMP does not segregate water demands from the parts of its service area that lie within the City of Calimesa and the County of Riverside. In addition, the South Mesa Water Company services portions of the City of Calimesa but does not have a UWMP. For these reasons, development projections for the City of Calimesa were provided by the City of Calimesa staff and are based on City General Plan projections and current development trends considering active development projects at various stages of planning. The following sources were used to project total new housing units to 2035: City of Banning UWMP (2010) Beaumont Cherry Valley Water District UWMP (2010) City of Calimesa planning data provided by City staff Riverside County 2013 Progress Report, with a special study that includes unincorporated areas within SGPWA boundaries (2014). See Figure 1, Appendix A For the City of Banning, their 2010 UWMP provides a total housing projection of 17,988 units in However, a breakdown of single family and multi family units was not provided. Using projected water usage and water usage factors provided in the UWMP, the 17,988 total units was broken down into single family and multi family units in proportion to each category s water usage. In similar fashion, the Beaumont Cherry Valley Water District UWMP (2010) projects total residential units in 2035 at 21,958 units, however it does not break that figure down to single family and multi-family units. Again, projected water usage for multi-family units in 2035 and water usage factors were used to calculate the percentage split between single family housing units and multi-family housing units in The resulting number of housing units were then rounded to the nearest 500 housing units and entered into Table 3 below (see Appendix A, Section A-5). Page 87 of 146
88 The City of Calimesa staff provided the number of existing and projected single family and multi-family housing units within the City limits 3. The City projects 12,100 new residential dwelling units between 2014 and The City projects over 23,000,000 new commercial building square feet and over 18,000,000 new industrial square feet by For the unincorporated areas the special study by the County of Riverside, mentioned above, projected a total of 10,068 residential units in It is assumed that most of the growth between 2015 and 2035 will be single family units. DTA assumed a 2% cumulative growth in multi-family units during this period, with the balance being single family units. A detailed discussion of the analysis used to estimate the number of future residential units can be found in Appendix A of this Study. Table 3 below summarizes the expected residential units within the study area at year 2035 Residential Land Use TABLE 3 Projected Residential Units in City of Banning 2 City of Beaumont City of Calimesa Unincorporated Area Total Residential Units Single Family 15,707 20,500 11,500 8,700 56,400 Multi-Family 2,281 1,500 4,300 1,400 9,500 Total 17,988 22,000 15,800 10,100 65, Rounded off to the nearest 100 units 2. Total units are not rounded. The 17,988 is taken directly from the City of Banning UWMP, Table 3-1. The UWMP s that cover the Cities of Banning and Beaumont do not provide projections for non-residential building square feet. Their projections consisted of growth in water demand, as it should for water planning purposes. The percentage growth in water demand for the land use categories within the city limits was applied to the data for existing development to project building square feet in The City of Calimesa staff provided projections for non-residential building square feet in Table 4 below summarizes the total expected non-residential square feet within the study area in Non-Residential Land Use TABLE 4 Projected Non-Residential Building Square Feet in City of Banning City of Beaumont City of Calimesa Unincorporated Area Total Non- Residential SF Commercial/Retail 7,018,000 4,921,000 24,895,000 5,112,000 41,946,000 Industrial 6,546,000 2,493,000 18,700,000 75,000 27,814,000 Total 13,564,000 7,414,000 43,595,000 5,187,000 69,760, Rounded off to the nearest 1,000 square feet 3 Letter from City of Calimesa to San Gorgonio Pass Water Agency dated July 15, Subject line reads "CITY OF CALIMESA LAND USE PROJECTIONS". Page 88 of 146
89 A detailed discussion of projected residential units and non-residential building square feet can be found in Appendix A of this Study. The numbers found in Table 3 and 4 above represent total numbers through To determine the amount of growth between 2014 and 2035 the data in Tables 1 and 2 (existing development) must be subtracted from the corresponding data in Tables 3 and 4 (total projected at 2035). This difference is shown in column (5), Table 7, Section V below. Page 89 of 146
90 V. Facility Component of the Facility Capacity Fee The estimated reasonable cost to SGPWA of providing water supplies to new development is divided into two components: the Facility Component of the Facility Capacity Fee ( Facility Fee ) and the Water Component of the Facility Capacity Fee (Water Capacity Fee ). This section will address the identification, the cost, the method of cost allocation, and the fee structure for new water facilities. SGPWA owns and maintains an integrated system of water storage and conveyance that provides benefit to all lands within SGPWA boundaries by providing access to an imported water supply through the SWP. Each facility within the system provides delivery of water for groundwater basin replenishment, storage for local use when imported water is in short supply, or direct delivery to retail agencies. SGPWA will need to construct new facilities within this system to augment current storage capacity and delivery capabilities in order to meet the demands of current and future development. Thus, imported water stored in the Beaumont Basin, or any other groundwater basin, by SGPWA can be locally used as part of a conjunctive use program in times of shortage, allowing SGPWA imported water supplies to be beneficially used by water users within the SGPWA service area. The integrated system will provide the central core access to a water supply for lands that would not otherwise have such access during prolonged periods of limited imported water deliveries and during years of surplus. For example, the Beaumont Basin Recharge Facility, more fully described in Section V.1 herein, provides an interconnected system of water delivery to local water agencies that overlie the Beaumont and Banning groundwater basins. The Beaumont Basin Recharge Facility adds recharge capacity and storage to an overdrafted basin in order to provide reliable water supplies to both new and existing development within the entire SGPWA service area. In July, 2015 Webb Associates submitted a letter report to SGPWA included herein as Appendix B, ( Implementation Update ). This document included detailed cost estimates, list of facilities, and detailed graphics that describe the location of recharge basins and alignments of interconnecting pipelines. The fair share allocation of the cost of facilities anticipated to be needed during this planning horizon is discussed in detail in Section V.2, Methodology herein. 1. Facility Costs For purposes of the Facility Fee calculation, SGPWA decided at this time to include only the facilities related to conjunctive use of the Beaumont Basin and the purchase of additional capacity from San Bernardino Valley Municipal Water District ( SBVMWD ) because these facilities will be needed prior to the year 2035 based on projected water demands for that year. The facilities to be financed consist of (1) the purchase of additional capacity in existing pipeline systems owned by others, and (2) an additional basin recharge project for underground water storage in the Beaumont basin, including land purchases associated with that basin facility. Itemized facility costs totaling $12.66M were provided Page 90 of 146
91 by Webb Associates in its Implementation Update document prepared for SGPWA. See Appendix B herein. The East Branch Extension Phase II project by DWR will include pipelines, pump station additions and expansions, and a reservoir that will convey SWP water from Highland to the SGPWA service area. SGPWA is negotiating with SBVMWDfor the purchase of an additional 32 cubic feet per second ( cfs ) capacity in the SBVMWD pipeline between Highland and Devil Canyon. This purchase will provide additional capacity for SGPWA, increasing its capacity from 32 cfs to 64 cfs for the entire East Branch Extension. It has been determined by SGPWA that the full additional 32 cfs capacity will be needed to meet the demands of expected development through The estimated cost of this capacity, as indicated in the Implementation Update (see Appendix B) is $4M. Beaumont Basin Recharge Facility SGPWA proposes to construct a 54 acre recharge basin (also known as the Beaumont Avenue Recharge Facility) at the intersection of Beaumont Avenue and Brookside Avenue for the purpose of storing SWP water conveyed through a 6,000 lineal feet pipeline. Water will be used to recharge the Beaumont Basin, thereby replenishing water used to meet the demands of expected development. The estimated cost to improve the site, not including land purchase costs, as indicated in the Implementation Update, is $5.46M. This facility will provide additional storage that can be filled in wet years and drawn down in dry years. The land cost for Beaumont Basin Recharge Facility is $3.2M. Table 5 below provides a summary of the list of facilities and the respective estimated costs that will be financed, or partially financed, by the revenue from the Facility Fee recommended in this Study. Maps showing the location of each facility can be found in the Implementation Update, found in Appendix B of this Study. Part of the additional capacity provided by the Beaumont basin recharge facility is needed for new development. This additional capacity will also provide a benefit to existing development. The total additional capacity from SBVMWD is required to meet the demands of new development. Therefore, only a portion of the cost of the basin recharge facility is allocated to new development and the full cost of the additional capacity from SBVMWD is allocated to new development. The allocations are more fully described in Section V.2, Methodology. Facility Name TABLE 5 Needs List and Estimate of Costs 1 Cost Estimate % Allocated To New Development Cost to New Development Beaumont Basin Recharge Facility $ 5,460, % $ 4,368,000 Land Costs for Beaumont Basin Recharge Facility $ 3,200, % $ 2,560, cfs capacity from SBVMWD $ 4,000, % $ 4,000,000 Total Facility and Land Cost $ 12,660,000 $ 10,928,000 Administrative 0.50% $ 55, Rounded to nearest $1,000 Grand Total $ 10,983,000 An Administrative Cost Component is included in the total cost to be financed in order to cover the costs incurred by SGPWA associated with the administration of the Facility Page 91 of 146
92 Capacity Fee program. Administrative costs include staff time associated with fee collection, maintenance of trust funds into which the fees are deposited, preparation of annual reports, and negotiation and implementation of agreements between SGPWA and the retail agencies or land use planning agencies. A budget of 0.50% of the total facility cost is a reasonable number to spread over the next twenty years of development, amounting to $55,000. This represents approximately one man-hour per month over the next twenty years. The revenue to fund these activities will be a component of the Facility Fees collected. 2. Methodology The Beaumont Basin Recharge Facility discussed above will benefit both existing and new development within the SGPWA boundaries while the additional capacity in the SBVMWD pipeline is needed solely to meet the demands of new development. Because the reliability of SWP deliveries is partially dependent upon weather trends, regulations and court cases, uncertainty becomes a major factor in the management of wholesale water deliveries. Also, the Beaumont Basin is now in balance and the adjudicated requirement that the basin cannot be in overdraft on a continual basis substantiates the need for SGPWA to find additional water rights and entitlements to improve reliability. The Beaumont Basin Recharge Facility will rely on imported water to operate as planned. The Beaumont Avenue Recharge Facility is a conjunctive use facility designed to take advantage of greater water supplies in wet years. With the reliability of the State Water Project decreasing, a regional conjunctive use project has value to current residents, enabling SGPWA as the regional water agency to import more water in those wet years and store it for future dry years. However, this value will increase substantially as the area grows, as more water supplies will be required and hence the value of being able to import and store more water in wet years increases greatly. With current water demands the conjunctive use facility might be used once in five years, providing a 20% utilization rate. That rate will increase in future years as additional supplies are obtained for the growing region. As the region grows and the Agency obtains additional water supplies, the facility will likely be used every year, increasing the utilization rate to 100%. Since in the near term it might only be used an average of 20% of the time, it makes sense to have 20% of the cost of the facility funded by current residents. With additional growth causing the facility to eventually be used continuously at 100% capacity, the remaining 80% should be funded by that growth. Thus the funding of the cost of the Beaumont Avenue Recharge Basin Facility and its land cost are components of the Facility Fee. The allocated costs are shown in Table 5 above. Based on current water demands and projections of future development to 2035, an additional 32 cfs capacity from SBVMWD is required solely to meet the demands of future development. Therefore the cost to purchase this additional capacity is allocated 100% to new development. Negotiations between SBVMWD and SGPWA are ongoing. The Implementation Update (see Appendix B) indicates that a $4M purchase price for this additional capacity is a reasonable estimate. Refer to Section V.1 above. Page 92 of 146
93 To fairly distribute the cost of new facilities allocated to the various land use designations for new development, a distribution based on an Equivalent Dwelling Unit ( EDU ) methodology will be used whereby water demand will serve as the unit of comparison. The water demand for a residential dwelling or one thousand square feet ( KSF ) of building floor area is compared as a ratio of that value to the demand for a single family residential unit. This ratio is defined as the EDU factor and is used to calculate the total existing EDUs, as shown in Table 6 below, and the increase in EDUs through 2035, as shown in Table 7 below. Data for projected residential and non residential development to 2035 is subtracted from the corresponding existing data as of 2014 to identify the growth in development from 2014 to 2035, as shown in Table 7. Converting this growth into EDUs, the allocated costs can then be distributed to the various land uses. Table 7 shows that the total growth in EDUs from 2014 to 2035 is 61,828 EDUs. Table 6 below shows the calculation for total existing EDUs, while Table 7 below shows similar calculations for future EDUs through Water use factors ( WUF ), in acre-ft of water demand per year ( AFY ) per acre, are shown in column (1) of both tables and the values are taken from Table 1-7 of the Webb Implementation Plan (see Appendix C) that was made a part of the 2011 Study, where the value entered for Unincorporated Areas and Others is the average of the values shown for Riverside County and Cabazon Area. In column (2) of both tables, Density (DU per acre or FAR), the residential densities are assumed to be the higher end of the range given for Residential Low and Residential High given in Table 1-7 of the Webb Implementation Plan for Single Family and Multi- Family land use designations, respectively. This is a reasonable and more conservative method to calculate the estimated densities in that it generates higher EDU counts, resulting in lower calculated residential fees. The densities for Commercial/Retail and Industrial categories use floor area ratios ( FARs ) of 0.20 and 0.40 respectively, which are also conservative for the same reasons discussed above for residential uses. In column (3) of both tables the unit water use, in AFY per DU for residential uses or AFY per KSF for nonresidential uses, for each land use category was then calculated from the values in the columns (1) and (2). For example, for the City of Banning, single family land use for existing development, as shown in Table 6, the WUF shown in column (1) is divided by the density shown in column (2). Thus 2.73 AFY/acre divided by 5 DU per acre equals AFY per DU. In a similar manner, for City of Banning, Commercial/Retail land use in Table 6, the WUF shown in column (1) is divided by the density in column (2), the result then divided by the KSF per acre conversion factor 4. Thus 5.76 AFY per acre divided by 0.20, the result then divided by KSF per acre equals AFY per KSF, as shown in column (3). The EDU factor in column (4) was determined by dividing each unit water use in column (3) by the unit water use for a single family dwelling unit in the City of Banning, Beaumont or Calimesa (0.546). For example, the unit water use calculated above for commercial/retail use, in column (3) is divided by for single family also shown in column (3) to produce an EDU factor of 1.21, shown in column (4). 4 1 acre = 43,560 square feet, or KSF Page 93 of 146
94 In Table 6 below, the total existing residential dwelling units and the total existing nonresidential building area in KSF shown in column (5) was taken from Tables 1 and 2. For instance, for the City of Banning, single family land use, the value of 9,936 DU s corresponds to the same value shown for the City of Banning, single family land use in Table 1. The total EDUs for existing development for the various agencies and land uses shown in column (6) were calculated by multiplying the residential dwelling units and commercial/industrial KSF shown in column (5) by the corresponding EDU factors shown in column (4). Land Use TABLE 6 EDU Calculation - Existing Development (1) (2) (3) (4) (5) (6) Water Use Factor (AFY/Ac) Density (DU per acre or FAR) Water Use (AFY per DU or KSF) EDU Factor DU or KSF EDU 1 City of Banning: Single Family ,936 9,936 Multi-Family ,281 1,115 Commercial/Retail ,536 5,497 Industrial , Total 17,113 City of Beaumont: Single Family ,681 12,681 Multi-Family , Commercial/Retail ,639 4,410 Industrial , Total 18,071 City of Calimesa: Single Family ,200 2,200 Multi-Family , Commercial/Retail ,482 1,796 Industrial Total 4,785 Unincorporated Areas & others Single Family ,208 6,481 Multi-Family , Commercial/Retail ,780 4,598 Industrial Total 11, totals are rounded Total Existing EDUs = 51,735 % of total 44.60% The total EDUs for new development shown in Table 7 below are calculated in a similar manner as Table 6 while using future development to The new development ( growth ) value is the difference between 2035 and existing residential DUs or nonresidential square feet from Tables 1 through 4. Page 94 of 146
95 Land Use (1) (2) (3) (4) (5) (6) Water Use Factor (AFY/Ac) Density (DU per acre or FAR) TABLE 7 EDU Calculation - Future Development Water Use (AFY per DU or KSF) EDU Factor DU or KSF EDU City of Banning: Single Family ,771 5,771 Multi-Family Commercial/Retail ,482 3,008 Industrial , Total 9,088 City of Beaumont: Single Family ,819 7,819 Multi-Family Commercial/Retail ,282 1,553 Industrial Total 9,458 City of Calimesa: Single Family ,300 9,300 Multi-Family ,800 1,369 Commercial/Retail ,413 28,371 Industrial ,288 2,441 Total 41,481 Unincorporated Areas & others Single Family ,492 2,602 Multi-Family Commercial/Retail ,332 1,620 Industrial Total 4,242 Total Future EDUs = 64,269 % of total 55.40% Total EDU's = 116,004 Based on the numbers shown in Table 6 and Table 7, it is anticipated that in the year 2035 there will be 116,004 EDUs within the SGPWA service area (51,735 existing EDUs plus 64,269 future EDUs). The summary of existing EDUs and growth EDUs at 2035 by land use is shown below in Table 8, EDU Summary at 2035 : Page 95 of 146
96 Land Use TABLE 8 EDU Summary at 2035 Existing EDUs New Growth Between 2015 and 2035 EDUs Total EDUs at 2035 Single Family 31,298 25,492 56,790 Multi-Family 3,243 1,405 4,648 Commercial/ Retail 16,301 34,552 50,853 Industrial 893 2,820 3,713 Totals 51,735 64, ,004 % of Total EDU's at % 55.40% % 3. Facility Fee Structure As indicated in Table 5 in this Section, the estimated total facility cost allocated to new development is $10.9M. This amount is divided by the total EDUs assigned to new development through 2035 to arrive at a cost per EDU of $ The administrative cost element is calculated in a similar fashion to be $0.89 per EDU. The total cost per EDU is $ These unit costs are shown in Table 9 below: TABLE 9 Facilites Cost Per EDU Item Cost EDUs for New Development Cost per EDU New Water Facilities $ 10,928,000 64,269 $ Administrative Overhead $ 55,000 64,269 $ 0.86 Totals $ 10,983,000 64,269 $ The proposed Facility Fee for the respective land uses is determined by multiplying the cost per EDU by the appropriate EDU factor. Because the EDU factors and the WUFs upon which the EDUs are based do vary between local service areas, as shown in Table 10, it is reasonable that weighted average WUFs are used to calculate uniform SGPWA service area EDU factors. This will result in one uniform fee structure to be used throughout the service area. Table 10 also shows the method for determining weighted average WUF for each land use. The WUF for each agency is weighted by the ratio of future EDUs for such agency to the total future EDUs. For example the City of Banning has 9,088 future EDUs, which represents 14.14% of the total future EDUs (refer to Table 7, EDU Calculation Growth at 2035 for EDU totals). Each land use within a given agency has its own specific WUF, which is multiplied by the weighting ratio specific to that agency (14.14% for the City of Banning). The weighted average WUF for each land use within the SGPWA service area is calculated by summing the weighted average WUF for each agency, by land use, and this value is shown in bold in the extreme right column labeled Total in Table 10. Page 96 of 146
97 Since EDUs are based on water demand, weighting based on EDUs presents a fair and rational means of determining service area wide EDU factors. For any of the four land use designations, the variation between EDU factors calculated by this weighted average method and the EDU factor determined on an individual retail agency basis, as shown in Table 10, is less than 4%, therefore use of the weighted average is reasonable. The calculation of the weighted average WUF for each land use designation is shown in Table 10 below: TABLE 10 Weighted Average Water Use Factors WUF by LandUse City of Banning City of Beaumont City of Calimesa Unincorporated Areas and Other Total Weighting Factors: subtotal of EDUs 9,088 9,458 41,481 4,242 64,269 % of total EDUs 14.14% 14.72% 64.54% 6.60% % Single Family: Water Use Factor ("WUF") Weighted WUF Multi-Family: Water Use Factor ("WUF") Weighted WUF Commercial/Retail: Water Use Factor ("WUF") Weighted WUF Industrial: Water Use Factor ("WUF") Weighted WUF If future data show that water use within the SGPWA service area is significantly different than the WUFs used in this study, it is recommended that SGPWA update the Facility Fee portion of this Update to reflect such changes. For residential land uses the Facility Fee is determined based on a per unit water demand, whereby a dwelling unit in a multi-family building would demand less water by volume than that demanded by a single family dwelling unit. In Table 11A below the weighted average WUFs, the densities, the resulting water uses and EDU factors were used to calculate a uniform Facility Fee structure for residential land uses only. In column (1) the weighted average WUFs were taken from Table 10 above. The densities in column (2), the water usages in column (3) and the EDU factors in column (4) are the same as used in Tables 6 and 7. The fee for each of the two land uses was calculated by multiplying the cost per EDU from Table 9 of $ by the service area wide EDU factor. For instance, the Facility Fee for a multi-family dwelling unit is found by multiplying the unit facility cost by 0.49, the EDU factor. Page 97 of 146
98 TABLE 11A Residential Facilty Component Fee Structure (1) (2) (3) (4) (5) (6) (7) Land Use Weighted Ave. WUF (AFY/Ac) Density (DU per acre ) Water Use (AFY per DU ) EDU Factor Facility Element ($ unit ) Admin Element ($ per Unit) Total Facility Fee per DU Single Family $ $ 0.86 $ Multi-Family $ $ 0.42 $ Commercial and industrial land uses include any one of many specific building uses, ranging from low water demand uses such as retail, office and warehouse to high demand uses such as commercial laundry and car wash. Consequently, a fee structure based on building meter size is reasonable and prudent. A 5/8 meter size is typical for a single family unit, therefore a 5/8 meter is assigned one EDU. EDU factors for larger meter sizes are determined by the ratio of meter operational capacities, as determined by values given by the American Water Works Association, Manual M-1 5. Table 11B below lists the various EDU factors, by meter size, and the corresponding Facility Fee. The facility element and the administration fees are calculated by multiplying the EDU factor by the costs per EDU from Table 9. TABLE 11B Non-Residential Facilty Component Fee Structure Meter Size AWWA Demand Ratio 1 EDU Factor Facility Element Admin Element Total Facility Fee 5/8" $ $ 0.86 $ /4" $ $ 0.94 $ " $ $ 1.20 $ /2" $ $ 1.54 $ " $ $ 2.48 $ " $ 1, $ 9.41 $ 1, " $ 2, $ $ 2, " $ 3, $ $ 3, " $ 4, $ $ 4, American Water Works Association, Manual M-6 It is recommended that SGPWA include in its fee resolution a provision to automatically increase the Facility Fee on July 1st of each year, beginning July 1, 2016 by a percentage equal to the change in Construction Cost Index for Los Angeles as published by Engineering News Record for the preceding twelve months. It is also recommended that SGPWA review the Facility Fee levels at reasonable intervals to incorporate changes in unit prices, facility requirements, water demands and demographics in order to ensure that Facility Fee cost allocations are reasonable and that collections over time will fund the required facilities. Finally, the Facility Fee is a requirement of all new development or redevelopment in the SGPWA service area, irrespective of whether a Water Capacity Fee (discussed in Section VI below) is required. 5 Principles of Water Rates, Fees and Charges, Manual M-1, and Water Meters- Selection, Installation, Testing and Maintenance, Manual M-6, American Water Works Association. Page 98 of 146
99 VI. Water Component of the Facility Capacity Fee The second component of the Facility Capacity Fee is the water component ( Water Capacity Fee ). The task of meeting the demands of new growth with scarce water sources is exacerbated by the significant reduction in reliability of imported water deliveries from the SWP due to periodic drought conditions, regulatory and court case cutbacks in allocations. SGPWA will need to purchase new water rights and entitlements to insure that additional water supplies will be available in the future as the SGPWA service area experiences new development. It has been estimated that total water demand at build-out is expected to be in excess of local supplies and existing imported SWP water, with allowances for reduced reliability. This deficit will need to be balanced by the purchase of new water rights and entitlements. The water rights and entitlements (authorized by SGPWA Act (b), (d) and (g)) that are needed to meet the demands of new development shall be purchased with funds provided by new development in the form of a Water Capacity Fee. In July of 2014 SGPWA instructed Water Consultancy to prepare a memorandum that updates the estimated cost of purchasing additional Table A water (see Appendix D). Water Consultancy, by this July 2014 memorandum, estimates the market value of the cost of additional water rights and entitlements at $6,200 per acre-ft. The amount charged to new development as a Water Capacity Fee will be determined based on water demand, on a project by project basis, by SGPWA in cooperation with the permitting agency that has jurisdiction over the project. Administrative overhead is estimated to be 0.50% of the fee revenue, or $31.00 per acre-ft. This amounts to $31,000 for a purchase of 10,000 acre-ft of water, which is sufficient funding to cover the costs of administrative actions required for such purchase. See Table 12 below: TABLE 12 Water Capacity Fee Item units Fee Fee for New Water Rights and Entitlements $ per ac-ft $ 6, Administrative Overhead $ per ac-ft $ Total $ 6, For example, using an annual water use amount of AFY as indicated in Table 11A, a hypothetical single family dwelling unit would pay a Water Capacity Fee of $3, (0.548 AFY x $6,231 per acre-foot). It is recommended that SGPWA include in its fee resolution a provision to review the Water Capacity Fee on July 1st of each year, beginning July 1, 2016, and adjust the Water Capacity Fee by a reasonable percentage based on the cost of actual water purchases, an updated water rights appraisal, or comparisons of recent purchases of additional water rights by statewide municipalities and special districts over the preceding twelve months. Page 99 of 146
100 Appendix A: Demographic Background Page 100 of 146
101 Appendix A Demographic Background The purpose of this appendix is to document the methodology used to process raw residential dwelling unit data and non-residential building square feet data provided by local agencies in order to update existing development data given in the 2011 Study to mid 2014 levels. This Study will project residential and non-residential development to a 2035 development horizon. These changes are necessary in order to calculate a fee structure for the Facility Fee, as discussed in Section V of this Study. The Water Capacity Fee is not affected by updated demographic information, since this fee is based on expected water usage on a project by project basis, as discussed in Section VI of this Study. The updated existing development data and the revised projected development levels at 2035 will yield growth data that will ultimately affect the proposed Facility Fee structure. This demographic data was updated in order to recommend a Facility Fee structure that will insure that new development will pay its reasonable fair share of the cost of wholesale water delivery systems necessary to continue to meet the demand in the SGPWA service area. The Facility Fee will be implemented based on a fee per new residential unit and a fee by meter size for new non-residential buildings. A.1 Existing Development Existing residential units and non-residential building square feet as of 2009 are shown in Tables 1 and 2 of the 2011 Study. In order to update these numbers for existing development to June 2014, it was determined that building permit activity between 2009 and June 2014, where available, would be the best data source to add to the 2009 numbers. A.1.1 Existing Residential Units Table 1 of the 2011 Study lists the total single family and multi-family residential units in the Cities of Banning, Beaumont and Calimesa, and a portion of the unincorporated area of Riverside County that lies within the SGPWA service area, as of Annual permit data provided by the Cities and the County of Riverside was used to sum the number of new residential units permitted from 2009 to mid These numbers were then added to the data found in the 2011 Study to determine the extent of existing residential development as of June See Table A1 below: Page 101 of 146
102 Residential Land use City of Banning City of Beaumont City of Calimesa Unincorporated Area Total Existing Residential Units Single Family Thru ,927 11,421 2,200 6,201 29,749 Single Family from 2010 Thru June , ,276 Total Existing Single Family 9,936 12,681 2,200 6,208 31,025 Multi Family Thru ,281 1,463 1,500 1,363 6,607 Multi Family from 2010 Thru June Total Existing Multi Family TABLE A1 Existing Residential Units 2,281 1,463 1,500 1,363 6,607 Total 12,217 14,144 3,700 7,571 37,632 A.1.2 Existing Non-Residential Building Square Footage In a manner similar to the method discussed above for updating existing residential units within the study area, permit activity for non-residential square feet between 2009 and June 2014 was added to the non-residential building square feet through The permit activity for the cities of Banning, Beaumont and Calimesa was provided by the respective City Building and Safety Departments while permit activity for the unincorporated areas within the SGPWA service area was provided by the County of Riverside. The numbers for existing development as of 2009 were taken from the 2011 Study. See Table A2 below: Non-Residential Land Use City of Banning TABLE A2 Existing Non-Residential Square Feet 1 City of Beaumont City of Calimesa Unincorporated Area Total Existing Non-Residential SF Comercial/Retail Thru ,502,000 3,624,000 1,482,000 3,471,000 13,079,000 Commercial /Retail from 2010 Thru June ,000 15, , ,000 Total Existing Commercia/Retail 4,536,000 3,639,000 1,482,000 3,780,000 13,437,000 Industrial Thru ,231,000 1,982, ,000 60,000 6,685,000 Industrial from 2010 Thru June Total Existing Industrial 4,231,000 1,982, ,000 60,000 6,685,000 Total 8,767,000 5,621,000 1,894,000 3,840,000 20,122, Actual numbers rounded to the nearest 1,000 square feet Page 102 of 146
103 A.2 Future Residential and Non-Residential Development Section IV of this Study, Demographics, refers to revising the development horizon to Many sources of information are available for selecting or computing residential units and non residential square feet in year 2035, such as local city planning departments, county planning and GIS department, and local water district planning departments and Urban Water Management Plans ( UWMPs ), for example: City of Banning City of Beaumont City of Calimesa County of Riverside Yucaipa Valley WD Beaumont Cherry Valley WD Since this Study relates to the recommendation of a facility capacity fee, in most cases UWMP s from retail water agencies within SGPWA boundaries were used as the primary source of 2035 demographic data. Reconciliation of Various Demographic Estimates Upon review the form of the data available from all sources is not consistent and easily related to residential units or non-residential square feet. For instance, the Banning UWMP lists total residential units (17,988), but lists projected water use for single family, multi family, commercial and industrial land uses in Therefore a calculation must be made to convert water use to residential units and non residential square feet. A similar approach is used for the City of Beaumont and the Community of Cherry Valley whereby total household data and water delivery projections in the Beaumont Cherry Valley Water District UWMP ( BCVWD UWMP ) are used in order to determine a reasonable projection for residential units and non residential square feet. The Yucaipa Valley Water District UWMP ( YVWD UWMP ) provides water demand projections for 2035 but does not break down the data into local agencies or communities within the district, including the City of Calimesa and unincorporated areas of the County. Consequently, the City of Calimesa staff provided projected residential housing units and non-residential building square feet to the year Approximately 75% of the residential housing unit projection was based on current projects before the City planning department at various stages of planning. City staff also provided projections to build out conditions for Commercial/Retail and Industrial building square feet. In several cases, using common conversion factors such as water use factors and persons per household to convert data to the desired units, the results led to possible inconsistencies that can be easily reconciled. For instance, the City of Banning shows no additional multi-family units during the period from 2009 to June 2014 and therefore has 2,281 multi-family units as of June 2014, according to Table 3 of this report. However, using Banning UWMP data and converting to residential units, this approach calculates only 711 units. A three-fold reduction in multi-family units is unreasonable. See Table 1 Letter from the City of Calimesa to San Gorgonio Pass Water Agency dated July 15, Subject line reads: "CITY OF CALIMESA LAND USE PROJECTIONS." Page 103 of 146
104 A3 below for the calculation using water usage to arrive at the 711 units. Similar disconnects lead one to believe that there is not one independent source of raw demographic data (population or households and building square feet) and not one set of conversion factors (per capita water use, persons per household) that is used by local agencies and retail water districts alike to determine water projections, residential units and non residential square feet. It should not be expected that universal conversion factors be used and residential and non-residential data be provided, as the primary objectives of local UWMP s is to identify projected water demands and water sources, not necessarily in terms of dwelling units and building square feet. Listed below are a few of the factors that can vary by agency depending on local conditions. To the extent that these factors become variable across agencies within the Agency, it becomes necessary to reconcile differences in demographic projections when comparing data. Persons per Household Water Growth Rates Per Capita Water Use Population Growth Rates Floor Area Ratios Service Area Water Demand Projections for residential dwelling units for the Cities of Banning, Beaumont and Calimesa are found in the various UWMP s that cover those areas. Projections for residential units for the unincorporated areas of Riverside County are found in special studies conducted by County staff. Projections for non-residential building square feet are basically projections of water usage converted to building square feet with the use of reasonable water use factors accepted in the 2011 Study. The methodology used to convert this data into single family and multi-family units and non-residential square feet is discussed below by jurisdiction. City of Banning Table 3-1 of the City of Banning UWMP projects the level of residential development in 2035 to be 17,988 units. This is based on the City s 2008 Housing Element and this number is consistent with Table 2-3 in Banning UWMP, which bases population projections on a 2% per year population increase from 2010 and an average of 2.7 persons per household. Table 3-1 does not break down the total units into single family and multi-family units. However, Table 3-1 does project the annual water demand for single family and multi-family dwelling units by multiplying a water use factor of 0.52 AFY per dwelling unit by 17,988 total units. This product is then broken down into single family and multi-family demand by applying percentages based on historical usage. These water demands are converted back to dwelling units by applying the water use factor 0.52 AFY. See Table A3 below: Page 104 of 146
105 Water use 1 (AF/yr) % Dwelling Units 2 Water use 1 (AF/yr) % Dwelling Units 2 Single Family 8, % 15,648 8, % 17,277 Multi Family % % 711 totals 8, % 16,292 9, % 17,988 Notes: Table A3 Residential Dwelling Units in the City of Banning per Table 3-1, 2010 UWMP: City of Banning, 2010 UWMP, Table City of Banning, 2010 UWMP, Table 3-1 and Table 2-3 Table A1 indicates that 2,281 multi-family units exist in the City of Banning as of June Table A3 above indicates that there are only 711 units projected for 2035 based on water demand. It is not plausible to expect a three-fold reduction in multi-family units to occur over the next twenty years. Therefore, for the purposes of this Study it will be assumed that the growth in residential units over the next twenty years will occur solely within the single family category, with the total housing unit count to remain at 17,988 as indicated in the City of Banning UWMP. See Table A4 below: Table A4.1 City of Banning - Projected Residential Units Single Family 14,011 15,707 Multi Family 2,281 2,281 Total 16,292 17,988 Table 3-1 of the City of Banning 2010 UWMP also indicates projected water usage for commercial and industrial uses for future years in 5 year increments. Using average increases during these intervals and prorating this average over the twenty year study period, an increase of 54.72% over current levels is calculated. That percentage increase is applied to existing levels to estimate non-residential levels of development in See Table A4.2 below: City of Beaumont and Cherry Valley Table A4.2 City of Banning Non-Residential Square Feet Commercial 4,536,000 7,018,004 Industrial 4,231,000 6,546,115 Total 8,767,000 13,564,119 Table 2-11 of the Beaumont Cherry Valley Water District Urban Water Management Plan ( BCVWD UWMP ) shows 21,958 households in However Table 2-11 does not break down the households into single family and multi-family categories. Table 3-8c of the BCVWD UWMP projects water deliveries (acre-ft per yr) in 2035 for single family and multi family categories. Using water use factors (acre-ft per year per DU) for each Page 105 of 146
106 category from Table 7 of the 2011 Study for SGPWA, the number of single family and multi-family units were projected based on water use. Since the total number of units determined by water use does not match the 21,958 units found in Table 2-11, the percentage split from the water use information was applied to the 21,958 total units to split single family and multi-family categories, as shown in Table A5.1 below: Table A5.1 City of Beaumont - Projected Residential Units projected water deliveries (acre-ft/yr) 1 water use factors (acreft/yr/du) 2 DU's Single Family 14, , % 20,610 Multi Family , % 1,348 15,127 28, % 21,958 Notes: 1. From Table 3-8c, BCVWD UWMP, year From Table 6, Capacity Fee Study for SGPWA, 2011 % DU's in 2035 The BCVWD UWMP does not provide data for projected non-residential building square feet, however, Tables 3-8b and 3-8c of the BCVWD UWMP indicate water usage in AFY for 2015 and The calculated percentage increases were then applied to the 2015 levels of existing commercial and industrial building square feet to project the corresponding 2035 levels. See Table A5.2 below: Table A5.2 City of Beaumont Non-Residential Square Feet increase Commercial % 3,639,000 4,920,920 Industrial % 1,982,000 2,493,484 Totals ,621,000 7,414,404 see Table 3-8b and Table 3-8c, BCVWD UWMP City of Calimesa The City of Calimesa General Plan is not clear with regards to demographic projections to the year Table 3-13 of the Yucaipa Valley Water District UWMP indicates projected water demands from areas within their district that lie within the SGPWA service boundary. For year 2035, water demand for domestic water, conjunctive use and long term supply sustainability is projected to be 1,453.7 MG. However, this data does not break down into land use categories. The Yucaipa Valley Water District UWMP demands include areas of Calimesa and portions of the unincorporated area of Riverside County that lie within SGPWA boundaries. In addition, the City of Calimesa is served in part by the South Mesa Water District. By segregating demographic data from the two Districts that apply only to the City of Calimesa results in projections for the City of Calimesa that would be inaccurate and possibly incomplete. For this reason it is Page 106 of 146
107 determined that projections provided by City staff would represent the latest and best data regarding growth within the City of Calimesa limits. Table A6 City of Calimesa - Projections to 2035 Dwelling Units Building S.F. Single Family 11,500 Multi-Family 4,300 Commercial 24,895,000 Industrial 18,700,000 Unincorporated Areas of Riverside County (not including Cherry Valley) The County of Riverside ( County ), Information Technology and Center for Demographic Research publishes a progress report that contains a wide range of demographic information for cities lying within the County limits as well as unincorporated areas within the County. However, the data in the progress report for the unincorporated area is countywide, and does not breakdown the areas within wholesale water districts. At the direction of SGPWA staff, Webb Associates contracted with County staff to have County staff prepare a special study that compiles population data and housing data for unincorporated areas that lie within the SGPWA service area. In November of 2014 the County submitted their study in the form of an area map and table of population and housing data for the years 2010, 2020 and See Figure 1 below: Page 107 of 146

108 FIGURE 1 Figure 1 above indicates that there are 10,068 housing units projected for the year 2035 that lie within unincorporated areas of the County that are within SGPWA service area. Based on current development trends, it is very unlikely that there will be much new multi-family development in the unincorporated areas. Therefore it is assumed that the current level of multi-family development (1,363 units) will increase by only 2% total over the next twenty years, and the remainder of the 10,068 projected units will fall into the single family residential category. See Table A7 below: Table A7 Unincorporated Areas - Residential Single Family 6,208 8,678 Multi Family 1,363 1,390 totals 7,571 10,068 The County progress report does not include non-residential data. However the Beaumont Cherry Valley Water District UWMP does indicate levels of water deliveries in 2015 and Page 108 of 146
109 2035, by land use categories. The study area in this UWMP includes undeveloped unincorporated areas in addition to the City of Beaumont. Similar to the method used for non-residential property within the City of Beaumont, it is reasonable to assume that the non-residential growth in these areas will be uniform and the magnitude of which is a percentage increase in the development that exists as of mid Also, it is assumed that the increase in water deliveries projected by the UWMP is a reflection of the judgment of BCVWD with regard to growth in its service area. Using these percentage increases in deliveries and applying those increases to current building square feet (in 1,000 square feet units, or KSF), 2035 projected commercial and industrial building square feet can be estimated. See Table A8 below: Table A8 Unincorporated Areas - Non Residential 2015 water deliveries 2035 water deliveries1 increase Existing KSF projected KSF Commercial % 3,780 5,112 Industrial % Tables 3-8b and 3-8c, BCVWD UWMP Page 109 of 146
110 Appendix B: Facility Costs Letter to Jeff Davis from Webb Associates, July 17, 2015 Page 110 of 146
111 Page 111 of 146


112 Page 112 of 146


113 Page 113 of 146


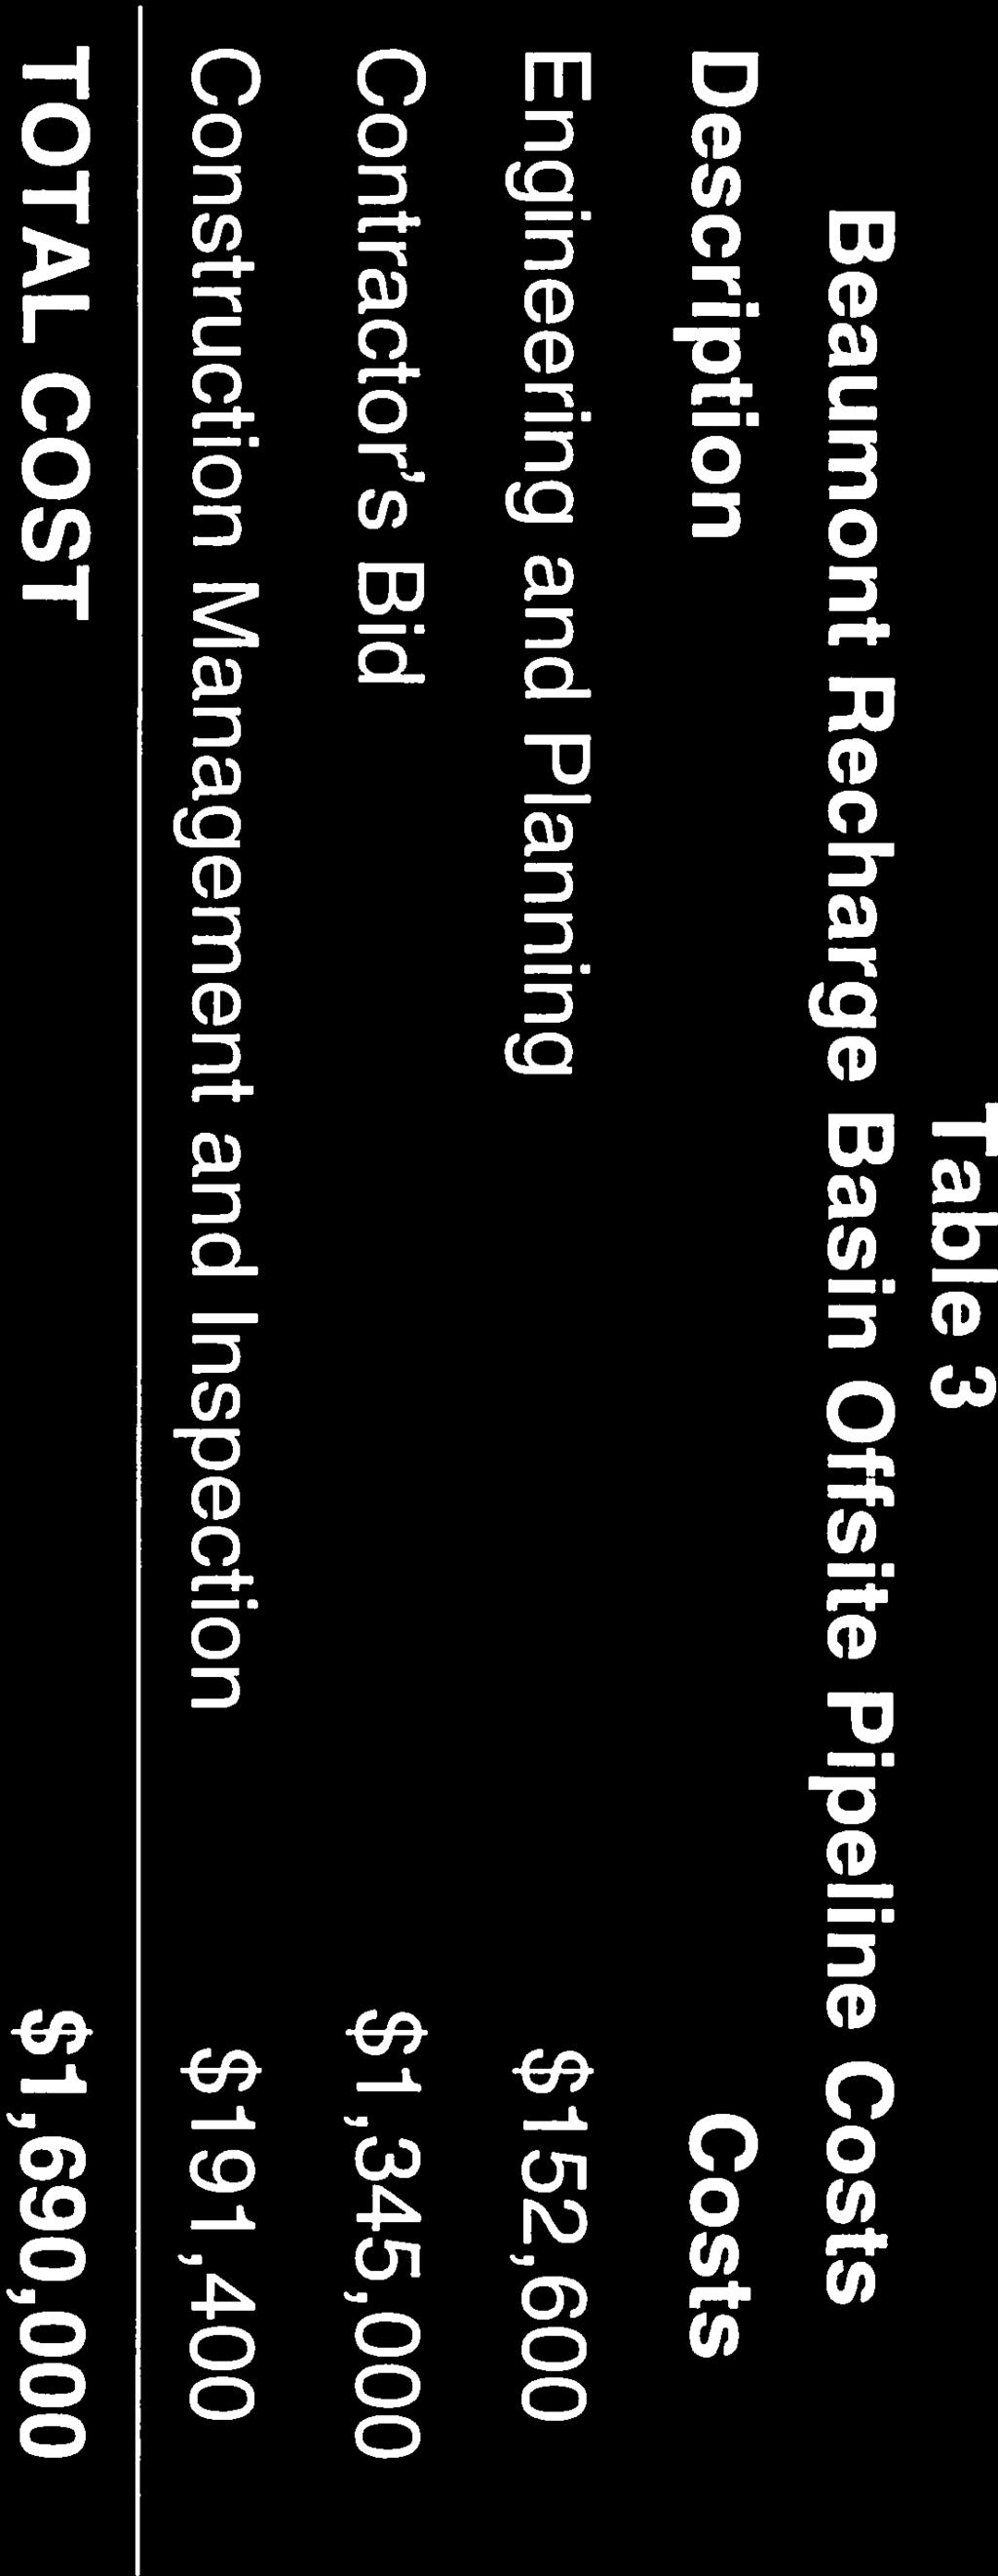
114 Page 114 of 146
115 Page 115 of 146
116 Page 116 of 146
117 Page 117 of 146

118 Page 118 of 146

119 Page 119 of 146


120 Page 120 of 146

121 Page 121 of 146


122 Page 122 of 146
123 Page 123 of 146
124 Appendix C Section 1 of Implementation Plan For Capacity Fee, Webb Associates, October 2010 Page 124 of 146


125 Implementation Plan for Capacity Fee San Gorgonio Pass Water Agency Prepared for San Gorgonio Pass Water Agency October 2010 Page 125 of 146