CO 2 -EOR and Carbon Geostorage;
|
|
|
- Jemima Bailey
- 5 years ago
- Views:
Transcription

1 1 CO 2 -EOR and Carbon Geostorage; A UK Perspective Jon Gluyas & Simon Mathias Department of Earth Sciences Durham University UKCCSC, Durham, UK September j.g.gluyas@durham.ac.uk
2 Outline Part 1 CO 2 -EOR in context Displacement & sweep efficiency Thief zones & gravity segregation WAG, SWAG and FAWAG Summary Part 2 Application & UK Potential The prize CO2 supply and facilities longevity Costing the earth & saving the planet The CO 2 -EOR heritage 2


3 Denver Unit of the Wasson Field, West Texas NETL CO2-EOR Primer (2010) 3
4 Thermal methods Steam injection leads to reduced oil viscosity. Air injection leads to in situ combustion. 4 Gas injection Includes injectionof natural gas, nitrogen and CO 2. Injected gas displaces oil. If reservoir pressure is sufficiently high the gas dissolves into the oil leading to reduced oil viscosity and volume swelling. Chemical methods Polymers are used to change the viscosity of injection water Surfactants (like detergent) are used to reduce surface tension
5 Maturation curve for EOR 5 Reegtien (2010) SPE


 From SPE 97270 Al-Shuraiqi")
6 What are we trying to do? 6 Improve displacement efficiency (microscale) Residually trapped oil Rock grains Water Flow of oil Adapted from CO2CORC Improve sweep efficiency (macro-scale) From SPE Al-Shuraiqi et al. 12th European Symposium on IOR
7 Displacement efficiency (micro-scale) 7 1 mm Pore-space (Price, 1996) Porethroat Electron photomicrograph of a sandstone
8 Residual trapping 8 Water Oil (Extracted from Tchelepi, 2009) If the rock is water wet, water adheres to the sides of the pores due to surface tension.

9 Residual trapping 9 Water Oil If the rock is water wet, water adheres to the sides of the pores due to surface tension. As water moves upwards oil is displaced. (Extracted from Tchelepi, 2009) But as the water passes through the pore throat, some of the oil is trapped.
10 Application of surfactants 10 Water Oil Surfactants (like detergent) reduce surface tension allowing oil to connect into a continuous phase.
11 Sweep efficiency (macro-scale) 11 Viscous fingering Poor conformance Gravity segregation
![Viscous fingering 12 x D = 2γ h γ [ ( 1) + 1] 2 D Mobility ratio is essentially the ratio of displacing to recovering fluid viscosity. Very small (or large) mobility ratios lead to poor sweep.](/docs-images/91/107257212/images/12-0.jpg "Ultimately, the front can become unstable and viscous fingering can occur. Mobility ratio can be favourably modified by increasing CO 2 viscosity by polymer addition. (Zhang et al.")
12 Viscous fingering 12 x D = 2γ h γ [ ( 1) + 1] 2 D Mobility ratio is essentially the ratio of displacing to recovering fluid viscosity. Very small (or large) mobility ratios lead to poor sweep. Ultimately, the front can become unstable and viscous fingering can occur. Mobility ratio can be favourably modified by increasing CO 2 viscosity by polymer addition. (Zhang et al. 1997, Chem Eng Sci 52:37-54)
13 Poor conformance 13 Production CO 2 Injection CO 2 often travels preferentially through high permeability thief zones. Oil Production Injection Oil CO 2 Sealing thief zones with gel or foam can lead to significantly enhanced sweep efficiency.
 or Li et al.")
14 Identification of thief-zones 14 See for example Butler et al. (2009, Hydrogeology Journal 17: ) or Li et al. (2010, SPE )
15 Identification of flowing horizons 15 (Mathias et al. 2006, Water Resour. Res. 43: W07443)
16 Gravity segregation 16 Production Injection Permeability CO 2 Oil Depth Production Injection Permeability Oil CO 2 Depth Use foam or gel to reduce permeability.
17 Application of gel for gas cut-off 17 Production Gas Oil Water Localised application of gel reduces permeability under gas cap leading to reduced gas production due to coning. See for example Al Dhafeeri et al. (2008, SPE )
18 18 WAG: Water Alternating Gas Pulsing of water and gas leads to reduced composite mobility due to residual trapping of gas. However, gravity segregation can still be an issue. SWAG: Simultaneous Water And Gas Simultaneous injection of water and gas at the top and bottom of reservoir, respectively. Should reduce gravity segregation but often limited by poor injectivity. FAWAG: Foam Assisted WAG Same as WAG but with surfactant. Combined surfactant and gas leads to foam generation which reduces the mobility of the gas. See Aladasani and Bai (2010, SPE ) and Anwan et al. (2008, SPE99546)
19 Summary 19 The aimof CO 2 -EOR is to mix residing oil with CO 2 to reduce oil viscosity and increase oil volume. The challenge is to improve displacement (microscale) and sweep(macro-scale) efficiency of the CO 2. Gravity segregation and thief zones are significant problems for large carbonate reservoirs. Gels, foams and WAG strategies represent a range of mitigating technologies (which reduce CO 2 mobility), which can be used in various combinations to optimise various effects.
20 CO 2 -EOR Texas 20 Initiated 1970s in response to oil crisis Texas at forefront of technology & leads the way today Permian Basin in NW Texas is the primary injection area 1000s km 32 pipeline & associated infrastructure developed Natural & anthropogenic CO 2 sources used
21 CO 2 -EOR Technology 21 Water Alternating Gas (WAG) CO 2 injected to swell oil and increase fluidity H 2 O injection to displace oil to production wells Gravity Stable Gas Injection (GSGI) CO 2 injected at field crest Stabilising pressure and promoting gravity drainage Miscible flood critical CO 2 dissolved in oil swelling oil, viscosity reduced surface tension reduced Immiscible CO 2 displacement Partial dissolution in oil may reduce viscosity substantially
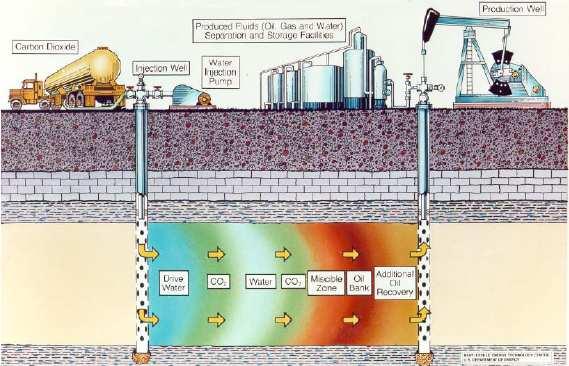
22 Schematic WAG 22
23 How much additional recovery? 23 West Texas 4-12% of STOIIP (observed) 60+ projects (~100 world wide) US DOE 7-14% of STOIIP (calculated) Institute for Energy (Netherlands) 9-18% STOIIP of UK, Norwegian & Danish fields (calculated) This study (2009) UK additional 3-8bn bbl DECC (2012) UK mean additional recovery 5.7bn (5-15% of STOIIP)
24 How much CO 2 is used? to 0.45 pore volumes injected Typically 1 (net*) tonne of CO 2 injected delivers 2.5 to 5 bbl oil (average 3 bbl) Tapered WAG (decreasing CO 2 volumes) most effective *Net = total injected - recycled


25 25 UK Oil Fields From Gluyas & Hichens, 2003 Viking Graben Moray Firth & Central N Sea
26 UK Offshore Oil Reserve 26 Proven Probable P+P Possible Maximum Cumulative Oil Production in millions tonnes (bnbbl) 3315 (24.9) Estimated Ultimate recovery in millions tonnes (bnbbl) 3723 (27.9) 361 (2.7) 4048 (30.4) 360 (2.7) 4444 (33.3)
27 UKCS Recovery Factors ~45% 27 High End - Piper recovery factor >70% Low End - Lyell recovery factor ~5% Jayasekera & Goodyear SPE 75171
 Line drive water floods for secondary recovery Low well density West Texas Sandstones &")
28 28 UKCS & West Texas Oil Fields UKCS Sandstones Most > 2.7 km deep Most > 90ºC Light oil ~35-40API Typically high quality (permeability 100s md) Line drive water floods for secondary recovery Low well density West Texas Sandstones & dolomites 1.2 to 1.8 km deep 15-60ºC Light oil 30-42API Typically low quality (permeability 4-16 md) Pattern floods l High well density
29 UKCS vs West Texas 29 West Texas incremental oil recovery 4-12% of STOIIP CO 2 is expected to be miscible (or nearly so) with current conditions in the UKCS oil reservoirs UKCS fields more permeable and at higher temperature than those in West Texas both factors may favour the North Sea From Goodyear et al, IEA EOR Caracas 2002
30 UKCS The Prize 30 Assuming UKCS: Reserve of 30,000mmbbl STOIIP 30,000/0.45 = 67,000mmbbl From West Texas 4-12% additional recovery of STOIIP Yields 2,700 8,000 mmbbl technical reserves Requiring ~1 t CO 2 per 3bbl* For ~3,000 mmbbl, ~1,000 Mt CO 2 required *range 2.5 to 5 bbl/tonne
31 31 UK Industrial CO 2 production 2007 Scotland North East Yorkshire 19mm tonnes 21mm tonnes 27mm tonnes UK oil province 100km
32 Supply & Demand 32 Assuming all industrial CO 2 from the eastern UK could be available for CO 2 -EOR yields 60-70mm tonnes per annum Over a year period (ie typical CO 2 -EOR project length) this would use 1 billion tonnes CO 2. the quantity required to optimise CO 2 -EOR in the North Sea


33 Are UK Oil Fields Ready For CO 2 -EOR? 33 Arbroath Claymore Maureen Ninian
34 The Time is Right (but don t wait) 34 UKCS Shrinking Infrastructure Jayasekera & Goodyear SPE 75171
35 35 UK Security of Supply Shortfall in 2010 ~15 mm tonnes Equivalent to ~300,000 bopd Equivalent to Initiating ~ 1 / 3 potential CO 2 -EOR projects DECC publication 2008
36 Costing the Earth? 36 For the North Sea There is no CO 2 infrastructure There is no ready source of CO 2 The first project will be an enormous commitment
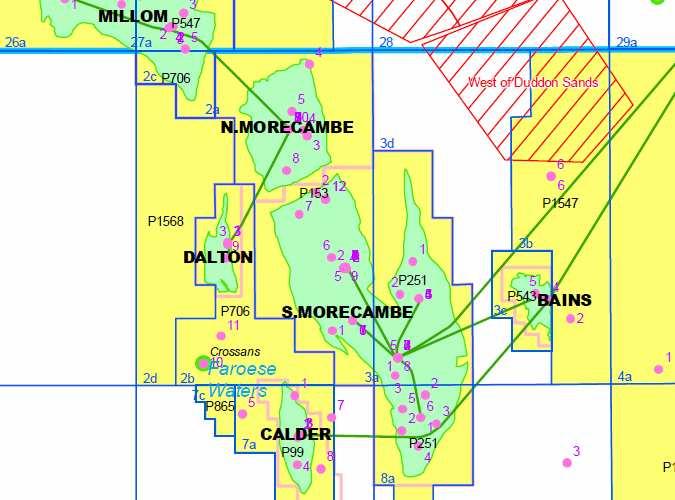
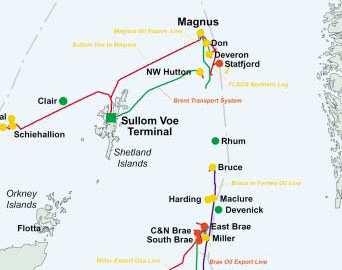
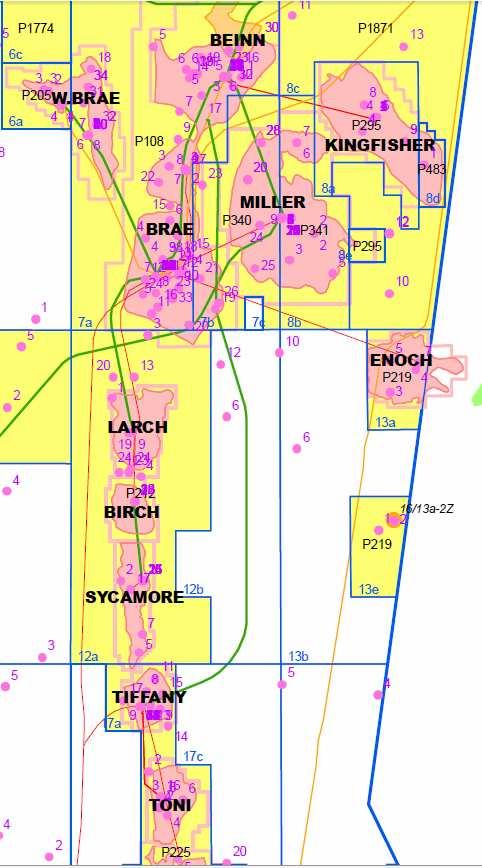
37 Capture, Transportation, Injection & Facilities Morecambe, Magnus & Miller 37
38 Saving the Planet 38 1bbl of oil contains 0.42 t CO 2 after combustion 1bbl produced by CO 2 -EOR requires between 0.4 and 0.2 t CO 2 At best the process is carbon neutral At worst the process is halving emissions
39 CO 2 -EOR Heritage 39 The CO 2 production from eastern UK could power CO 2 -EOR in the North Sea for years per project, over ~30 year period It could deliver: Improved security of oil supply Infrastructure usable for carbon capture Increased tax revenues over current projections Deep aquifer storage area