Everglades Research & Education Center Phosphorus BMP Workshop September 24, 2015
|
|
|
- Alicia Hutchinson
- 5 years ago
- Views:
Transcription

1 Everglades Research & Education Center Phosphorus BMP Workshop September 24, 2015 Tracey Piccone, Chief Engineer Applied Sciences Bureau, SFWMD


2 Location of Everglades STAs STA Treatment Area, acres 1E 4,994 1W 6, ,495 3/4 16,327 5/6 13,685 Total 57,045
3 Purpose and Mandates Reduce phosphorus in runoff water prior to discharging to the Everglades Protection Area Mandates Everglades Forever Act NPDES and EFA permits & Consent Orders Settlement Agreement/Consent Decree Current Water-Quality Based Effluent Limit (WQBEL) for TP Maximum of 19 ppb annual flow-weighted mean Not to exceed 13 ppb long-term flow-weighted mean in more than three (3) out of five (5) years
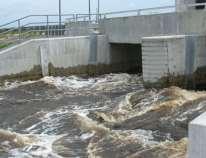
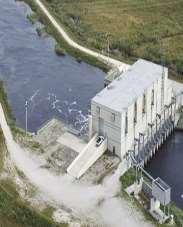
 Water delivered through gravity structures and pump stations")

4 STA Design Shallow constructed wetlands Maximum 4 depth (1.25 target depth) Water delivered through gravity structures and pump stations Vegetation types Emergent Aquatic Vegetation (EAV) Submerged Aquatic Vegetation (SAV) Hydraulic Retention Time: Varies by flow rate & event (eg days) P loading rate: <1 g/m 2 /yr P load removal: >74% )

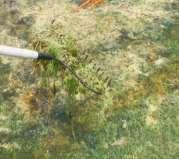
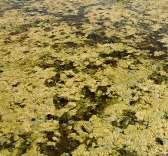

5 Phosphorus Removal Process Particulate settling Plant uptake Microbial uptake Binding with cations, e.g. Ca Phosphorus cycling Burial

6 STA Operational Strategies Overall: Treat all runoff water within STA capacity and considering STA treatment performance and flow-way restrictions Maintain optimal hydraulic and phosphorus loading Maintain optimal water depths for vegetation (after flow event ~1.25 ) Avoid too deep for too long Avoid dryout Adaptive management for performance optimization Use weekly data and information in prioritizing flows
7
8
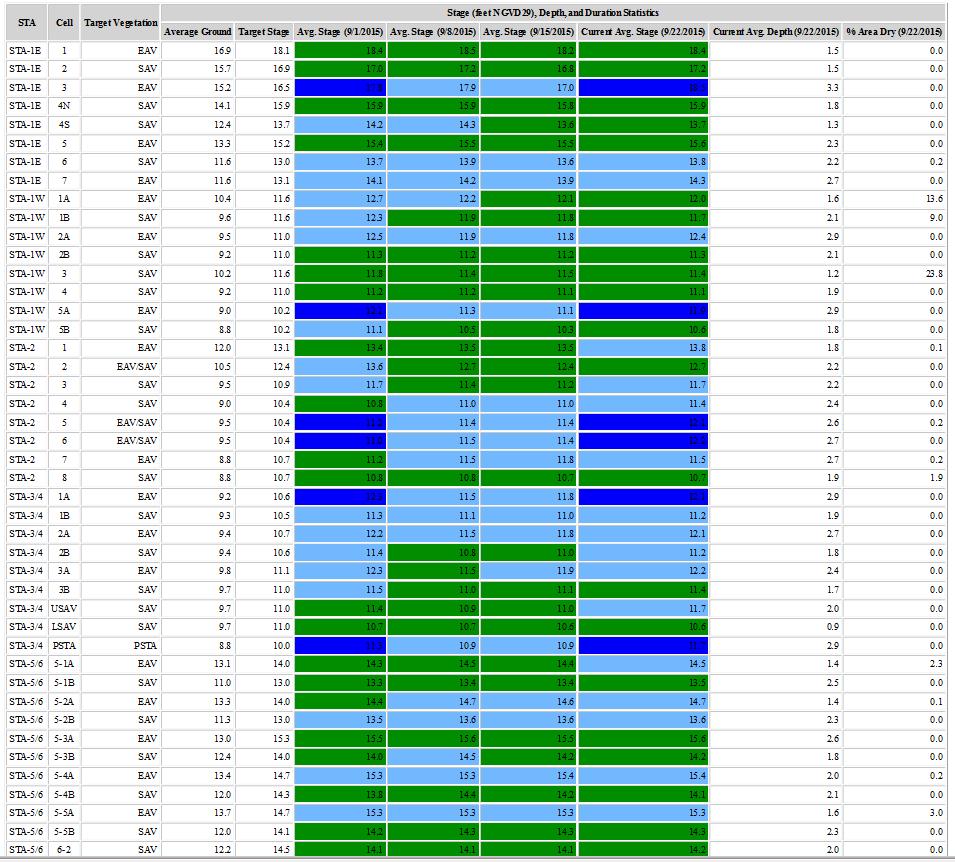
9 Long-Term STA Performance Parameter Period of Record WY2015 Effective treatment area (ac) 57,000 (total current) 54,510 Total volume treated (ac-ft) 15 million 1.3 million HLR (cm/d) ( ) PLR (g/m 2 /yr) ( ) TP load retained (mt) 1, % of load retained Inflow concentration, ppb 137 ( ) Outflow concentration, ppb 34 (17-71) 113 (71-198) 21 (14-41)
10 Treatment area, acres Flow-weighted Mean (ppb) Inflow volume (x1000 ac-ft) S O U T H F L O R I D A W A T E R M A N A G E M E N T D I S T R I C T Annual Flows and TP Concentrations 200 Inflow FWM TP Outflow FWM TP Inflow Volume Water Year (May-April) (partial WY2015) 60,000 50,000 40,000 30,000 20,000 10,
 STA-2 & 3/4 frequently achieved 19 ppb; each achieved 13 ppb once 70 65 60 55 50 45 40 35 30 25 20 15 10 5 0 STA-1E STA-1W STA-2 STA-3/4 STA-5/6 ALL")
11 Outflow TP FWMC, ppb Annual Outflow TP Concentrations POR outflow FWMC: 17 (STA-3/4) to 70 ppb (STA-5/6) WY 2015 outflows: 15 (STA-2 & STA-3/4) to 32 ppb (STA-5/6) STA-2 & 3/4 frequently achieved 19 ppb; each achieved 13 ppb once STA-1E STA-1W STA-2 STA-3/4 STA-5/6 ALL POR WY2015
12 Frequency, (#months) Cumulative frequency FWM Outflow TP Conc., ppb S O U T H F L O R I D A W A T E R M A N A G E M E N T D I S T R I C T STA-2 Monthly & Seasonal Outflow TP Distribution STA-2 Monthly Outflow TP ND >50 FWM Outflow TP concentration range, ppb Frequency Cumulative % 120% 100% 80% 60% 40% 20% 0% Seasonal Outflow TP Concentration Wet Dry 13 ppb or less - 21% of the time 19 ppb or less - 63% of the time Median TP FWM concentrations are comparable between wet and dry seasons
13 Frequency (#months) Cumulative frequency FWM Outflow TP Conc., ppb S O U T H F L O R I D A W A T E R M A N A G E M E N T D I S T R I C T STA-3/4 Monthly & Seasonal Outflow TP Distribution Monthly Outflow TP Frequency Distribution % 60 Seasonal Outflow TP Concentration % 80% 60% ND FWM Outflow TP concentration range, ppb 40% 20% 0% Frequency Cumulative % 0 Wet Dry 13 ppb or less - 28% of the time 19 ppb or less 60% of the time Median TP FWMC slightly higher during the dry season; higher variability during the wet season
14 Operational Constraints and Challenges Performance of biologically-based treatment systems like the STAs is naturally variable Integral components of a complex water management system with multiple objectives Receive variable inflows which affects the amount of phosphorus in the outflows Highly managed systems Routine operations and maintenance Controlling flows and stages Monitoring and optimization Enhancements and repairs
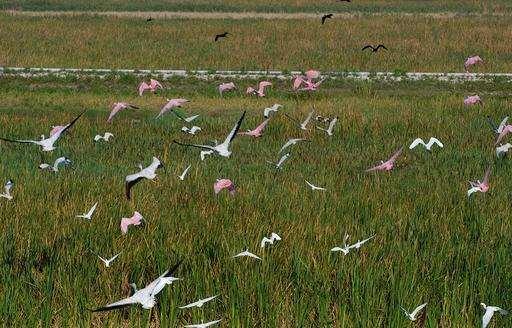
 Wildlife")


15 Operational Constraints and Challenges (continued) Wildlife use of the STAs can impact operations Migratory Bird Treaty Act, Endangered Species Act, Bald Eagle Protection Act Shared use of the STAs includes recreational activities (bird-watching and hunting)
16 Long-Term Plan Revision process for adaptive implementation Specific plans to improve each STA through structural and operational modifications and research Added Restoration Strategies in 2013 STA acreage and Flow Equalization Basins Science Plan
17 Science Plan Consent orders associated with NPDES permits for STAs require that a Science Plan be developed and implemented to: Identify the factors that collectively influence phosphorus treatment performance in STAs to meet the WQBEL In particular, factors that affect performance at low phosphorus concentrations (<20 µg/l TP) The Science Plan is a component of the SFWMD Restoration Strategies Regional Water Quality Plan Science Plan results will be used to provide information for the design and operation of projects, ultimately improving the capability to achieve WQBELs established in NPDES permits for the STAs 17
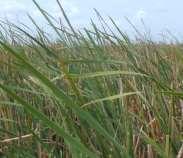
18 Five-Year Work Plan: Initial Suite of Studies 1) Investigation of STA-3/4 PSTA Technology Performance, Design and Operational Factors 2) Development of Operational Guidance for FEB and STA Regional Operation Plans 3) Evaluation of P Removal Efficacy of Water Lily and Sawgrass in a Low Nutrient Environment of the STAs 4) STA Water and Phosphorus Budget Improvements 5) Evaluate P Sources, Forms, Flux, and Transformation Processes in STAs 6) Evaluation of the Influence of Canal Conveyance Features on STA and FEB Inflow and Outflow TP Concentrations 7) Evaluation of Impacts of Deep Water Inundation Pulses on Cattail Sustainability 8) Use of Soil Amendments/Management to Control P Flux 9) Evaluation of Sampling Methodologies for TP 18


19 Phosphorus Sources, Forms, Flux, & Transformation Processes in the STAs Study Objectives/Purpose Characterize P sources, speciation, cycling, and transport in STAs, and understand mechanisms and factors influencing P reduction in low P environment Use results to recommend enhancements or new operational and management strategies to further improve STA performance 19


20 Periphyton-based Stormwater Treatment Area (PSTA): Performance, Design & Operational Factors Study Objective/Purpose Continue investigation of PSTA cell performance to determine design elements, operational factors, and biogeochemical characteristics that enable the PSTA cell to achieve ultra-low outflow TP levels 20


21 Impacts of Deep Water Inundation Pulses on Cattail Sustainability Study Objectives/Purpose Evaluate the influence of deep water pulsing on cattails Provide recommendations for STA and FEB operations 21

22 Evaluation of the Influence of Canal Conveyance Features on STA & FEB Inflow & Outflow TP Concentrations Study Objectives/Purpose Determine whether P concentrations change when conveyed through STA inflow and outflow canals Evaluate P concentration in sediments and seepage to and from canals 22
23 Questions?