WEEKLY PROGRESS REPORT TRC SOLUTIONS. Gowanus Canal Turning Basin 4 Dredging and Capping Pilot Study Brooklyn, New York. Project number:
|
|
|
- Thomas Maxwell
- 5 years ago
- Views:
Transcription
1 WEEKLY PROGRESS REPORT TRC SOLUTIONS Gowanus Canal Turning Basin 4 Dredging and Capping Pilot Study Brooklyn, New York Project number: Period: November 26 to 30, 2018 Date of Report: December 5, 2018 Rev: 0 Prepared For: Gowanus Environmental Remediation Trust
2 On-Site Activities Conducted During Week: Sevenson Environmental Services (SES) Turbidity Monitoring Turbid water not observed migrating from the 4 th Street Turning Basin. TB4 Demobilization Activities Commence placement of stone between installed sheet piles and existing bulkheads along southern boundary of Turning Basin 4. Disassemble hydraulic capping barge. Confirm elevation of oleophilic clay and sand mixture placed between existing timber bulkhead and installed sheet pile adjacent to Whole Foods. Citizens Site Demobilization Activities Continue decontaminating and demobilizing equipment. Quality Assurance and Control Geosyntec No exceedance of the turbidity trigger or action criteria Measurements for 11/26/18: Data from Monday, November 26 th, 2018 did not meet data quality requirements for accuracy and were rejected. Measurements for 11/27/18: Data from 07:00 to 12:00 on Tuesday, November 27 th, 2018 did not meet data quality requirements for accuracy and were rejected. Daily average for ambient buoy 11.6 NTU Daily average for sentinel buoy 4.1 NTU Greatest difference between ambient and sentinel buoy during 15-minute interval with sentinel buoy exceeding ambient buoy no instances when turbidity measurement at the sentinel buoy exceeded the ambient buoy. Measurements for 11/28/18: Daily average for ambient buoy 12.4 NTU Daily average for sentinel buoy 6.0 NTU Greatest difference between ambient and sentinel buoy during 15-minute interval with sentinel buoy exceeding ambient buoy no instances when turbidity measurement at the sentinel buoy exceeded the ambient buoy. Measurements for 11/29/18: Daily average for ambient buoy 18.3 NTU Daily average for sentinel buoy 8.8 NTU Greatest difference between ambient and sentinel buoy during 15-minute interval with sentinel buoy exceeding ambient buoy no instances when turbidity measurement at the sentinel buoy exceeded the ambient buoy. Measurements for 11/30/18: Daily average for ambient buoy 19.5 NTU Daily average for sentinel buoy 1.4 NTU Greatest difference between ambient and sentinel buoy during 15-minute interval with sentinel buoy exceeding ambient buoy no instances when turbidity measurement at the sentinel buoy exceeded the ambient buoy. Community Air Monitoring Program TRC CAMP Operated and maintained two (2) air monitoring stations at the upland staging area and five (5) monitoring station at the 4 th Street Turning Basin Area.
3 No exceedances of particulate matter of 10 microns in diameter or smaller (PM10) or total volatile organic compounds (TVOC) of the action level of 150 micrograms per cubic meter or 1,000 parts per billion, respectively. Maximum weekly measurements of PM10 in µg/m 3 Station 1 14 µg/m 3 recorded on 11/26/18 Station 2 14 µg/m 3 recorded on 11/26/18 Station 3 67 µg/m 3 recorded on 11/27/18 Station 4 12 µg/m 3 recorded on 11/30/18 Station 5 20 µg/m 3 recorded on 11/30/18 Station 6 14 µg/m 3 recorded on 11/30/18 Station 7 <1 µg/m 3 recorded throughout the week Maximum weekly measurements of TVOC in ppb Station ppb recorded on 11/27/18 Station 2 <1 ppb recorded throughout the week Station 3 14 ppb recorded on 11/26, 11/28, and 11/29/18 Station 4 33 ppb recorded on 11/28/18 Station 5 77 ppb recorded on 11/28 and 11/29/18 Station 6 23 ppb recorded on 11/29/18 Station 7 <1 ppb recorded throughout the week 23-hour samples collected at ST-4 (collocated) collected on 11/28 through 11/29. Laboratory turnaround time is 10 business days. All real-time readings of formaldehyde, hydrogen sulfide, or ammonia less than instrument reporting limit. Tabulated laboratory analytical results for 24-hour sample collected at ST-1 on 10/15 through 10/16, ST-7 (collocated) on 10/18 through 10/19, ST-5 on 10/24 through 10/25, and ST-6 on 10/22 through 10/23 presented in weekly CAMP report. Noise and Vibration Monitoring Wilson Ihrig Operated and maintained two (2) noise monitors: NM-1 (north side of canal on Whole Foods promenade) and NM-2 (south side of canal on southeast corner of 386 3rd Avenue). Exceedances of the hourly Leq noise limit of 80 dba measured at southern monitor during vacuum truck operations. Greatest hourly Leq noise measurements Northern monitor (NM-1) 77.8 dba during on 11/27/18 Southern monitor (NM-2) 89 dba during on 11/27/18 Cultural Natural Resource Monitoring Archeology and Historic Resource Services (AHRS) No activities during week. Two-Week Look Ahead: Sevenson: Transport for off-site disposal gravel and liner from dredge water treatment system pad. Perform optical monitoring of bulkheads and surrounding structures with autonomous total survey stations. Complete stone between installed sheet pile and existing bulkhead on southern side of TB4. Continue to demobilize equipment and materials from Citizens Site. Restore Citizens Site in accordance with specifications. Complete items on provided punch list and conduct walkthrough.
4 Geosyntec Perform construction quality assurance responsibilities. TRC CAMP Monitoring Perform community air monitoring. Demobilize monitoring stations from Turning Basin 4 vicinity. Wilson Ihrig Perform noise monitoring. Demobilize noise monitors. AHRS Finalize final report for EPA review. Oversee packaging for shipment of materials from Clean Earth and delivery to Citizens Site. Key Milestones No milestones during period. Attachments: 1. Geosyntec In-Canal Water Quality Monitoring Weekly Data Summary 2. TRC Weekly CAMP Report 3. Wilson Ihrig Weekly Noise and Vibration Monitoring Report 4. AHRS Weekly Report (no activities during week) 5. Water Treatment System Monitoring Analytical Laboratory Data (no activities during week) 6. Cumulative Dredged Material Chart (no activities during week)


5 Client Name: Site Location: Project No.: Gowanus ERT TB-4 Pilot Study Photo No. Date Description Decontamination of removed hydraulic capping piping. Photo No. Date Description Hydraulic capping piping removal.


6 Photo No. 003 Client Name: Site Location: Project No.: Gowanus ERT TB-4 Pilot Study Date Description Removal of gravel to confirm elevation of placed oleophilic clay and sand mixture. Photo No. 004 Date Description Measuring of distance from installed sheet piling to top of oleophilic clay and sand mixture.


7 Client Name: Site Location: Project No.: Gowanus ERT TB-4 Pilot Study Photo No. Date Description Rigging super sack to place gravel between existing bulkhead and installed sheet piling. Photo No. Date Description Hydraulic capping mix tank being demobilized.


8 Client Name: Site Location: Project No.: Gowanus ERT TB-4 Pilot Study Photo No. Date Description Staging super sacks on hydraulic capping barge for gravel placement. Photo No. Date Description Finished gravel placement along Whole Foods bulkhead.


9 Client Name: Site Location: Project No.: Gowanus ERT TB-4 Pilot Study Photo No. Date Description Placement of gravel adjacent to Dykes Lumber. Photo No. Date Description Cleaning of on-site catch basin.
10 GEOSYNTEC IN-CANAL WATER QUALITY MONITORING WEEKLY DATA SUMMARY


11 Prepared for GOWANUS CANAL SUPERFUND SITE DREDGING AND CAPPING PILOT STUDY Water Quality Monitoring Weekly Data Summary Week of November 26 th, 2018 Report Contents Scope of Monitoring Turbidity Buoy Data Handheld Measurements Summary of Visual Observations Report of Exceedances Prepared by 7 Graphics Drive, Suite 106 Ewing, NJ Project Number HPH106A (52)
12 1. SCOPE OF MONITORING The following report summarizes water quality monitoring data collected during the week of November 26 th, Two turbidity buoys were deployed to monitor turbidity during the pilot study. One turbidity buoy was deployed just outside of the 4 th Street Turning Basin and is referred to as the sentinel buoy. A second turbidity buoy was deployed further upstream in RTA1 in order to monitor background turbidity unaffected by on-water construction activities. This turbidity buoy is referred to as the ambient buoy. A map indicating the approximate locations of the turbidity buoys is provided in Figure 1. Each turbidity buoy was equipped with a YSI 600 OMS water quality meter with optical turbidity sensor. The buoys were programmed such that readings were collected every 15 minutes. After each measurement, the turbidity data were transmitted to a FTP site via telemetry. This report provides the turbidity data collected every 15 minutes from both the ambient and sentinel buoys during each day between 7 AM and 5 PM during the week of November 26 th. Average and maximum turbidity are also presented. Turbidity readings from November 26 th and November 27 th did not meet data quality criteria and were rejected. This failure was due to biofouling of the turbidity sensors causing the sensors to fail calibration checks. Limited waterway construction activities occurred on this reporting period and consisted of gravel placement behind the temporary bulkhead supports. No handheld measurements were collected during this reporting period. Visual observations of turbidity and sheen are summarized in Section 4.

13
14 2. TURBIDITY BUOY DATA The following section provides turbidity data for the sentinel and ambient turbidity buoys from 7 AM to 5 PM from November 27 th to November 30 th, On Tuesday, November 27 th, the sentinel buoy was serviced to remedy fouling of the meter. Data from Monday, November 26 th and the morning of Tuesday, November 27 th have not been provided due to failure of data quality requirements for accuracy. Negative turbidity values were observed at the sentinel buoy on Friday, November 30 th. Since the numerical criteria is based on the difference between the ambient and sentinel turbidity buoy measurements, these negative values do not impact monitoring. Background data prior to the start of dredging is provided in Appendix A. No exceedances to the numerical rolling average threshold criteria were observed during the reporting period. Activities on the Canal were limited and consisted of gravel placement behind the temporary bulkhead supports. 2.1 Monday, November 26 th, 2018 Data from Monday, November 26 th, 2018 did not meet data quality requirements for accuracy and were rejected.


15 2.2 Tuesday, November 27 th, 2018 Data from 07:00 to 12:00 on Tuesday, November 27 th, 2018 did not meet data quality requirements for accuracy and were rejected.


16 2.3 Wednesday, November 28 th, 2018


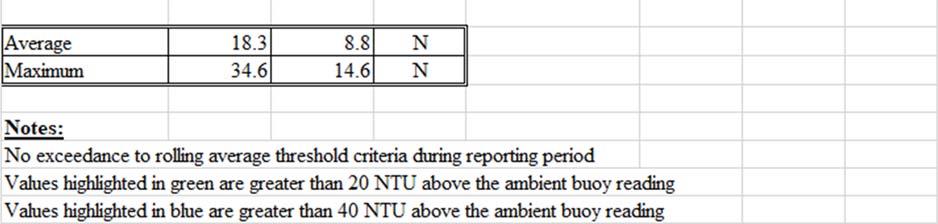
17 2.4 Thursday, November 29 th, 2018


18 2.5 Friday, November 30 th, 2018
19 3. HANDHELD MEASURMENTS No handheld measurements were collected during this reporting period. 4. SUMMARY OF VISUAL OBSERVATIONS Visual observations were consistent with background conditions. 5. REPORT OF EXCEEDANCES Turbidity buoy data was rejected for the November 26 th and November 27 th due to data failing to meet data quality requirements. Refer to the Water Quality Monitoring Plan for In-waterway Construction Activities (Geosyntec 2017) for further information regarding the Trigger and Action Criteria. Threshold criteria are summarized as follows: Trigger criterion Any of the following: o The rolling average of the sentinel buoy turbidity measurements over a one-hour period exceeds the rolling average of the ambient buoy turbidity measurements by 20 NTU excluding any eliminated outlier measurements; or o Either an oil sheen or a turbidity plume is visually observed outside of engineering controls and in-waterway construction activities cannot be immediately excluded as the source. Action criterion Any of the following: o The rolling average of the sentinel buoy turbidity measurements over a one-hour period exceeds the rolling average of the ambient buoy turbidity measurements by 40 NTU excluding any eliminated outlier measurements; or o Either an oil sheen or a turbidity plume is visually observed outside of engineering controls and in-waterway construction activities are readily identified as the source.
20 FIGURES
21 ³ X:\03_GIS\mxd\Canal_Wide\Turbidity Buoy Locations.mxd; acarnes; 10/19/2017 Legend #* Ambient Buoy #* Sentinel Buoy RTA Boundary Gowanus Canal Remedial Design Group Feet Turbidity Buoy Locations Gowanus Canal, Brooklyn, NY Ewing, NJ October 2017 Figure 1
22 APPENDIX A PRE-DREDGE TURBIDITY BUOY DATA
23 PRELIMINARY DATA NOT YET SUBJECT TO QC REVIEW Ambient Turbidity (NTU) Sentinel Turbidity (NTU) Sentinel> Ambient (Y/N) Ambient Turbidity (NTU) Sentinel Turbidity (NTU) Sentinel> Ambient (Y/N) Ambient Turbidity (NTU) Sentinel Turbidity (NTU) Time (Local) Time (Local) Time (Local) 10/3/ : N 10/4/2017 4: Y 10/4/ : N 10/3/ : N 10/4/2017 4: Y 10/4/ : N 10/3/ : N 10/4/2017 5: Y 10/4/ : N 10/3/ : N 10/4/2017 5: Y 10/4/ : N 10/3/ : N 10/4/2017 5: Y 10/4/ : N 10/3/ : N 10/4/2017 5: Y 10/4/ : N 10/3/ : N 10/4/2017 6: Y 10/4/ : N 10/3/ : N 10/4/2017 6: Y 10/4/ : N 10/3/ : N 10/4/2017 6: Y 10/4/ : N 10/3/ : N 10/4/2017 6: Y 10/4/ : N 10/3/ : N 10/4/2017 7: Y 10/4/ : N 10/3/ : N 10/4/2017 7: Y 10/4/ : N 10/3/ : Y 10/4/2017 7: Y 10/4/ : N 10/3/ : Y 10/4/2017 7: N 10/4/ : N 10/3/ : N 10/4/2017 8: Y 10/4/ : N 10/3/ : N 10/4/2017 8: N 10/4/ : N 10/3/ : N 10/4/2017 8: N 10/4/ : N 10/3/ : N 10/4/2017 8: Y 10/4/ : N 10/3/ : N 10/4/2017 9: Y 10/4/ : N 10/3/ : N 10/4/2017 9: N 10/4/ : N 10/3/ : N 10/4/2017 9: N 10/4/ : N 10/3/ : N 10/4/2017 9: N 10/4/ : N 10/3/ : N 10/4/ : N 10/4/ : N 10/3/ : N 10/4/ : N 10/4/ : N 10/3/ : N 10/4/ : N 10/5/2017 0: N 10/3/ : N 10/4/ : N 10/5/2017 0: N 10/3/ : N 10/4/ : Y 10/5/2017 0: N 10/3/ : N 10/4/ : Y 10/5/2017 0: N 10/3/ : N 10/4/ : N 10/5/2017 1: N 10/3/ : N 10/4/ : N 10/5/2017 1: Y 10/3/ : N 10/4/ : N 10/5/2017 1: N 10/3/ : N 10/4/ : N 10/5/2017 1: N 10/3/ : N 10/4/ : N 10/5/2017 2: N 10/3/ : N 10/4/ : N 10/5/2017 2: N 10/3/ : Y 10/4/ : N 10/5/2017 2: N 10/3/ : N 10/4/ : N 10/5/2017 2: N 10/4/2017 0: N 10/4/ : N 10/5/2017 3: N 10/4/2017 0: N 10/4/ : N 10/5/2017 3: N 10/4/2017 0: N 10/4/ : N 10/5/2017 3: N 10/4/2017 0: N 10/4/ : N 10/5/2017 3: N 10/4/2017 1: N 10/4/ : N 10/5/2017 4: N 10/4/2017 1: N 10/4/ : N 10/5/2017 4: N 10/4/2017 1: N 10/4/ : N 10/5/2017 4: N 10/4/2017 1: N 10/4/ : N 10/5/2017 4: N 10/4/2017 2: N 10/4/ : N 10/5/2017 5: N 10/4/2017 2: N 10/4/ : N 10/5/2017 5: N 10/4/2017 2: N 10/4/ : N 10/5/2017 5: Y 10/4/2017 2: N 10/4/ : N 10/5/2017 5: N 10/4/2017 3: N 10/4/ : N 10/5/2017 6: N 10/4/2017 3: N 10/4/ : N 10/5/2017 6: N 10/4/2017 3: N 10/4/ : N 10/5/2017 6: N 10/4/2017 3: N 10/4/ : N 10/5/2017 6: Y 10/4/2017 4: Y 10/4/ : N 10/5/2017 7: Y 10/4/2017 4: Y 10/4/ : N Average N Maximum Y Sentinel> Ambient (Y/N)
24 TRC WEEKLY COMMUNITY AIR MONITORING PROJECT REPORT
 Community Air Monitoring Project 60 th Weekly Monitoring Period Summary Report: November 26 th, through November 30 th, 2018 Report Contents Executive Summary Daily Data Summary")
25 Gowanus Canal Superfund Site TB-4 Dredging and Capping Pilot Study Brooklyn, New York Weekly Report (TRC Project No ) Community Air Monitoring Project 60 th Weekly Monitoring Period Summary Report: November 26 th, through November 30 th, 2018 Report Contents Executive Summary Daily Data Summary Report PM10/TVOC Daily Meteorological Summary Report Periodic Monitoring Results Volatile Organic Compounds (USEPA Method TO-15)
26 Gowanus Canal Superfund Site TB-4 Dredging and Capping Pilot Study Brooklyn, New York Executive Summary Week 60 Monitoring Period November 26 th through November 30 th, 2018 The following report summarizes site air monitoring activities for the Week 60 monitoring period from November 26 th through November 30 th, The start and stop times associated with each daily monitoring period are listed on the respective daily reports. TRC continued to operate two (2) air monitoring stations on the Citizen Property or Staging Area, and five (5) air monitoring stations in the 4 th St Turning Basin Area using the equipment specified previously in the Gowanus Canal TB-4 Dredging and Pilot Study Executive Summary Background Monitoring Period Report. During the Week 60 monitoring period there were no PM10 or TVOC exceedances of the action level of 150 ug/m 3 or 1,000 ppb respectively as defined in the Community Air Monitoring Plan for the Gowanus Canal TB-4 Dredging and Pilot Study Project Brooklyn, NY, August Figure 1 depicts Total Volatile Organics (TVOC) daily averages and maximums. Figure 2 depicts particulate monitoring (PM10) daily averages and maximums. Figure 3 depicts the station locations along the Gowanus Canal. Additional monitoring for hydrogen sulfide, ammonia, and formaldehyde took place at all stations throughout the Week 60 monitoring period twice daily. The results of these measurements are shown in Table 1. During the Week 60 monitoring period of November 26 th through November 30 th, 2018 TRC conducted Volatile Organic Compounds (USEPA Method TO-15) sampling at Station 4. Co-located samples (ST-4A and ST-4B) were collected at Station 4 on November 28 th, through November 29 th, The samples was collected over a 23-hour period and shipped to Con-Test Analytical Laboratory for analyses. The results of the summa canister sampling are pending lab analyses.
27 Table 2 presents the analytical results for 23-hour samples collected at Station 1 and 7 during Week 54. ST-1 was collected on October 15 th, through October 16 th, Colocated samples (ST-7A and ST-7B) were collected at Station 7 on October 18 th, through October 19 th, Sampling results were either not detected above the laboratory detection limit or consistent with concentrations detected during background monitoring conducted between August 28th and 31st, Table 3 presents the analytical results for 23-hour samples collected at Station 5 and 6 during Week 55. The ST-5 sample was collected on October 24 th through 25 th, 2018 and the ST-6 sample was collected on October 22 nd through 23 rd, Sampling results were either not detected above the laboratory detection limit or consistent with concentrations detected during background monitoring conducted between August 28th and 31st, Site activities which were conducted at the Citizen Property during November 26 th through November 30 th, 2018 included the following: Material and equipment deliveries on Citizen Property General vehicular traffic site-wide throughout the monitoring period Maintenance of the barges and equipment Continued decon and demobilization of equipment off site Site activities which were conducted at the 4 th St Turning Basin Area of the Canal during November 26 th through November 30 th, 2018 included the following: Confirm elevation of Oleophilic clay and sand placed between existing bulkhead and installed sheet pile adjacent to Whole Foods Commence placement of gravel between existing bulkhead and installed sheet piles adjacent to Dykes Lumber
28 Gowanus Canal Superfund Site TB-4 Dredging and Capping Pilot Study Brooklyn, New York Daily Station Report TVOC/PM 10 (TRC Project No ) 11/26/ :30 AM - 11/26/ :45 PM Station 1 (Citizen Property near Construction Trailers) Max. 100 ppb Max. 14 ug/m 3 Avg. 6 ppb Avg. 8 ug/m 3 Station 2 (Citizen Property near Pad Area) Max. <1 ppb Max. 14 ug/m 3 Avg. <1 ppb Avg. 7 ug/m 3 Station 3 (Whole Foods Property NW Riverwalk Location) Max. 14 ppb Max. 36 ug/m 3 Avg. 3 ppb Avg. 6 ug/m 3 Station 4 (Whole Foods Property Central Riverwalk Location) Max. <1 ppb Max. <1 ug/m 3 Avg. <1 ppb Avg. <1 ug/m 3 Station 5 (Whole Foods Property near 3rd Avenue Bridge) Max. 39 ppb Max. 16 ug/m 3 Avg. 8 ppb Avg. 10 ug/m 3 Station 6 (Maritime Estates Property along Canal Fencing) Max. <1 ppb Max. <1 ug/m 3 Avg. <1 ppb Avg. <1 ug/m 3 Station 7 (386 3rd Avenue along Canal Fencing) Max. <1 ppb Max. <1 ug/m 3 Avg. <1 ppb Avg. <1 ug/m 3 TVOC Total Volatile Organic Compounds PM 10 Particulates as PM 10 Max. Maximum daily average (15 min. avg. TVOC / 15 min. avg. PM 10 ) Avg. Daily average (15 min. avg. TVOC / 15 min. avg. PM 10 ) Exc. Total # of averages which exceed the action level ( 1 ppm - TVOC / 150 ug/m3 - PM 10 )
29 Gowanus Canal Superfund Site TB-4 Dredging and Capping Pilot Study Brooklyn, New York Daily Station Report TVOC/PM 10 (TRC Project No ) 11/27/ :00 AM - 11/27/ :45 PM Station 1 (Citizen Property near Construction Trailers) Max. 265 ppb Max. 6 ug/m 3 Avg. 72 ppb Avg. 3 ug/m 3 Station 2 (Citizen Property near Pad Area) Max. <1 ppb Max. 5 ug/m 3 Avg. <1 ppb Avg. 3 ug/m 3 Station 3 (Whole Foods Property NW Riverwalk Location) Max. 5 ppb Max. 67 ug/m 3 Avg. <1 ppb Avg. 3 ug/m 3 Station 4 (Whole Foods Property Central Riverwalk Location) Max. <1 ppb Max. <1 ug/m 3 Avg. <1 ppb Avg. <1 ug/m 3 Station 5 (Whole Foods Property near 3rd Avenue Bridge) Max. <1 ppb Max. 8 ug/m 3 Avg. <1 ppb Avg. 3 ug/m 3 Station 6 (Maritime Estates Property along Canal Fencing) Max. <1 ppb Max. <1 ug/m 3 Avg. <1 ppb Avg. <1 ug/m 3 Station 7 (386 3rd Avenue along Canal Fencing) Max. <1 ppb Max. <1 ug/m 3 Avg. <1 ppb Avg. <1 ug/m 3 TVOC Total Volatile Organic Compounds PM 10 Particulates as PM 10 Max. Maximum daily average (15 min. avg. TVOC / 15 min. avg. PM 10 ) Avg. Daily average (15 min. avg. TVOC / 15 min. avg. PM 10 ) Exc. Total # of averages which exceed the action level ( 1 ppm - TVOC / 150 ug/m3 - PM 10 )
30 Gowanus Canal Superfund Site TB-4 Dredging and Capping Pilot Study Brooklyn, New York Daily Station Report TVOC/PM 10 (TRC Project No ) 11/28/ :00 AM - 11/28/ :45 PM Station 1 (Citizen Property near Construction Trailers) Max. 33 ppb Max. 6 ug/m 3 Avg. 21 ppb Avg. 2 ug/m 3 Station 2 (Citizen Property near Pad Area) Max. <1 ppb Max. 5 ug/m 3 Avg. <1 ppb Avg. 2 ug/m 3 Station 3 (Whole Foods Property NW Riverwalk Location) Max. 14 ppb Max. 24 ug/m 3 Avg. 4 ppb Avg. 7 ug/m 3 Station 4 (Whole Foods Property Central Riverwalk Location) Max. 33 ppb Max. 4 ug/m 3 Avg. 3 ppb Avg. 1 ug/m 3 Station 5 (Whole Foods Property near 3rd Avenue Bridge) Max. 77 ppb Max. 7 ug/m 3 Avg. 48 ppb Avg. 2 ug/m 3 Station 6 (Maritime Estates Property along Canal Fencing) Max. <1 ppb Max. <1 ug/m 3 Avg. <1 ppb Avg. <1 ug/m 3 Station 7 (386 3rd Avenue along Canal Fencing) Max. <1 ppb Max. <1 ug/m 3 Avg. <1 ppb Avg. <1 ug/m 3 TVOC Total Volatile Organic Compounds PM 10 Particulates as PM 10 Max. Maximum daily average (15 min. avg. TVOC / 15 min. avg. PM 10 ) Avg. Daily average (15 min. avg. TVOC / 15 min. avg. PM 10 ) Exc. Total # of averages which exceed the action level ( 1 ppm - TVOC / 150 ug/m3 - PM 10 )
31 Gowanus Canal Superfund Site TB-4 Dredging and Capping Pilot Study Brooklyn, New York Daily Station Report TVOC/PM 10 (TRC Project No ) 11/29/ :00 AM - 11/29/ :45 PM Station 1 (Citizen Property near Construction Trailers) Max. 33 ppb Max. 6 ug/m 3 Avg. 19 ppb Avg. 2 ug/m 3 Station 2 (Citizen Property near Pad Area) Max. <1 ppb Max. 5 ug/m 3 Avg. <1 ppb Avg. 2 ug/m 3 Station 3 (Whole Foods Property NW Riverwalk Location) Max. 14 ppb Max. 23 ug/m 3 Avg. 1 ppb Avg. 5 ug/m 3 Station 4 (Whole Foods Property Central Riverwalk Location) Max. <1 ppb Max. 5 ug/m 3 Avg. <1 ppb Avg. 2 ug/m 3 Station 5 (Whole Foods Property near 3rd Avenue Bridge) Max. 77 ppb Max. 9 ug/m 3 Avg. 73 ppb Avg. 3 ug/m 3 Station 6 (Maritime Estates Property along Canal Fencing) Max. 23 ppb Max. 7 ug/m 3 Avg. 9 ppb Avg. 1 ug/m 3 Station 7 (386 3rd Avenue along Canal Fencing) Max. <1 ppb Max. <1 ug/m 3 Avg. <1 ppb Avg. <1 ug/m 3 TVOC Total Volatile Organic Compounds PM 10 Particulates as PM 10 Max. Maximum daily average (15 min. avg. TVOC / 15 min. avg. PM 10 ) Avg. Daily average (15 min. avg. TVOC / 15 min. avg. PM 10 ) Exc. Total # of averages which exceed the action level ( 1 ppm - TVOC / 150 ug/m3 - PM 10 )
32 Gowanus Canal Superfund Site TB-4 Dredging and Capping Pilot Study Brooklyn, New York Daily Station Report TVOC/PM 10 (TRC Project No ) 11/30/ :00 AM - 11/30/ :00 PM Station 1 (Citizen Property near Construction Trailers) Max. <1 ppb Max. 13 ug/m 3 Avg. <1 ppb Avg. 7 ug/m 3 Station 2 (Citizen Property near Pad Area) Max. <1 ppb Max. 11 ug/m 3 Avg. <1 ppb Avg. 6 ug/m 3 Station 3 (Whole Foods Property NW Riverwalk Location) Max. <1 ppb Max. 64 ug/m 3 Avg. <1 ppb Avg. 21 ug/m 3 Station 4 (Whole Foods Property Central Riverwalk Location) Max. <1 ppb Max. 12 ug/m 3 Avg. <1 ppb Avg. 6 ug/m 3 Station 5 (Whole Foods Property near 3rd Avenue Bridge) Max. <1 ppb Max. 20 ug/m 3 Avg. <1 ppb Avg. 1 ug/m 3 Station 6 (Maritime Estates Property along Canal Fencing) Max. <1 ppb Max. 14 ug/m 3 Avg. <1 ppb Avg. 7 ug/m 3 Station 7 (386 3rd Avenue along Canal Fencing) Max. <1 ppb Max. <1 ug/m 3 Avg. <1 ppb Avg. <1 ug/m 3 TVOC Total Volatile Organic Compounds PM 10 Particulates as PM 10 Max. Maximum daily average (15 min. avg. TVOC / 15 min. avg. PM 10 ) Avg. Daily average (15 min. avg. TVOC / 15 min. avg. PM 10 ) Exc. Total # of averages which exceed the action level ( 1 ppm - TVOC / 150 ug/m3 - PM 10 )
33 Figure 1 Gowanus Canal Superfund Site -TB4 Dredging and Capping Pilot Program TVOC Monitoring Data - Week 60 TVOC MAX Station 11/26/ /27/ /28/ /29/ /30/2018 ST TVOC 100 Action Level 265 = 1000 ppb 33(15 Min Avg) 33 <1 ST <1 <1 <1 <1 <1 ST <1 850 ST-4 <1 <1 33 <1 <1 800 ST-5 39 < <1 750 ST-6 ppb <1 <1 <1 23 <1 700 ST-7 (v/v) <1 <1 <1 <1 < * (TVOC) Total 500 Violate Organic Compounds /26/ /27/ /28/ /29/ /30/2018 ST-1 ST-2 ST-3 ST-4 ST-5 ST-6 ST-7 TVOC AVG 1000 TVOC Action Level = 1000 ppb (15 Min Avg) Station 11/26/ /27/ /28/ /29/ /30/ ST <1 ST <1 <1 <1 <1 <1 ST-3 ppb <1 4 1 <1 600 ST-4 (v/v) 550 <1 <1 3 <1 <1 ST < <1 ST <1 <1 <1 9 <1 400 ST <1 <1 <1 <1 < /26/ /27/ /28/ /29/ /30/2018 ST-1 ST-2 ST-3 ST-4 ST-5 ST-6 ST-7
34 Figure 2 Gowanus Canal Superfund Site - TB4 Dredging and Capping Pilot Program PM 10 Monitoring Data - Week Action Level = 150 ug/m 3 (15 Min Avg) Station /26/ /27/ /28/ /29/ /30/ ST ug/m ST ST ST-4 <1 < ST ST-6 40,1 <1 < ST-7 30 <1 <1 <1 <1 < PM 10 MAX 11/26/ /27/ /28/ /29/ /30/2018 ST-1 ST-2 ST-3 ST-4 ST-5 ST-6 ST-7 PM 10 Avg. 150 Action Level = 150 ug/m 3 (15 Min Avg) Station 9011/26/ /27/ /28/ /29/ /30/2018 ug/m ST ST ST ST-4 50 <1 < ST ST-6 <1 <1 < ST-7 <1 <1 <1 <1 < /26/ /27/ /28/ /29/ /30/2018 ST-1 ST-2 ST-3 ST-4 ST-5 ST-6 ST-7

35 Station Site Description 3 Whole Foods Property NW Riverwalk Location 4 Whole Foods Property Central Riverwalk Location 5 Whole Foods Property near 3rd Avenue Bridge 6 Maritime Estates Property along Canal Fencing rd Avenue along Canal Fencing FIGURE 3 Gowanus Canal Superfund Site-TB4 Dredging and Capping Pilot Program
36 Table 2: Gowanus Canal Superfund Site TB4 Dredging and Capping Pilot Program Week 54 VOCs Results: October 15th through 16th and October 18th through 19th (Co located) Sample ID Laboratory ID Date Sampled Location ST 1 VOC ST 7A VOC J J /15/18 07:00 10/16/18 06:00 10/18/18 11:00 10/19/18 10:00 Station 1 Station 7 ST 7B VOC J /18/18 11:00 10/19/18 10:00 Station 7 Duplicate Relative Percent Difference Station 7 Pair VOCs TO 15 ppbv ug/m 3 ppbv ug/m3 ppbv ug/m3 Acetone % Benzene % Benzyl chloride <0.040 <0.21 <0.035 <0.18 <0.035 <0.18 NC Bromodichloromethane <0.040 <0.27 <0.035 <0.24 <0.035 <0.24 NC Bromoform <0.040 <0.41 <0.035 <0.36 <0.035 <0.36 NC Bromomethane <0.040 <0.16 <0.035 <0.14 <0.035 <0.14 NC 1,3 Butadiene <0.040 <0.088 <0.035 <0.078 <0.035 <0.078 NC 2 Butanone (MEK) <1.6 <4.7 <1.4 <4.1 <1.4 <4.1 NC Carbon Disulfide <0.40 <1.2 <0.35 <1.1 <0.35 <1.1 NC Carbon Tetrachloride % Chlorobenzene <0.040 <0.18 <0.035 <0.16 <0.035 <0.16 NC Chloroethane <0.040 <0.11 <0.035 <0.093 <0.035 <0.093 NC Chloroform <0.040 <0.2 <0.035 <1.7 <0.035 <1.7 NC Chloromethane % Cyclohexane <0.040 <0.14 <0.035 <0.12 <0.035 <0.12 NC Dibromochloromethane <0.040 <0.34 <0.035 <0.30 <0.035 <0.30 NC 1,2 Dibromoethane (EDB) <0.040 <0.31 <0.035 <0.27 <0.035 <0.27 NC 1,2 Dichlorobenzene <0.040 <0.24 <0.035 <0.21 <0.035 <0.21 NC 1,3 Dichlorobenzene <0.040 <0.24 <0.035 <0.21 <0.035 <0.21 NC 1,4 Dichlorobenzene <0.040 <0.24 <0.035 <0.21 <0.035 <0.21 NC Dichlorodifluoromethane (Freon 12) % 1,1 Dichloroethane <0.040 <0.16 <0.035 <0.14 <0.035 <0.14 NC 1,2 Dichloroethane <0.040 <0.16 <0.035 <0.14 <0.035 <0.14 NC 1,1 Dichloroethylene <0.040 <0.16 <0.035 <0.14 <0.035 <0.14 NC cis 1,2 Dichloroethylene <0.040 <0.16 <0.035 <0.14 <0.035 <0.14 NC trans 1,2 Dichloroethylene <0.040 <0.16 <0.035 <0.14 <0.035 <0.14 NC 1,2 Dichloropropane <0.040 <0.18 <0.035 <0.16 <0.035 <0.16 NC cis 1,3 Dichloropropene <0.040 <0.18 <0.035 <0.16 <0.035 <0.16 NC trans 1,3 Dichloropropene <0.040 <0.18 <0.035 <0.16 <0.035 <0.16 NC 1,2 Dichloro 1,1,2,2 tetrafluoroethane (Freon 114) <0.040 <0.28 <0.035 <0.25 <0.035 <0.25 NC 1,4 Dioxane <0.40 <1.4 <0.35 <1.3 <0.35 <1.3 NC Ethanol % Ethyl Acetate <0.080 <0.29 <0.070 <0.25 <0.070 <0.25 NC Ethylbenzene <0.035 < NC 4 Ethyltoluene <0.040 < % Heptane <0.035 < NC Hexachlorobutadiene <0.040 <0.43 <0.035 <0.37 <0.035 <0.37 NC Hexane <1.6 <5.6 <1.4 <4.9 <1.4 <4.9 NC 2 Hexanone (MBK) <0.040 <0.16 <0.035 <0.14 <0.035 <0.14 NC Isopropanol <1.6 <3.9 <1.4 <3.4 <1.4 <3.4 NC Methyl tert Butyl Ether (MTBE) <0.040 <0.14 <0.035 <0.13 <0.035 <0.13 NC Methylene Chloride <0.40 <1.4 <0.35 <1.2 <0.35 <1.2 NC 4 Methyl 2 pentanone (MIBK) <0.040 <0.16 <0.035 <0.14 <0.035 <0.14 NC Naphthalene <0.080 <0.42 <0.070 <0.37 <0.070 <0.37 NC Propene <1.6 <2.8 <1.4 <2.4 <1.4 <2.4 NC Styrene <0.040 <0.17 <0.035 <0.15 <0.035 <0.15 NC 1,1,2,2 Tetrachloroethane <0.040 <0.27 <0.035 <0.24 <0.035 <0.24 NC Tetrachloroethylene % Tetrahydrofuran <0.040 <0.12 <0.035 <0.10 <0.035 <0.10 NC Toluene % 1,2,4 Trichlorobenzene <0.040 <0.30 <0.035 <0.26 <0.035 <0.26 NC 1,1,1 Trichloroethane <0.040 <0.22 <0.035 <0.19 <0.035 <0.19 NC 1,1,2 Trichloroethane <0.040 <0.22 <0.035 <0.19 <0.035 <0.19 NC Trichloroethylene <0.040 <0.21 <0.035 <0.19 <0.035 <0.19 NC Trichlorofluoromethane (Freon 11) % 1,1,2 Trichloro 1,2,2 trifluoroethane (Freon 113) <0.16 <1.2 <0.14 <1.1 <0.14 <1.1 NC 1,2,4 Trimethylbenzene % 1,3,5 Trimethylbenzene <0.040 < % Vinyl Acetate <0.80 <2.8 <0.70 <2.5 <0.70 <2.5 NC Vinyl Chloride <0.040 <0.10 <0.035 <0.090 <0.035 <0.090 NC m&p Xylene % o Xylene % Notes: Values in bold indicate detected concentrations Results for the following compounds may be influenced by laboratory derived contamination: acetone, ethanol, methylene chloride and isopropanol Relative Percent Difference (RPD) calculated using the following equation: RPD = X1 X2 /[(X1+X2)/2] where: X1 = original sample, X2 = duplicate sample NC: RPD not calcuable due to a non detect result in one or both co located sample
37 Table 3: Gowanus Canal Superfund Site TB4 Dredging and Capping Pilot Program Week 55 VOCs Results: October 22nd through 23rd and October 24th through 25th Sample ID Laboratory ID Date Sampled Location ST 5 VOC J /24/18 11:00 10/25/18 10:00 Station 5 ST 6 VOC J /22/18 09:00 10/23/18 08:00 Station 6 VOCs TO 15 ppbv ug/m3 ppbv ug/m3 Acetone Benzene Benzyl chloride <0.035 <0.18 <0.035 <0.18 Bromodichloromethane <0.035 <0.24 <0.035 <0.24 Bromoform <0.035 <0.36 <0.035 <0.36 Bromomethane <0.035 <0.14 <0.035 <0.14 1,3 Butadiene <0.035 <0.078 <0.035 < Butanone (MEK) <1.4 <4.1 <1.4 <4.1 Carbon Disulfide <0.35 <1.1 <0.35 <1.1 Carbon Tetrachloride Chlorobenzene <0.035 <0.16 <0.035 <0.16 Chloroethane <0.035 <0.093 <0.035 <0.093 Chloroform <0.035 <0.17 <0.035 <0.17 Chloromethane Cyclohexane <0.035 <0.12 <0.035 <0.12 Dibromochloromethane <0.035 <0.30 <0.035 <0.30 1,2 Dibromoethane (EDB) <0.035 <0.27 <0.035 <0.27 1,2 Dichlorobenzene <0.035 <0.21 <0.035 <0.21 1,3 Dichlorobenzene <0.035 <0.21 <0.035 <0.21 1,4 Dichlorobenzene <0.035 <0.21 <0.035 <0.21 Dichlorodifluoromethane (Freon 12) ,1 Dichloroethane <0.035 <0.14 <0.035 <0.14 1,2 Dichloroethane <0.035 <0.14 <0.035 <0.14 1,1 Dichloroethylene <0.035 <0.14 <0.035 <0.14 cis 1,2 Dichloroethylene <0.035 <0.14 <0.035 <0.14 trans 1,2 Dichloroethylene <0.035 <0.14 <0.035 <0.14 1,2 Dichloropropane <0.035 <0.16 <0.035 <0.16 cis 1,3 Dichloropropene <0.035 <0.16 <0.035 <0.16 trans 1,3 Dichloropropene <0.035 <0.16 <0.035 <0.16 1,2 Dichloro 1,1,2,2 tetrafluoroethane (Freon 114) <0.035 <0.25 <0.035 <0.25 1,4 Dioxane <0.35 <1.3 <0.35 <1.3 Ethanol Ethyl Acetate <0.070 <0.25 Ethylbenzene Ethyltoluene <0.035 <0.17 <0.035 <0.17 Heptane <0.035 <0.14 <0.035 <0.14 Hexachlorobutadiene <0.035 <0.37 <0.035 <0.37 Hexane <1.4 <4.9 <1.4 <4.9 2 Hexanone (MBK) <0.035 < Isopropanol <1.4 <3.4 <1.4 <3.4 Methyl tert Butyl Ether (MTBE) <0.035 <0.13 <0.035 <0.13 Methylene Chloride <0.35 <1.2 4 Methyl 2 pentanone (MIBK) <0.035 <0.14 <0.035 <0.14 Naphthalene <0.070 <0.37 <0.070 <0.37 Propene <1.4 <2.4 <1.4 <2.4 Styrene <0.035 <0.15 <0.035 <0.15 1,1,2,2 Tetrachloroethane <0.035 <0.24 <0.035 <0.24 Tetrachloroethylene Tetrahydrofuran <0.035 <0.10 <0.035 <0.10 Toluene ,2,4 Trichlorobenzene <0.035 <0.26 <0.035 <0.26 1,1,1 Trichloroethane <0.035 <0.19 <0.035 <0.19 1,1,2 Trichloroethane <0.035 <0.19 <0.035 <0.19 Trichloroethylene <0.035 <0.19 <0.035 <0.19 Trichlorofluoromethane (Freon 11) ,1,2 Trichloro 1,2,2 trifluoroethane (Freon 113) <0.14 <1.1 <0.14 <1.1 1,2,4 Trimethylbenzene <0.035 <0.17 1,3,5 Trimethylbenzene <0.035 <0.17 <0.035 <0.17 Vinyl Acetate <0.70 <2.5 <0.70 <2.5 Vinyl Chloride <0.035 <0.090 <0.035 <0.090 m&p Xylene o Xylene <0.035 <0.15 Notes: Values in bold indicate detected concentrations Results for the following compounds may be influenced by laboratory derived contamination: acetone, ethanol, methylene chloride and isopropanol
38 Table 1 Week 60 Summary of Additional Periodic (Daily) Monitoring Data November 26 th, 2018 Station Id Time Formaldehyde (CHO) (ppb)* Hydrogen Sulfide (H2S) (ppb)* Ammonia (NH3) (ppm)** ST-1 7:30 <50 <3 <1.0 14:00 <50 <3 <1.0 ST-2 7:35 <50 <3 <1.0 14:10 <50 <3 <1.0 ST-3 7:50 <50 <3 <1.0 14:30 <50 <3 <1.0 ST-4 8:00 <50 <3 <1.0 14:40 <50 <3 <1.0 ST-5 8:15 <50 <3 <1.0 14:50 <50 <3 <1.0 ST-6 8:30 <50 <3 <1.0 15:10 <50 <3 <1.0 ST-7 8:50 <50 <3 <1.0 15:30 <50 <3 <1.0 November 27 th, 2018 Station Id Time Formaldehyde (CHO) (ppb)* Hydrogen Sulfide (H2S) (ppb)* Ammonia (NH3) (ppm)** ST-1 8:00 <50 <3 <1.0 15:00 <50 <3 <1.0 ST-2 8:10 <50 <3 <1.0 15:10 <50 <3 <1.0 ST-3 8:30 <50 <3 <1.0 15:40 <50 <3 <1.0 ST-4 8:40 <50 <3 <1.0 15:50 <50 <3 <1.0 ST-5 8:50 <50 <3 <1.0 16:10 <50 <3 <1.0 ST-6 9:10 <50 <3 <1.0 16:20 <50 <3 <1.0 ST-7 9:30 <50 <3 <1.0 17:00 <50 <3 <1.0
39 Table 1 Week 60 Summary of Additional Periodic (Daily) Monitoring Data November 28 th, 2018 Station Id Time Formaldehyde (CHO) (ppb)* Hydrogen Sulfide (H2S) (ppb)* Ammonia (NH3) (ppm)** ST-1 8:00 <50 <3 <1.0 13:30 <50 <3 <1.0 ST-2 8:10 <50 <3 <1.0 13:40 <50 <3 <1.0 ST-3 8:30 <50 <3 <1.0 14:10 <50 <3 <1.0 ST-4 8:40 <50 <3 <1.0 14:20 <50 <3 <1.0 ST-5 8:50 <50 <3 <1.0 14:30 <50 <3 <1.0 ST-6 9:10 <50 <3 <1.0 14:50 <50 <3 <1.0 ST-7 9:40 <50 <3 <1.0 15:30 <50 <3 <1.0 November 29 th, 2018 Station Id Time Formaldehyde (CHO) (ppb)* Hydrogen Sulfide (H2S) (ppb)* Ammonia (NH3) (ppm)** ST-1 7:30 <50 <3 <1.0 14:30 <50 <3 <1.0 ST-2 7:40 <50 <3 <1.0 14:40 <50 <3 <1.0 ST-3 7:55 <50 <3 <1.0 15:00 <50 <3 <1.0 ST-4 8:00 <50 <3 <1.0 15:10 <50 <3 <1.0 ST-5 8:10 <50 <3 <1.0 15:20 <50 <3 <1.0 ST-6 8:25 <50 <3 <1.0 15:40 <50 <3 <1.0 ST-7 8:40 <50 <3 <1.0 16:10 <50 <3 <1.0
40 Table 1 Week 60 Summary of Additional Periodic (Daily) Monitoring Data November 30 th, 2018 Station Id Time Formaldehyde (CHO) (ppb)* Hydrogen Sulfide (H2S) (ppb)* Ammonia (NH3) (ppm)** ST-1 7:30 <50 <3 <1.0 15:00 <50 <3 <1.0 ST-2 7:40 <50 <3 <1.0 15:05 <50 <3 <1.0 ST-3 7:50 <50 <3 <1.0 15:15 <50 <3 <1.0 ST-4 7:55 <50 <3 <1.0 15:20 <50 <3 <1.0 ST-5 8:00 <50 <3 <1.0 15:25 <50 <3 <1.0 ST-6 8:10 <50 <3 <1.0 15:30 <50 <3 <1.0 ST-7 8:30 <50 <3 <1.0 15:45 <50 <3 <1.0 *(ppb) Indicates results reported in parts per billion ** (ppm) Indicates results reported in parts per million
 Temperature ( o F) SSE 1.71 47.0 November 27 th, 2018 ** Wind Direction ( o ) Wind Speed (mph) Temperature ( o F) WSW 3.99 46.")
41 Gowanus Canal Superfund Site TB-4 Dredging and Capping Pilot Study Brooklyn, New York Meteorological Summary November 26 th through November 30 th, 2018 November 26 th, 2018 * Wind Direction ( o ) Wind Speed (mph) Temperature ( o F) SSE November 27 th, 2018 ** Wind Direction ( o ) Wind Speed (mph) Temperature ( o F) WSW November 28 th, 2018 ** Wind Direction ( o ) Wind Speed (mph) Temperature ( o F) WSW November 29 th, 2018 ** Wind Direction ( o ) Wind Speed (mph) Temperature ( o F) W November 30 th, 2018 *** Wind Direction ( o ) Wind Speed (mph) Temperature ( o F) ESE * Monday s meteorological data represents an average for the time period of 06:30 to 23:45. ** Tuesday s, Wednesday s, and Thursday s meteorological data represents averages for the time period of 00:00 to 23:45. *** Friday s meteorological data represents an average for the time period of 00:00 to 17:00.
42 WILSON IHRIG WEEKLY NOISE AND VIBRATION MONITORING REPORT

43 WI # MEMORANDUM December 3, 2018 To: William Lee/ de maximis, inc. Kirsten Meyers / TRC From: Silas Bensing, Ani Toncheva / Wilson Ihrig Subject: Gowanus Canal 4th Street Turning Basin Dredging and Capping Pilot Study, Weekly Noise Monitoring Report, November, 2018 Noise Monitoring Locations Figure 1 shows the noise monitoring locations. NM-1 is installed at a light pole on the north side of TB4 and is approximately 25 feet from the north edge of the canal. NM-2 is installed at the existing guard rail on the south side of TB4, approximately 4 feet from the south edge of the canal. Photos 1 and 2 show the recent field conditions at the monitors. Noise Monitoring Results Figures 2 through 11 present the hourly Leq noise levels compared with the noise thresholds discussed in the noise monitoring plan 1. Commercial and Industrial land uses are assigned an hourly Leq noise limit of 80 dba for Daytime and Evening time periods. The average baseline noise measured in the project area in 2015 are also shown for reference 2. 1 Wilson Ihrig. Gowanus Canal 4 th Street Turning Basin Dredging and Capping Pilot Study Noise and Vibration Monitoring Plan. California: prepared for Gowanus Canal Remedial Design Group, DRAFT May Wilson Ihrig. Gowanus Canal Remedial Design Project RTA-1 Noise and Vibration Baseline Report. California: prepared for Geosyntec Consultants Inc., October 2015.


44 Gowanus Canal TB4 Pilot Study Phase 2 Weekly Monitoring Report Figure 1: Long-term Noise and Vibration Monitoring Locations for Gowanus TB4 Dredging and Capping Pilot Study Photo 1: Noise Monitoring Location NM-1 (26 September 2017) Photo 2: Noise Monitoring Location NM-2 (25 September 2017) 2
45 Gowanus Canal TB4 Pilot Study Phase 2 Weekly Monitoring Report Figure 2: North Monitor NM-1 on Monday Figure 3: North Monitor NM-1 on Tuesday 3
46 Gowanus Canal TB4 Pilot Study Phase 2 Weekly Monitoring Report Figure 4: North Monitor NM-1 on Wednesday Figure 5: North Monitor NM-1 on Thursday 4

47 Gowanus Canal TB4 Pilot Study Phase 2 Weekly Monitoring Report Figure 6: North Monitor NM-1 on Friday Figure 7: South Monitor NM-2 on Monday 5
48 Gowanus Canal TB4 Pilot Study Phase 2 Weekly Monitoring Report Figure 8: South Monitor NM-2 on Tuesday Figure 9: South Monitor NM-2 on Wednesday 6
49 Gowanus Canal TB4 Pilot Study Phase 2 Weekly Monitoring Report Figure 10: South Monitor NM-2 on Thursday Figure 11: South Monitor NM-2 on Friday Wilson Ihrig Weekly Noise and Vibration Report November 2018.docx 7
50 AHRS WEEKLY REPORT (NO ACTIVITIES DURING WEEK)
51 WATER TREATMENT SYSTEM MONITORING LABORATORY ANALYTICAL DATA (NO ACTIVITIES DURING WEEK)
52 CUMULATIVE DREDGED MATERIAL CHART (NO ACTIVITIES DURING WEEK)