Sustainable Urban Transport in Shanghai - Integrated Assessment for Shanghai Urban
|
|
|
- Christopher Austin
- 5 years ago
- Views:
Transcription
1 Sustainable Urban Transport in Shanghai - Integrated Assessment for Shanghai Urban Transport Changhong CHEN Shanghai Academy of Environmental Sciences Workshop on Climate Change Mitigation in the Transport Sector May, 2006
2 Outline Background Indicators and Evaluation Model Some Detail Analysis Conclusions
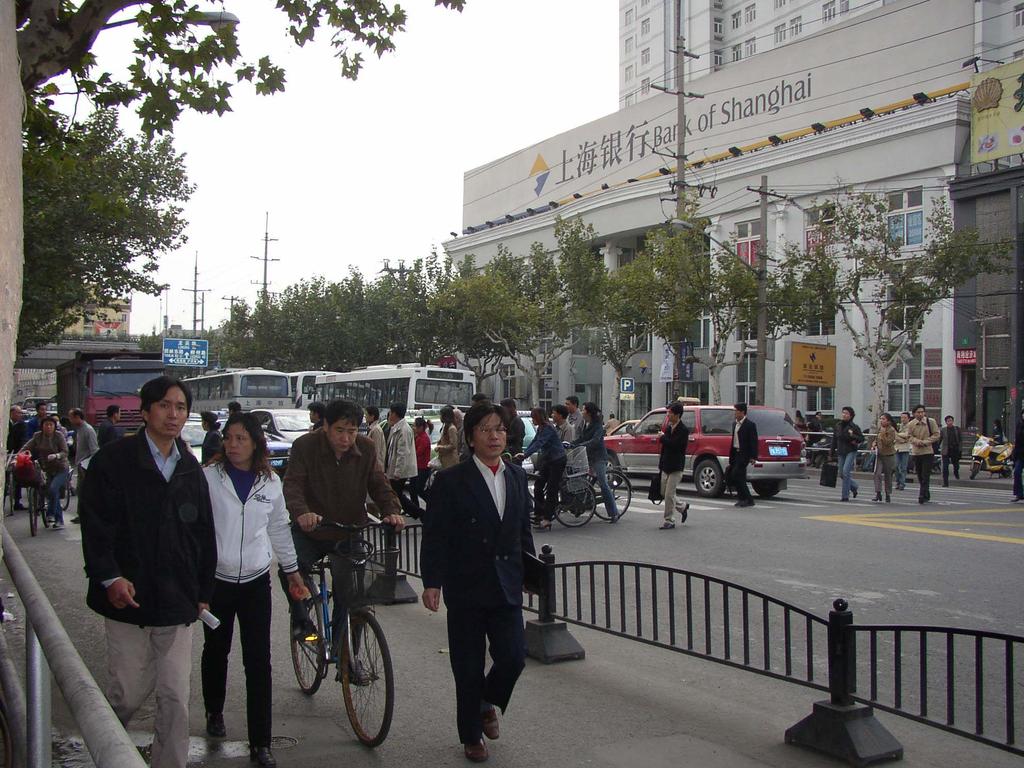
3 Background The fast growth of economics and income drive rapid growth of vehicle populations in China s cities Shanghai is the fifth largest mega city in the world with some population of more than 18 millions. The rapid growth of vehicle population, and far behind environmental policies on vehicle emission control, leading to a high emission from vehicles. Emission increase and air quality degradation by transport sector capture lots of concern. The sustainable urban transport and better ter air quality is the main task of Shanghai and big cities in China
4 Background Tons of studies have been done in the past years deal with sustainable development UN Division for Sustainable Development UN Statistics Division OECD model: The Pressure-State State-Response framework (PSR( PSR) UNSTAT: Framework for Indicators of Sustainable Development (FISD). The World Bank indicators, e.g.: integrated environment, society, economy, and organizations into one system. Many frameworks and indicators existed, but difficult to play. The local government interests: Historical story? Why the situation like that? Trend in future and policies recommends?
5 Indicator Pyramid Structure Main Users Headline indicator high aggregation Integrated evaluation Decision maker Sector system medium aggregation Create Group Indicators: Social Economic Indicator, Transportation Indicator, Air Quality Indicator Policy and System analysis Basic indicators low aggregation Raw data and statistics Collection of Detailed Data in different field: GDP, Population, Income, Land use, road length, vehicle numbers, type of vehicles, transport modal split, vehicle mileage travelled, vehicle fuel use, vehicle emissions, transportation volume, traffic safety, congestion, average speed, air quality, etc Identification Field Related: Social Economic Data, Transportation Data, Air Quality Data Scientists Source: Lee Schipper, 2004
6 Interaction of indicators 450 Economic and population growth GDP per capita Income per capita Others Income per capita VMT and trip Demand Transport system Vehicle Population increase Vehicle population increase Road construction Transportation modal split Income per capita 350 Transport saturation Air quality degadation 300 Integrated Assessment of sustainability of transport Environmental issues Vehicle emission and air quality degradation Income per capita Air quality improvement
7 Questions before building up your model 1. Purpose of designed system: Providing a tool to decision maker for integrate evaluation of sustainable transport What-if scenario analysis 2. System characteristic: Complex and comprehensive system One indicator can be a pre- and co-constrain of the others 3. Fields covered: social economics, transport, environment 4. Driving force: population, GDP growth
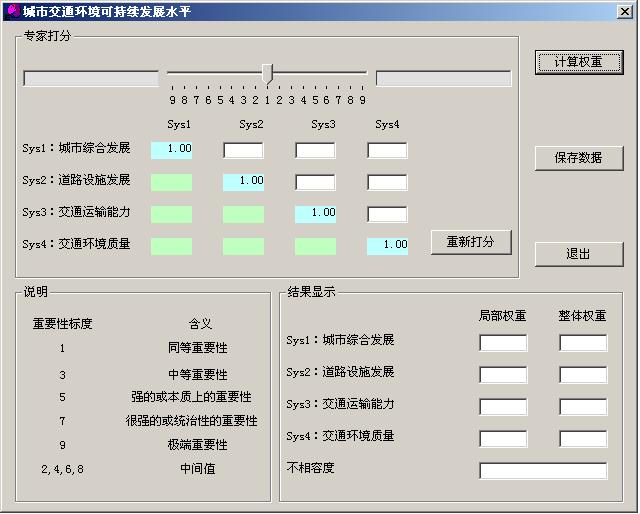
8 Questions before building up your 5. Target of sustainability: is a combination of indicators Definition of sustainability Economics, transport, air quality 6. System structure: indicators, sub-field, field, target 7. Data source and quality control: Statistics, Public Security, Environmental Department, etc. Is data comparable? 8. Weighting indicators: model Analytical hierarchy process (AHP) Others
9 Integrated indicator system for Shanghai Urban Transport 1. Basic indicators: 38 indicators from Indicator matrix: Year Indicators = Pyramid system structure: 1) Top layer 2) 4 sectors: social, transport facility, transport ability, Environment quality 3) 11 Status: economics, population, land use, traffic safety, road construction, transport development, transport model spilt, air quality, noise, vehicle emission std., emission from vehicles 4) Base layer with 38 indicator: some raw data + calculated data 5) Raw data layer: from statistics and measurement 3. Indicator weighting approach: Expert choice model: Analysis Hierarchy Process (AHP)
10 Integrated indicator system for 4. Driving force: Population GDP growth Shanghai Urban Transport 5. Constrain indicators: Land use/road density The cap of road area Vehicle population Vehicle emission, air quality and noise vary with vehicles Comfort of transport = F ( transport facility, speed, convenient, smooth, air quality and noise, and...) Air quality (target) The cap of vehicle emissions, totally or by types
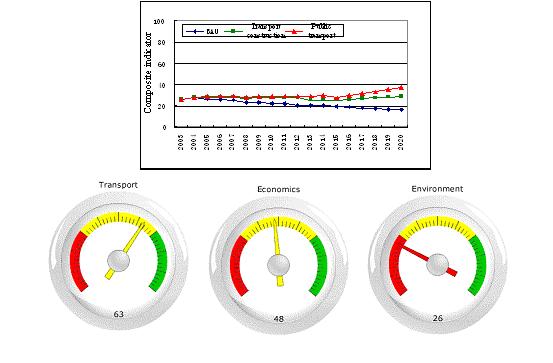
11 Integrated indicator system for Shanghai Urban Transport 6. Policy analysis: BAU: Business as usual scenario Sce. 1: Road construction based on local urban transport plan (LUTP) Sce. 2 = Sce. 1 + public transit system (subway, bus system) from LUTP Sce. 3 = Sce. 2 + Sce. 1 + Vehicle emission std. and IM program Sce. 4 = Sce.3 + fuel qualities 7. Models used in the system: Vehicle population model v.s. model split International vehicle emission (IVE) model Air quality model


12 Sustainable Urban Transport Evaluation Model Atmospheric Environment Institute Shanghai Academy of Environmental Sciences
13

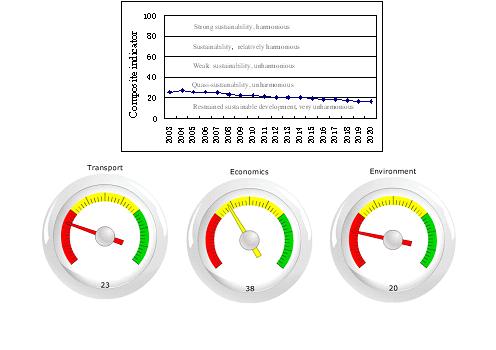
14 Sustainable Status of Urban Transport in Shanghai Sustainable Un-sustainable
15 Economics vs. Vehicle population, Vehicle ownership, y = x R 2 = y = x R 2 = GDP per capita (2000'price), USD per capita
16 Motorization status in Shanghai, Car period Bicycle period Moped period GDP per capita,usd/person (00's price)


17 Transport Investment Billion USD Transport investment and road system Road length, km Road area, s.q. km D:\Changhong CHEN\ 对外合作 \2 壳牌基金会 \ 上海项目 \1 研究项目 \SC_ 交通可持续发展指标 \ 报告 \ 基础数据 \ 交通建设投资 _E_01.xls

18 Growth of Vehicle Population in Shanghai, E:\Changhong CHEN\ 对外合作 \ 能源基金会 \ 交通项目 \ 基础数据 \ 机动车统计报表.xls
19 Accomplishment in road constructions Avg. Width of Road Avg. Width of Roadway Avg. Width of bicycle lane meters meters meters
20 Accomplishment in road constructions Road area per vehicle,m 2 /vehicle
21
22 Urban Air Qualities NOx SO 浓度, mg/m3 D:\Changhong CHEN\ 上海市社会经济指标 \ 环境空气质量 \ 大气监测月平均 _ 修改稿 _ 潘汉生.xls
23 Vehicle pollutions Vehicle pollutions Hongmei Rd. Siping Rd. Jia-Song Xinhua Rd. Zhongshan Park Beiqu Rd. Shanghai Stadium Wai-Qing-Song Guangzhong Rd. Highest hourly NOx concentration, mg/m3 Wusong Rd. Beijing Rd. West Jiangsu Rd. Yan an Rd. East Wuzhong Rd. Pudong Av. Century Av. Yuanshen Rd. Zhaojiabang Rd. Yan an Rd. East Jiangsu Rd. Hongmei Rd. Guangzhong Rd. Wusong Rd. Siping Rd. Century Av. Hongmei Rd. Jiangsu Rd. Yan an Rd. East Zhongshan Park Shanghai Stadium Guangzhong Rd. Pudong Av. Xinhua Rd. Wusong Rd. Zhaojiabang Rd. Beiqu Rd. Siping Rd. Jia-Song Beijing Rd. West Wuzhong Rd. Yuanshen Rd. Wai-Qing-Song Highest hourly PM10 concentration, mg/m3 Highest hourly CO concentration, mg/m3 Xinhua Rd. Zhongshan Park Century Av. Beijing Rd. West Jia-Song Beiqu Rd. Pudong Av. Wuzhong Rd. Shanghai Stadium Wai-Qing-Song Yuanshen Rd. Zhaojiabang Rd.

24 Trends of NOx & PM Emission Intensity, NOx 排放强度变化趋势 Trend of NOx Emission Intensity PM 排放强度变化趋势 Trend of PM Emission Intensity

25 NOx pollution in future

26 PM pollution in future
27
28
29
30 Conclusions (1/2) Fast growth of economic and traffic demand bring great pressure to transport and environment in Shanghai since 2003 Population highly congregated in city center push Shanghai as a secondary crowded city in transport in China The way of narrow down the bicycle lanes obviously slow down vehicle speed More frequently acceleration and deceleration are creasing the burden of urban air qualities More citizens will expose to high lever of air pollution caused by vehicle emissions, particularly near by the traffic corridor, if without any further control
31 Conclusions (2/2) Lots of emission control policies paid on new LDV, however, IM program, fuel quality, and emission from HDV catch up the government attention Environmental policies and actions for vehicle emission control in Shanghai is obviously far behind Beijing and Guangzhou city in China in recent years A sustainable urban transport in Shanghai needs a well plan to provide a better service for different kinds of traffic demands Fast and large volume of public transit including subways, bus system,.
32 Thank you