Future Climate Change in Southeast Asia and extreme events
|
|
|
- Nickolas McGee
- 5 years ago
- Views:
Transcription
1 Future Climate Change in Southeast Asia and extreme events Prof. Dr. Edvin Aldrian (LA, Chapter 14) Director of Center for Research and Development BMKG Indonesia Yann Arthus-Bertrand / Altitude Presented at the Workshop for weather presenters: communicating the science of climate change, Hanoi, 29 September 2015 BMKG
2 Outline Global changes challanges Human influences on climate Attribution of climate change Global Climate parameter changes Regional changes of Southeast Asia


3 Rockström, et al Planetary boundaries:exploring the safe operating space for humanity. Ecology and Society 14(2): 32 3
4 Population, wealth and emission The future of the climate system (and our survival) depends on our ability to decouple future emissions from the other two factors: population and economic growth Raupach et al. (2007, PNAS)


")
5 Relationship between income and emission Annual income per head (1985 $) Stern Report 2007
6 POPULATION AND TECHNOLOGY: MAIN SOURCE Rapid development of population from homo sapiens causes the increase of natural greenhouse gasses such as water vapor due to daily respiration Human population also increase the content of other greenhouse gasses due to the need of consumption and energy. Industrialization and the advancement of technology require inevitably large energy source and the large accumulation of industrial waste to environment Almost all primary industrial processes cannot rid of the energy supply which notably provided from the source of energy from fossil fuels.
7 Human and Carbon Major staple: Carbohydrate Fat and protein as carbon chains Human body from gnetic scale to large structures (from hair to toe) contain carbon compounds Cooking oil comprises of carbon chains The most valuable mineral (diamond) is pure carbon structure Human energy consumption comes from carbon composite (hydrocarbon) Carbon colourise our lifes on earth, why? Carbon has strong and neutral bonds with other chemical compounds
8 CARBON: FROM EARTH CRUST TO ACCUMULATION IN THE ATMOSPHERE The accumulation of greenhouse gasses is mostly due to the use of energy and land use land cover changes Carbon: from the earth crust explored energy dumped in the atmosphere Damped carbon are mostly CO 2 gas and a little CO. Unfortunately CO 2 is a greenhouse gas The accumulation of CO 2 in the atmosphere changes of atmospheric composition climate feedback impact to human life. Biofuel plants do not emit greenhouse gasses because they acquire carbon from their respiration in the atmosphere, no added carbon content.
9 Adaptation Mitigation : Coping the effect managing the unavoidable : Coping the cause avoiding the unmanagable GREENHOUSE GASSES Mitigation Change in Energy GLOBAL WARMING Water Cycle Change CLIMATE CHANGE Humidity Wind Cloud cover Rainfall Temperature Evaporation Forest Fire Drought Sea level rise Tornado Energy resource Landslide Flood PHYSICAL IMPACT Cyclone NON PHYSICAL IMPACT Malaria Infrastructure damage OPT Transportation system Water resource Tourism DBD Adaptation RESPONSES
; Daily Data (14.")
10 Reduction of GHG concentration during Nyepi Hindu day Nama Lokasi : Negara Singaraja Karangasem Bedugul Denpasar Koordinat : Metode & Frekuensi Data : 8º S, 114º E 8º 6 57,2 S, 115º 4 50,1 E 8º 21 53,4 S, 115º 36 39,0 E 8º 15 1,8 S, 115º 9 8,2 E Indirect Measurement (Sampling); Daily Data (14.00 WITA) Flask Sampler 8º 40 44,2 S, 115º 13 56,6 E Direct Measurement; Continuous Monitoring; (Data tiap 5 menit) Alat : Flask Sampler Flask Sampler Flask Sampler Data GRK : CO 2, CH 4 CO 2, CH 4 CO 2, CH 4 CO 2, CH 4 CO 2, N 2 O WolfPack & IRIS 4600


11 Reduction of GHG concentration during Nyepi Hindu day CO 2 (ppm) :00 2:24 4:48 7:12 9:36 12:00 14:24 16:48 19:12 21:36 Jam 8 Maret 9 Maret 10 Maret 11 Maret 12 Maret 13 Maret 14 Maret N 2 O (ppb) :00 2:24 4:48 7:12 9:36 12:00 14:24 16:48 19:12 21:36 Jam 8 Maret 9 Maret 10 Maret 11 Maret 12 Maret 13 Maret 14 Maret Average reduction 33%


")

12 Global Warming Major impacts: increase of surface temperature and sea level rise IPCC 2007 Human vs nature Natural: annual average of global temperature Anthropogenic: annual average of global temperature (c) Combine: natural and anthropogenic IPCC 2001


13 Earth temperature with and without human influences IPCC 2001


14 Key SPM Messages 19 Headlines on less than 2 Pages Summary for Policymakers ~14,000 Words 14 Chapters Atlas of Regional Projections 54,677 Review Comments by 1089 Experts 2010: 259 Authors Selected 2009: WGI Outline Approved 14
15 Observations Understanding Future 15
16 Warming in the climate system is unequivocal Human influence on the climate system is clear Limiting climate change will require substantial and sustained reductions of greenhouse gas emissions

 Precipitation Trend (mm/yr per")
17 IPCC 2013 IPCC 2013 Fig. SPM.1b Fig. SPM.2 Temperature Difference 1901 to 2012 based on trend ( C) Precipitation Trend (mm/yr per decade) Warming of the climate system is unequivocal


18 m projected SLR around Southeast Asia region IPCC 2013 Fig 13.20b
19 Warming of the climate system is unequivocal Fig. SPM.3
, methane")

20 Historical GHG Emission The atmospheric concentrations of carbon dioxide (CO 2 ), methane (CH 4 ), and nitrous oxide (N 2 O) have increased to levels unprecedented in at least the last 800,000 years.


")
21 GHG Historical Record in Ice Cores 400 ppm ppm ppm Ice Cores IPCC (2007)


22 Humans are changing the climate Human Influence is Clear


23 Climate Models Responses to Various Forcings Natural + Anthropogenic Natural CO2 forcing only Human Influence is Clear


24 (IPCC Fig 10.7)

25 Earth is in Radiative Imbalance Earth has been in radiative imbalance, with more energy from the sun entering than exiting the top of the atmosphere, since at least circa It is virtually certain that Earth has gained substantial energy from More than 90% of this extra heat is absorbed by the ocean (high confidence)

26
27 Projecting Future Climate Requires GHG Concentration Pathway For future climate projections, climate models require Emission Scenarios. Models in AR5 use Representative Concentration Pathway (RCP)

28 2 C world IPCC 2013, Fig. SPM.8

29 2 C world 4.5 C world IPCC 2013, Fig. SPM.8 Today we have a choice.


30 The window for action is rapidly closing 65% of our carbon budget compatible with a 2 C goal already used GtC Amount Remaining: 275 Limiting climate change will require GtC Total Carbon Budget: Amount Used substantial 790 and sustained reductions GtC : of greenhouse gas 515 emissions. CO 2 emissions in 2013: 9.9 GtC IPCC AR5 Synthesis Report


31 Human influence on the climate system is clear (IPCC Fig SPM.6)


 Arctic Sea-ice")
32 Temperature Ocean heat content Sea Level Snow Cover Glacier (IPCC Fig TS.1) Arctic Sea-ice extent


33 Wetter region gets more wetter and drier gets more drier since the second half of the 20 th century Extreme weather & climate events became more frequent (IPCC Fig SPM.2)


34 Glaciers and ice melting has accelerated in unprecedented speed in the last decade (IPCC Fig TS.3)
 in CMIP5 multimodel ensemble mean. Eighteen CMIP5 models were used.")

35 Tropical phenomena: Convergence Zones Rainfall Change (medium confidence) wet-get-wetter over CZ regions warmer-get-wetter over oceans Figure 14.9: Seasonal cycle of zonal-mean tropical precipitation change ( in RCP8.5 minus ) in CMIP5 multimodel ensemble mean. Eighteen CMIP5 models were used. Stippling indicates that more than 90% models agree on the sign of MME change. The red curve represents the meridional maximum of the climatological rainfall. Adapted from Huang et al. (2013). The seasonal-mean rainfall is projected to increase on the ITCZ equatorward flank Figure 14.8: Upper panel: Annual-mean precipitation percentage change ( P/P in green/gray shade and white contours at 20% intervals), and relative SST change (colour contours at intervals of 0.2 C; negative shaded) to the tropical (20S 20N) mean warming in RCP8.5 projections, shown as 23 CMIP5 model ensemble mean. More warming and rainfall at north of the equator. Less zonal SST gradient across the equatorial Pacific that contribute to the weakened Walker cells.

 Sub tropical climate will be")

36 EXPANSION OF TROPICS DUE TO CLIMATE CHANGE? 10 0 LU 10 0 LS PRISTINE CLIMATE WARMING CLIMATE tropical climate will be wetter(2009 and extreme year without dry season 2010) Sub tropical climate will be tropical climate like Faster water cycle circulation Extreme weather will be usual and more dry PERIOD(2003; 2005; 2007; 2008)


37 Tropical cyclones Regional Changes
38 Impact of global warming on the evolution of El Nino (higher frequency) (present decade and last 3 decade) BMKG


39 BMKG Impact of global warming on the evolution of El Nino (higher intensity)


40 Annex I: Atlas of Global and Regional Climate Projections Fig. AI.3 35 regions 42 global climate models 2 variables Temperature, Precipitation 4 scenarios Principles Governing IPCC Work RCPs 2.6, 4.5, 6.0, 8.5 (1998, 2003, 2006) 2 seasons temp: DJF, JJA (for temp) precip: AMJJAS, ONDJFM Maps for 3 time horizons , , reference period Fig. AI.4


41 Temperature Change Graph South Asia (5, 25, 50 75, 95 percentiles)
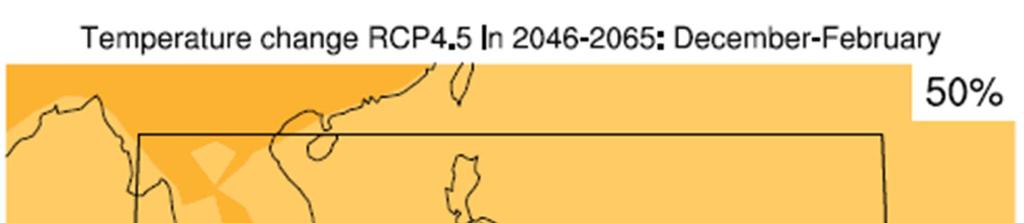


42 Temperature Change Map South Asia RCP4.5


43 Rainfall Change Graph South Asia (5, 25, 50 75, 95 percentiles)


44 Rainfall Change Maps South Asia - RCP4.5 October - March April - September

45 Further Information Yann Arthus-Bertrand / Altitude BMKG