Baltic Earth working group meeting on scenario simulations
|
|
|
- Lee Cobb
- 5 years ago
- Views:
Transcription
1 Baltic Earth working group meeting on scenario simulations H.E. Markus Meier 1,2 1 Swedish Meteorological and Hydrological Institute and 2 Stockholm University markus.meier@smhi.se

2 Baltic Earth


3 BALTEX successor programme lauched at the 7 th Study Conference on BALTEX, Borgholm, Öland, Sweden, June 2013 Vision of the new programme To achieve an improved Earth System understanding of the Baltic Sea region Interdisciplinary and international collaboration (study conferences, workshops, etc.) Holistic view on the Earth system of the Baltic Sea region, encompassing processes in the atmosphere, on land and in the sea and also in the anthroposphere Service to society in the respect that thematic assessments provide an overview over knowledge gaps which need to be filled (e.g. by funded projects) Education (summer schools) Inherits the BALTEX network of scientists and infrastructure
4 Baltic Earth Science Plan and Grand Challenges Suggested Grand Challenges Flexible science plan with a continuously on going definition of core research questions which are identified to be key scientific issues, so called Grand Challenges (GCs) New Grand Challenges will be identified at conferences and by using assessments of existing research by dedicated working groups. Grand Challenges are envisaged to be research foci for periods of about 3 4 years (then terminated or updated) The new programme will communicate with stakeholders and research funding agencies to promote funding relevant for the Grand Challenges International embedment (GEWEX?, Future Earth?, to be decided by ISSG by June 2014) GC1: Salinity dynamics in the Baltic Sea GC2: Land Sea biogeochemical feedbacks in the Baltic Sea region GC3: Natural hazards and extreme events in the Baltic Sea region GC4: Understanding sea level dynamics using new technologies (remote sensing) GC5: Understanding regional variability of water and energy exchanges The human impact will be assessed at all levels, wherever possible and senseful Website in preparation:


5 Baltic Earth Infrastructure International BALTEX Secretariat continued as International Baltic Earth Secretariat for the time being Interim Science Steering Group (ISSG) installed, with mandate until June 2014, then presentation of Baltic Earth Science Plan and permanent Science Steering Group ISSG members: Excellent, active young scientists; country balance, gender balance, discipline balance, institutional balance Working Groups installed for each GC plus o WG on Outreach and Communication o WG on Education o WG on the Added Value of Regional Climate System Models o WG on the Assessment of BSAP Scenario Simulations for the Baltic Sea o BALTEX Assessment of Climate Change Senior Advisory Board ISSG chairs: Markus Meier, Head of Oceanographic Research Dept. of SMHI and Professor at Stockholm University, Sweden. arch/research departments/ Oceanography Anna Rutgersson, Professor of Meteorology, Uppsala University, Sweden. /?languageid=1&id=n Both have been active in BALTEX for many years
6 Different responses in scenario simulations 6
7 Omstedt et al. (2012)

8 Ensemble mean hypoxic areas BAU REF BSAP observations (Source: Meier et al., 2011) 8
9 Annual averages of the integrated hypoxic area in the Baltic proper. The green solid line indicates the mean value of BED data. The red, blue and black lines show the mean values of the RCO-SCOBI, BALTSEM and ERGOM models, respectively. (Source: Eilola et al., 2011)
10 Simulations of eutrophication scenarios BALTEX, Borgholm Strong decline of the available DIP (14 22 E, N, 0 50m, summer)

11 (Source: Meier et al., 2012, Clim Dyn)
12 Different GCMs, emission scenarios, downscaling setups


13 Baltic Sea - how to approach the future? Advanced modeling tool for scenarios of the Baltic Sea ECOsystem to SUPPORT decision making COD 11 partner institutes from 7 Baltic Sea countries
14 Uncertainty in simulated processes


15 (Source: Eilola et al., 2011) Ensemble mean Temperature Salinity Oxygen Phosphate Nitrate Ammonium ERGOM BALTSEM RCO-SCOBI
16 Uncertainty in model sensitivity

17 Ensemble (upper) and BALTSEM (lower) mean summer bottom oxygen concentration changes between relative to BSAP CLEG REF BAU 17

18 Ensemble (upper) and ERGOM (lower) mean summer bottom oxygen concentration changes between relative to BSAP CLEG REF BAU 18
 mean summer bottom")

19 Ensemble (upper) and RCO-SCOBI (lower) mean summer bottom oxygen concentration changes between relative to BSAP CLEG REF BAU 19
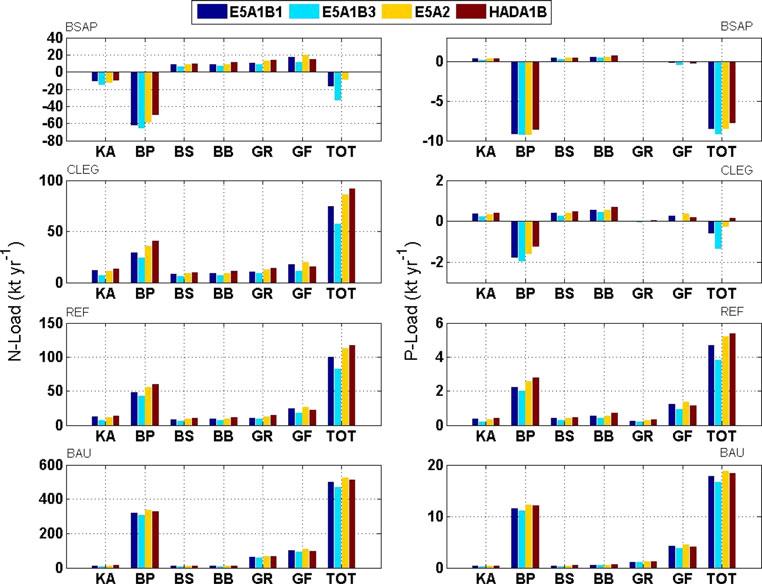
20 Uncertainty in nutrient loads and bioavailability


21 Baltic Sea Action Plan Annual nutrient load reductions: t phosphorus and t nitrogen
22 Simulations of eutrophication scenarios BALTEX, Borgholm Waterborne nutrient loads N [t/a] P [t/a] N/P ,3 BSAP (from 2021) ,6
23
24 Meier et al. (2012), Clim Dyn COD SPRAT
25 Uncertainty in initial conditions
26 (Source: Meier et al., 2012, ERL) Simulated ensemble averages and observed annual mean water temperatures ((a), (b)) and salinities ((c), (d)) at Gotland Deep at 1.5 and 200 m depth, annual mean oxygen concentrations at 200 m depth (e), and winter (January March) mean surface phosphate (f) and nitrate (g) concentrations. Shaded areas denote the ranges of plus/minus one standard deviation around the ensemble averages. The various nutrient load scenarios ( ) are shown by colored lines (REF yellow, BSAP blue, BAU red) and the reconstruction ( ) by the black line. For comparison, observations from monitoring cruises at Gotland Deep (green diamonds, in panel (a) since 1970 only) and from the light ship Svenska Björn, operated during (orange triangles in panel (a)), were used. 26
27 (Source: Meier et al., 2012, ERL) Simulated ensemble averages and observed annual mean water temperatures ((a), (b)) and salinities ((c), (d)) at Gotland Deep at 1.5 and 200 m depth, annual mean oxygen concentrations at 200 m depth (e), and winter (January March) mean surface phosphate (f) and nitrate (g) concentrations. Shaded areas denote the ranges of plus/minus one standard deviation around the ensemble averages. The various nutrient load scenarios ( ) are shown by colored lines (REF yellow, BSAP blue, BAU red) and the reconstruction ( ) by the black line. For comparison, observations from monitoring cruises at Gotland Deep (green diamonds, in panel (a) since 1970 only) and from the light ship Svenska Björn, operated during (orange triangles in panel (a)), were used. 27
28 Peer-reviewed article Outcome Assessment of scenario simulations for biogeochemical and carbonate cycles in the Baltic Sea One option AMBIO special issue organized by ECOCHANGE and BEAM Baltic Sea ecosystem-based management in an era of climate change State-of-the-art and recommendations for new scenario simulations Stakeholder: HELCOM, follow-up to BACCII 28