Causes and effects of the decrease in coarse mode mass concentrations observed in Cyprus
|
|
|
- Cory Gregory
- 5 years ago
- Views:
Transcription

1 Research Technology Innovation Causes and effects of the decrease in coarse mode mass concentrations observed in Cyprus M. Pikridas 1, M. Vrekoussis 1,2,3, N. Mihalopoulos 1,4, C. Savvides 5, C. Kizas 5, and J. Sciare 1 1 Energy Environment and Water Research Center, The Cyprus Institute, Nicosia 1645, Cyprus 2 Institute of Environmental Physics, U. of Bremen, Otto-Hahn-Allee 1, D Bremen, Germany 3 Center of Marine Environmental Sciences - MARUM, D Bremen, Germany 4 Institute for Environmental Research and Sustainable Development, National Observatory of Athens, 15236, Athens, Greece 5 Department of Labour and Social Insurance, Department of Labour Inspection (DLI), Nicosia, Cyprus 17 May 2018


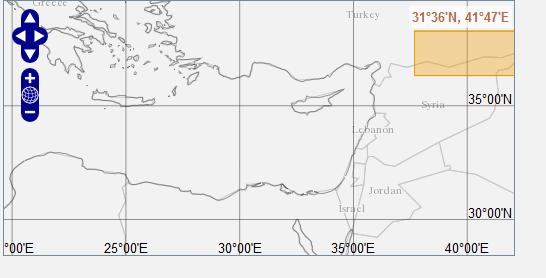
2 At the crossroad of 3 continents Air Pollution in Cyprus : Long-range transported natural/anthropogenic sources Pollution Western Europe Pollution Eastern Europe + Turkey Sea Salt Pollution Middle East Dust Dust
3 PM 10 across the Mediterranean Dust Concentrations in PM Dust Dust (μg/m 3 ) Finokalia Agia Marina Cape Corsica Jan Feb Mar Apr May Jun Jul Aug Sep Oct Nov Dec Months ( ) Kleanthous, Mihalopoulos, Vrekoussis, Sciare, unpublished data, 2019 PM 2.5 Half of PM 10 is made of dust PM 10 A clear West-to-East gradient of dust aerosols Cyprus is located in the mostly dust-impacted region of the Mediterranean (from Middle East & Sahara)


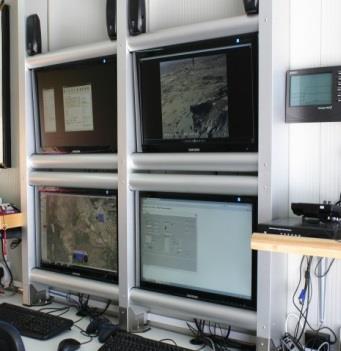
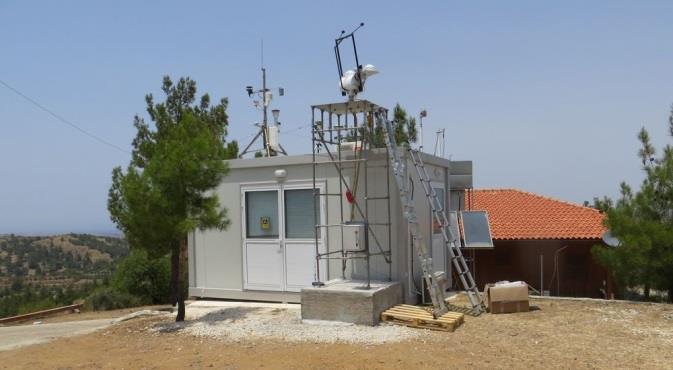
4 Local Monitoring Network Traffic Site Urban Background Site Remote Site Industrial Area 20 years of PM monitoring in the easternmost edge of Europe Ongoing since m (a.s.l.)
5 20 years of monitoring PM 10 PM 10 Observed Monthly Means 12-month smooth to guide the eye Deseasonalized Monthly Means Linear Regression Linear Regression (all years) Linear Regression
6 PM 10 Annual Trend (Agia Marina) Since 2010 PM 10 has decreased PM μg m -3

7 PM 10 Annual Trend (Agia Marina) Episodic events do not change the pattern PM 10 Annual Median PM 10 AOD
8 Satellite Validation Satellite (MODIS) AOD product suggests it is not due to systematic bias PM 10 AOD
9 PM 2.5 Annual Trend (Agia Marina) PM 2.5 were also reduced PM 10 PM μg m -3

10 Fine Coarse PM 1 Annual Trend (Agia Marina) PM 1 remained stable suggesting no anthropogenic influence PM 10 PM 2.5 PM 1

11 PM 10 Seasonal Trend (Agia Marina) Reduction in PM 10 throughout the year

12 Precipitation in Cyprus Annual variation cannot explain observed reduction Seasonal pattern in the last decade has largely remained unaltered Courtesy of Dr G. Zittis

 6.")
13 Apportioning dust 8.6 μg m -3 Based on the method introduced by Querol et al. (2009) 6.8 μg m -3
14 Dust Frequency M. East ( ) Africa ( ) Africa ( ) M. East ( ) Greater than 15 μg m -3 of dust How often air masses from Africa and M. East reached Cyprus
15 M. East ( ) M. East ( ) Africa ( ) Africa ( ) Dust Concentration Less dust particles are coming from Africa since 2010 (Evan et al., 2016) More are coming from M. East since 2010 (Notaro et al., 2015; Klingmüller et al., 2016) Average PM 2.5 in Cyprus
16 Take home message Wind patterns in Cyprus have changed + Less dust particles from the Sahara are reaching Cyprus + More dust particles from the M. East are reaching Cyprus Net effect: PM coarse has decreased


17 Thank you for your attention!
18 M. East ( ) M. East ( ) Africa ( ) Africa ( ) Dust Concentration Average Median
19 Is this phenomenon only observed in Cyprus?

20 AOD in the E. Mediterranean
 Decadal PM 2.")
21 Modeled decadal variation of PM 2.5 ( ) Decadal PM 2.5 Variability Andersson et al., 2007, Tellus

22 Urban Centers EU PM 10 threshold EU PM 2.5 threshold Urban Centers Important differences in PM levels since 2010 Before 2010 all cities violated EU PM 10 legislation Since 2010 only Limmasol consistently violates. Level of decrease is not the same in all cities and background sites. The EU PM 2.5 legislation is no longer violated

23 Possible causes Temperature increase and precipitation decrease suggest it is not local particles that triggered the decrease No significant change in land use
 Africa Asia Europe A high anthropogenic pressure around the Mediterranean")

24 Climate change hotspot Population around the Mediterranean (2000) Fraction of population per continent in the Mediterranean (estimated) Africa Asia Europe A high anthropogenic pressure around the Mediterranean with almost half a billion of inhabitants A strong increase of the population in the Southern and Eastern Basin with today more than half of the Mediterranean population leaving out of Europe (N. Africa and Middle-East)

25 Local Monitoring Network 4 are background 1 of which in the free troposphere Nothern part of the island is unaccessible 1 is at an industrial site 12 stations operating NOW 2 at each city (kerbside and urban background)


26 Anthropogenic Pressure in the Mediterranean High concentration of people in coastal area: Inhabitants: ~450 millions in 2000 >550 millions in

27 PM 10 Annual Trend (Agia Marina) Since 2010 PM 10 has decreased PM 10