Thomas W. Therriault 1, Claudio DiBacco 2, Ben Lowen 2 and Devin Lyons 2. Fisheries and Oceans Canada, Pacific Biological Station 2
|
|
|
- Abner Jack Cunningham
- 5 years ago
- Views:
Transcription
1 Characterizing and predicting Aquatic Invasive Species distributions: Reconciling large-scale model predictions with small-scale observations and incorporating climate change scenarios Thomas W. Therriault 1, Claudio DiBacco 2, Ben Lowen 2 and Devin Lyons 2 1 Fisheries and Oceans Canada, Pacific Biological Station 2 Fisheries and Oceans Canada, Bedford Institute of Oceanography

2 European Green Crab (Carcinus maenas) Successful establishment Native range Failed introduction Ranked on IUCN 100 Worst Invaders list Globally many introductions Often negative ecosystem impacts including fisheries and aquaculture

3 West Coast of North America GC Arrived in San Francisco Bay in 1989 (packing material) Slowly expanded northward into Pacific Northwest Arrived in BC through larval transport during 1998/99 El Nino Relatively few public reports after 1999 No surveys until 2006
 Managers need to know the potential distribution both now and in the")
4 Current Green Crab Distribution in BC Continue to spread north (larval dispersal) Only recently reported from Salish Sea (late fall 2016) Managers need to know the potential distribution both now and in the future
5 It Is Not Just About Distribution Simply knowing an AIS is present in a specific location is of limited utility Managers really want to know where invasion hotspots are most likely in order to best utilize limited resources Especially true if these hotspots are unique (i.e., Salish Sea)

6 So Where Were We in 2006?

7 Potential Distribution - 1 GARP model based on west coast distribution in Therriault et al. 2008
 Therriault")
8 Potential Distribution - 2 GARP model based on Canadian distribution (both east coast and west coast locations) Therriault et al. 2008

9 Potential Distribution - 3 GARP model based on native range of European green crab Therriault et al. 2008
10 Challenges with Initial Predictions Not overly informative for AIS Managers (most of BC suitable in all scenarios) Differences in abundance (and hence potential impacts) among sites not captured (i.e., hotspots NOT identified) So how to move forward? Different variables? Different scales? How to identify the right variables and the right scales?
11 Factors Constraining AIS Distributions For coastal temperate marine species, including AIS, reproductive success is constrained primarily by temperature and salinity thresholds for growth, survival, and reproduction Additional factors can further constrain AIS invasion success including environmental and biotic (i.e., prey, competition) variables

12 Predictions Using Enhanced Data Lowen et al. 2016


13 But What is the Best Scale for Predictions? ~ 64 km ~ 16 km ~ 1 km ~100 s m?

 at 100 s")


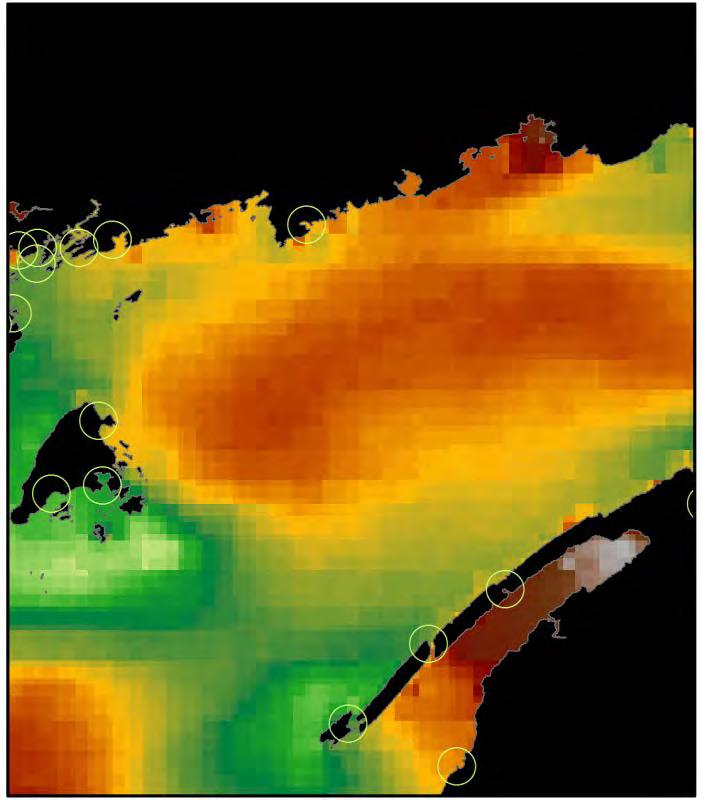
14 Environmental Topography Summer SST at 25 km (squares) at 100 s m (circles) Complexity of BC s sounds and fijords with very limited data complicate predictions
15 So Our BIG Question How does spatial resolution of ecological factors that constrain AIS distributions (e.g. temperature and salinity) influence the probability of accurately identifying suitable coastal habitats for AIS like GC? Really this represents a trade-off between relatively fine spatial resolution data that may be required (and unavailable) for predictions and coarser spatial resolution data that may be available but is masking important variation ultimately reducing the utility of predictions
16 Resolving Observed GC Distributions in BC TSS (sensitivity + specificity 1) insitu loggers (100s m) Spatial scale (km) Used MaxEnt which minimizes relative entropy between environmental and distribution probability densities Predictive Power (TSS) decreased with increasing spatial scale


17 Predictions with Increasing Resolution Predictive utility 100 s m insitu 1km 32km
18 Sensitivity, Specificity and Reliability Spatial Resolution of Predictors (km) Lowen et al. 2016

19 An Optimal Resolution for ENMs? Best predictions at 100s of m but resolution < 4 km was acceptable Lowen et al. 2016

20 But What about the Salish Sea? In fall 2016 GC were detected on US side of Salish Sea Additional modeling may help refine predictions
21 Updated MaxEnt Models Lyons et al. in prep

22 Climate Projection MaxEnt Models Lyons et al. in prep
23 Conclusions Probability of accurately identifying suitable habitat for GC increased with spatial resolution of limiting environmental variables but optimal scale is likely to differ among AIS Suitable habitat for GC exists throughout coastal BC however, in the Salish Sea it is patchy Climate change likely to increase amount of suitable habitat for GC in BC
24 Conclusions (and Caveats) Invasion vectors not modeled here (but work is underway on this) Climate change is likely to change AIS vectors and pathways in the future Technological advancements should allow much higher resolution environmental monitoring data collection in the future

25 Next Steps
26 Acknowledgements All the Green Crab trapping teams Funding provided by Fisheries and Oceans Canada s Aquatic Invasive Species Program and the Second Canadian Aquatic Invasive Species Network (CAISN II)