Decision Support System for
|
|
|
- Rosalyn Riley
- 5 years ago
- Views:
Transcription

1 Decision Support System for Flood Management at River Basin Level Vinay Kulkarni. Chief Engineer & Joint Secretary & Mr. Bagade EE
2
3 Recent flood events in Maharashtra (i) 1961 Flood : Dam Break Panshet Flood- Pune (ii) 2005 Flood : Mithi River flood of Mumbai (ii) Flood: Nagothane Flood (iii) 2010 Flood : Sangli & Kolhapur district (iv) 2013 & 14 Floods Vidarbha region / Chandrapur


4 Floods. Normal Flood - -water slowly rising over the river banks Flash flood -water quickly sweeps over an area Urban Flood
 Flood")
5 Panchganga River (Kolhapur) Flood 2005
6

7 Flooding creating ISLAND type situation

8 Encroachment in and along River Banks resulting in flood like situation

 Tapi (ii)")
9 KONKAN Flood Prone Areas Total Districts = 36 Geographical Area = million sq.km Main River Basins = (i) Tapi (ii) Godavari (iii) Krishna & (iv) Konkan Region
10 Identified Causes Floods in Maharashtra Kokan Region : Heavy rains Coupled with High Tides. K-B Basin : Multiple Reservoir Operations. Vidharbha Area Chandrapur Back Water Effects of Major Rivers Wainganga &Wardha in River Irai.
11 Scenario of Costal Region All Streams originates in Sahyadri ranges flows westward & meets Arebian Sea km narrow Strip of Kokan has 3 distinct topographical zones. Ist 20 km Strip of Steep Hill Slopes : generates Flashy Floods. IInd 30 Km Strip of Plains : often suffered by Inundation. IIIrd Strip Strip of Creeks : Tidal effects are dominant. Storm Flow in Tidal hours is rejected, can t be dissipated. Phenomenon is of Short duration of 5-6 hours. But damages are Severe. Mahad City is often hit by this Phenomenon. Challenge : Handling Flood considering Tidal Phenomenon.
12 Scenario of Back Water Effect Wainganga major Tributary of Godawari : originates in MP; 90% catchment in MP. But no major reservoirs. Another major tributary of Godawari is Wardha. At confluence discharge is 7-8 Lack Cusecs. Cities like Chandrapur are repeatedly hit by Back Water effect. Challenge : Modeling Back Water Effect
13 Scenario in Krishna Bhima Basin N- number of storages on various tributaries of River Krishna : Koyna, Dhom, Kanher, Tarali, Urmodi. Inundation Area : Sangli & Kolhapur Districts. The Situation has become worst with Almati Dam in Karnaraka on d/s side of River Krishna. Similar situation arises in Bhima Basin, d/s area near Pandharpur is often hit. Challenge : Operation of Multiple Reservoirs simultaneously.
14 Common Reasons Contributing to Floods Manmade encroachments River Cross sections : Habitations, Debary disposals. Result : Reduction in C/S Area. Cutting of Jungles in U/S, excessive soil erosion in u/s reaches & silt deposition in d/s reaches. Result : Flattening of River Bed Slopes. Velocity of flow reduces. Result : For same discharge Water Spreads are increased.
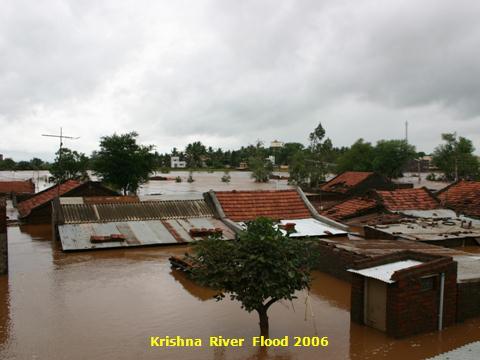
15 Flood Damages in Krishna Flood Loss of Lives : 50 ( 2005), 68 (2006) Loss of Live Stock : 616 (2005), 342(2006) Loss to Property & Agriculture : INR 2386 Millions (2005)

16
17 RESERVOIR OPERATION IN MAHARASHTRA Reservoirs are designed for 75 % dependable yield. No Flood Cushion is kept in design. In the absence of RTDAS & DSS, Reservoirs are operated in isolation and using historical hydro-meteorological data and experience. After the severe flood events in Krishna basin, Real Time Data Acquisition System & Integrated Reservoir Operation developed in KB basin.


18 1. Real Time Data Acquisition System INSAT Satellite Internet Decision Support Center
19
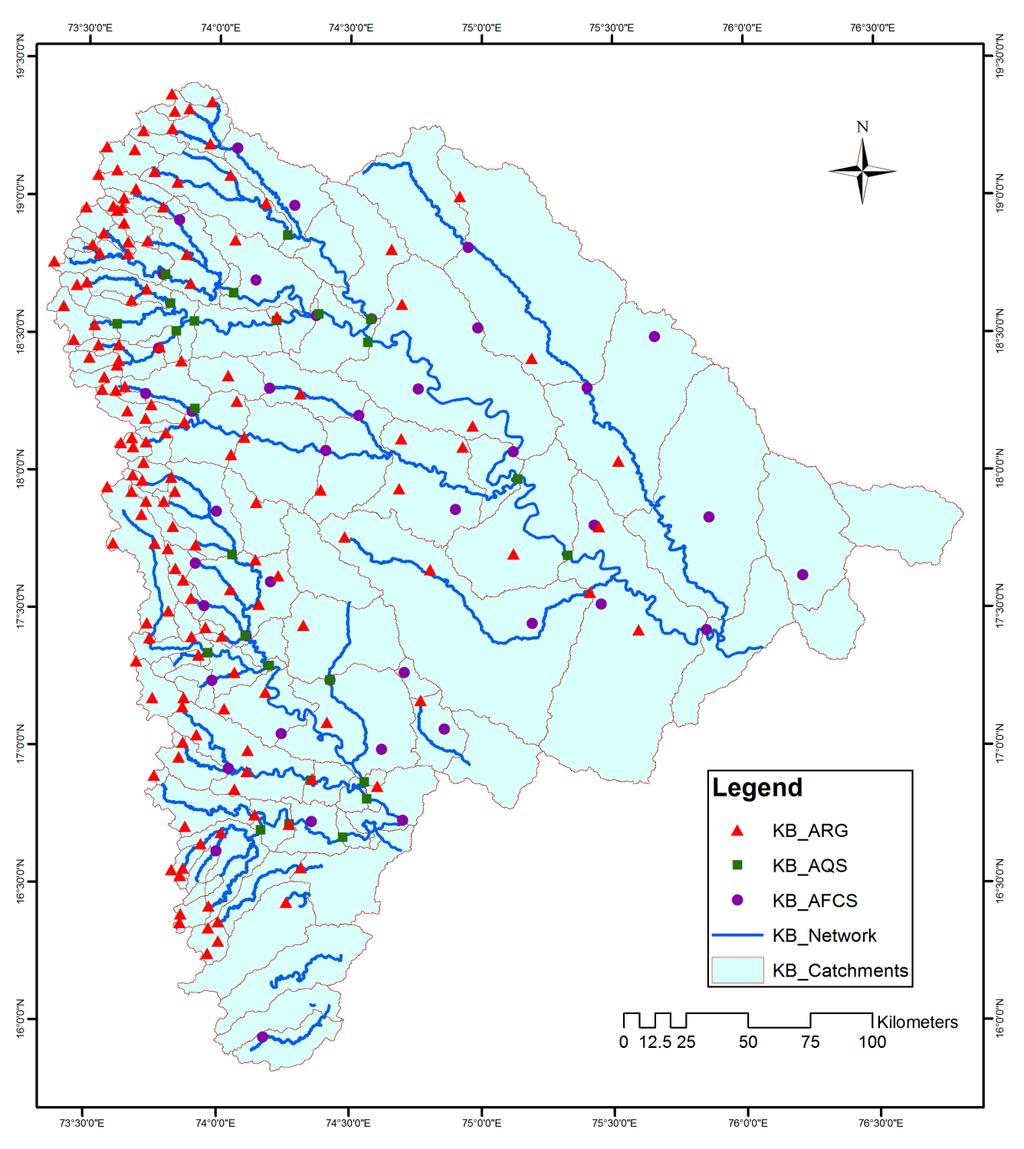
20 RTDAS Network Developed in KB Basin Sr No Description No of Stations 1 Automated Rainfall Stations Automated Full Climate Stations 39 3 Automated River water Level and River Discharge Stations 31 4 Automated River water Level and River Discharge Stations combined with Automated Rainfall Stations Automated River water Level and River Discharge Stations combined with Automated Full Climate Stations Automated Reservoir water Level and outflow Discharge Stations Automated Reservoir water Level and outflow Discharge Stations combined with Automated Rainfall Stations 19 Total 248


21 Automated Rainfall Stations Thoseghar Pabal


22 Automated Full Climate Stations Bhima nagar Rosa

")
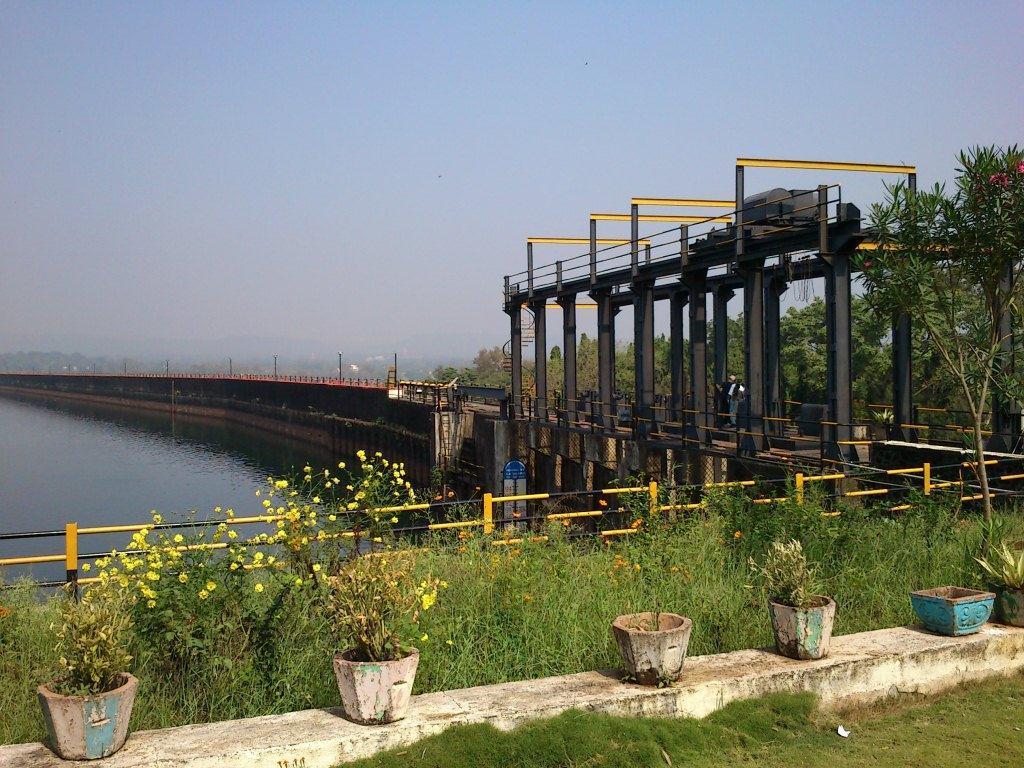
23 Automated Reservoir Water Level and Outflow Discharge Stations: Kadvi (Radar) Radhanagari (Radar)

 Urmodi (Shaft")
24 Automated Reservoir Water Level and Outflow discharge station : Dhom Balkawadi (Bubbler) Urmodi (Shaft Encoder)
")
25 Gate Sensors: (Khadakwasla)

26 ADCP Measurement : Pimple Gurav river gauging site


27

28 Real Time Stream Flow Forecasting and ROS 28

29 Rainfall runoff model (NAM Model) A Basin divided into 122 Sub Catchments and Computed Catchment runoff are routed through the river network

30 Example of Rainfall Runoff calibration (Koyna) Comparison of Simulated and Observed Discharges for Koyna Catchment (R2=0.95, Wbl=0.00% (Obs=5660mm/y, Sim=5660mm/y))

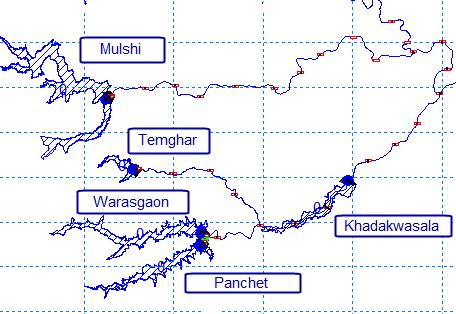
31 Basin wise water resources simulation model MIKE BASIN MODEL

32 Krishna-Bhima MIKEBASIN Model

33 Hydrodynamic model for flood forecast :MIKE 11 MIKE 11 : 1D river model for simulating flow, water level, water quality and sediment transport in rivers, floodplains, irrigation canals, reservoirs and other inland water bodies.


34 Reservoirs and Hydraulic Structures MIKE 11 : Facility of Modeling Wide Range of Structures
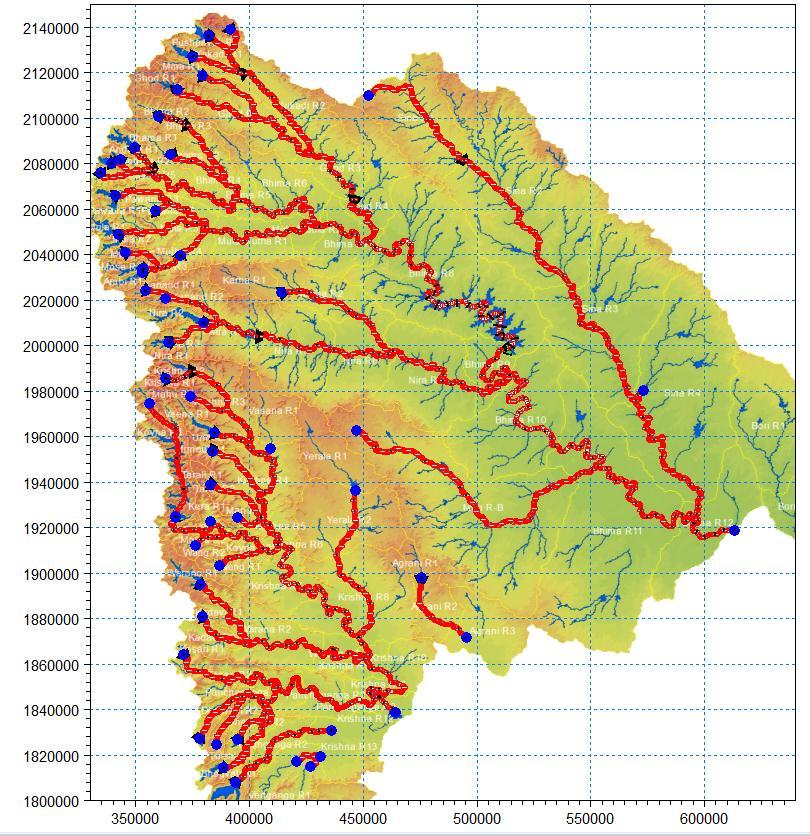
35 The Bhima-Krishna Network
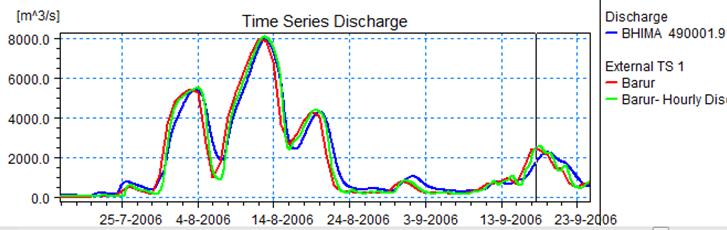

36 Hydrodynamic model calibration

37 WEB Portal of RTSF&ROS
 Simulated flood")

38 Model Outputs (Flood maps) Simulated flood map of Pandarpur for a high discharge of 325,000 cusecs)
-July")
39 Reservoir Levels Comparison : MIKE 11 Results & RTDAS DATA (One Day Precipitation Forecast)-July 2013
40 Travel Time Computation 40


41 THANKS