The Hitchhiker s Guide to Global Water Issues
|
|
|
- Ashlyn Greer
- 5 years ago
- Views:
Transcription


1 Third Age Learning Guelph, March 4, 2015 The Hitchhiker s Guide to Global Water Issues Philippe Van Cappellen 1
2 Ecohydrology HUMAN DIMENSION HYDROLOGY ECOLOGY 2


3 Water Use (Water Footprint) Global Canada 22% 8% 70% agriculture industry domestic use agriculture industry domestic use 11% 9% 80% Source: United Nations Environment Programme (UNEP) 3


4 Economy Poverty Food production Energy Health Security Environment Biodiversity Climate change 4
5 Withdrawal versus Consumption water withdrawal = water diverted or withdrawn from a surface water or groundwater source. water consumption = water permanently withdrawn from its source i.e., the water is not returned to the immediate water environment. Vickers A. The Handbook of Water Use and Conservation. 5
6 08 km Global Water Withdrawal and Consumption km 3 Asesment Forecast 350 Asesment Withdrawal Consumption Forecast Top 20 water consumers per capita 1 0to180m 3 180to3 0m 3 km 3 per year to810m Asia NorthAmerica Europe Africa SouthAmerica Australia andoceania Water use at the end of the 1990s Withdrawal Consumption North America Europe Asia Pacific Ocean 250 Pacific Ocean South America Atlantic Ocean Africa Indian Ocean 0 Australia and Oceania UNEP PHILIPEREKACEWICZ, MARCH202 Source: Igor A. Shiklomanov, StateHydrological Institute(SHI, St. Petersburg) andunitednationseducational,scientificandcultural Organisation(UNESCO, Paris), 19; WorldResources20-201, PeopleandEcosystems: TheFrayingWebof Life, WorldResourcesInstitute(WRI), WashingtonDC, 2 0; Paul HarisonandFredPearce, AS Atlasof Population201, AmericanAsociationfor theadvancement of Science, Universityof CaliforniaPres, Berkeley. 6
7 7
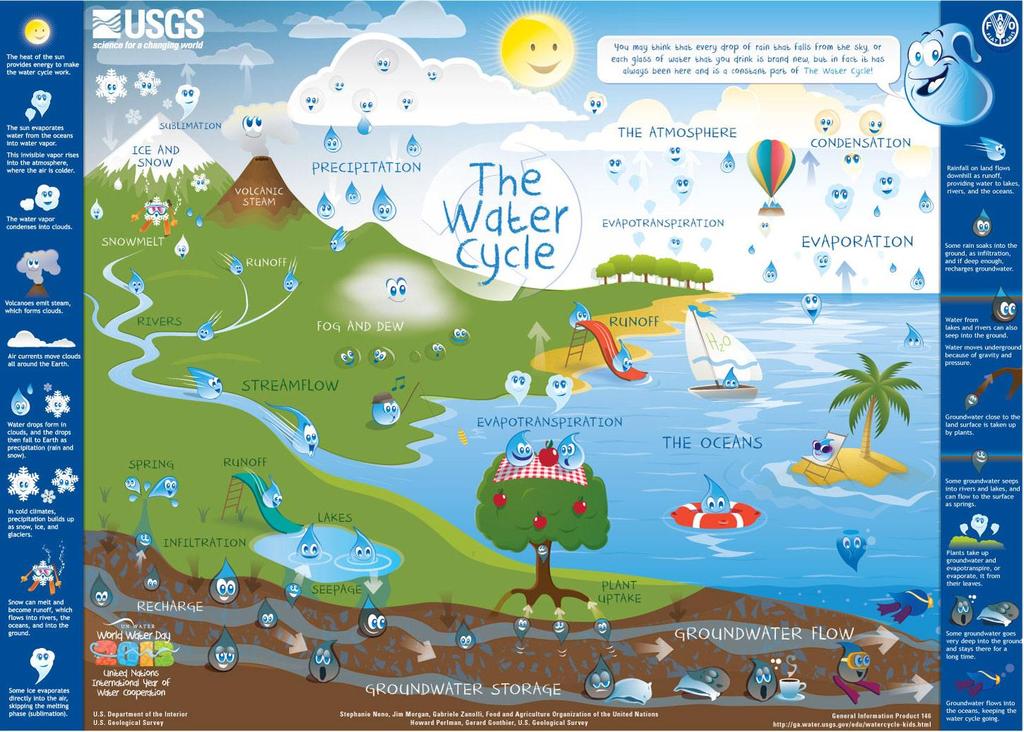
8 Renewable Freshwater Resources (RFWR) Water is a circulating resource. Water flows (or fluxes), not stocks, are the most relevant measures of freshwater availability. 8
9 RFWR: Global Supply and Demand Water withdrawals (in 1000 km 3 /year): agriculture: 2.8 industry: 0.9 domestic: Compare to total river flow: 45 (x 1000 km 3 /year) Current demand << renewable freshwater resources globally, there is enough water to cover human demand (given adequate water management) 9
10 But Not all freshwater resources are (easily) accessible. There is a large geographic variability in precipitation and runoff. Human consumption competes with water requirements of natural ecosystems. Supply and demand analysis must account for water quality. 10

11 Extreme Case: Aral Sea
12 Ecological health* Environmental Flows optimum Water quality good degraded Flow discharge highly degraded *Indicators: usable habitat, vegetative cover, biodiversity, trophic status, food web structure, assimilative capacity, nutrient recycling, 12

13 Integrated Water Management = Watershed Source: NASA Water balance Water quality Ecosystem health 13
14 Integrated Water Management: Implementation Human pressures on the watershed land-use changes population growth increased water abstraction release pollutants invasive species magnified extreme events Changed ecosystem structure and function decreased biodiversity decreased resilience increased disease changed community structure eutrophication Decreased ecosystem services flood control water quality air quality fish and wildlife ecological barriers recreation Societal response improved environmental management decreased pressures Negative economic, environmental and health impacts After Rapport et al. (1998) Assessing ecosystem health. TREE 13,
15 Anthropogenic Nutrients (N, P, K, S) 300 Tg N year Projected human N input Range of N fixation in natural terrestrial ecosystems Total human N input Fertilizers and industrial uses Year Milenium Ecosystem Assessment (2005) 15

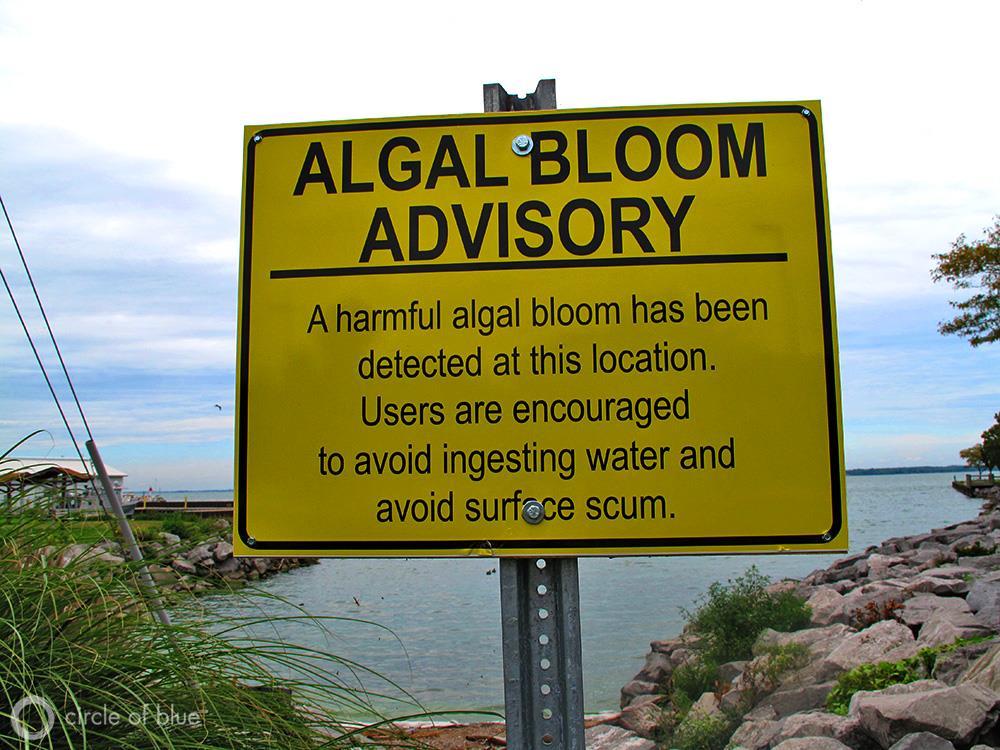
16 (Harmful) Algal Blooms Qindao, July

 17")

17 Great Lakes (Summer 2012) 17
18 18

19 Ecosystem Services 19
20 Healthy ecosystems Ecosystem Services Provide ecosystem services food and biomass production drinking water supply habitat and biodiversity storage, filtering and transformation recreation support for man-made structures, protection regulation of climate (e.g., carbon sequestration) Decrease exposure to environmental hazards Strengthen economic and social development Improve human health and well-being, contributes to sustainable development 20
 is estimated to be in the range of US$ 16-54 trillion (10 12 ) per year, with an average of 33 trillion per year. Because of the uncertainties, this must be considered a minimum estimate.")
21 Costanza, d Arge, de Groot, Farber, Grasso, Hannon, Limburg, Naeem, O Neill, Paruello, Raskin, Sutton, van den Belt In Nature (1997) For the entire biosphere, the value (most of which is outside the market) is estimated to be in the range of US$ trillion (10 12 ) per year, with an average of 33 trillion per year. Because of the uncertainties, this must be considered a minimum estimate. Global gross national product total is around US$ 18 trillion per year. 21
 ~1")
 Rapid urbanization (>80% population) 50 municipal drinking water systems 70%")
22 Economic Valuation: Grand River Watershed 6,800 km 2, larger than PEI Approx. 11,000 km rivers and streams Highly regulated Extensive agriculture (>70% total area) ~1 M people Rapid population growth (1.4 M by 2031) Rapid urbanization (>80% population) 50 municipal drinking water systems 70% water supply = groundwater MSc Project Saliy Shaker Lake Erie 22


23 Grand River Watershed: Ecosystem Services Air quality Climate regulation Flood control Flow regulation Water supply Soil retention Nutrient recycling Waste treatment Pollination Pest and disease control Habitat Food production Raw materials Genetic resources Medicinal resources Education, culture, recreation Water purification Water supply for agriculture Carbon sequestration Nutrient recycling Flow regulation PhD Project Tariq Aziz 23
 2 Ontario Business")
24 $$$$ 5 ecosystem services 1 : $200 million per year Waterloo Region (Canada s Technology Triangle): GDP (2009): $19.5 billion per year 2 Pre-European settlement 1 : $900 million per year 1 Conservative estimates (Tariq Aziz) 2 Ontario Business Report (2012) 24
25 You Are Richer Than You Think Natural processes in watersheds provide a wide range of ecosystem services. Financial values can be placed on certain ecosystem services. Economic valuation of ecosystem services helps raise public awareness about water and water-dependent resources, and can inform sustainable regional development. 25
26 The Cost of Water Opportunity costs Ecological costs Environmental costs Administrative and support costs Operation and maintenance costs Financial costs Full cost Investment costs Adapted from Folifac and Gaskin (2011) J. Ecol. Nat. Environ. 3,
27 Canada USA Australia Italy UK France Belgium Denmark The Price of Water Annual water withdrawal in m 3 per capita Source: OECD Germany Price in US$ per m 3 27
28 Water Stress: Global Issues Now Hydro-environmental limits are being reached in many of the major grain producing areas (Mediterranean, Punjab, Northern China, Western United States, NE Brazil, ) Depletion groundwater resources, salinization aquifers and surface waters, accumulation pollutants, environmental degradation downstream ecosystems, including coastal areas (e.g., algal blooms) Source FAO, UNEP, UNESCO-IHP 28
29 Water Stress: Global Issues The Future? World population and per capita water demand continue to rise. Climate change will intensify competition for water and exacerbate regional differences. In many areas, existing water management and supply systems will not be able to cope with the growing demand. The number of people affected by water stress is projected to double by

30 Water-Related Conflicts 145 countries share river basins; 33 countries rely for 95 % of their freshwater supply on a source located outside their national boundaries; there are 273 major transboundary groundwater aquifers. Water crosses not only national, but also economic, policy, trade, social, cultural, environmental and knowledge boundaries. In water disputes political power is often asymmetrically distributed. (World Water Week, Stockholm, August 16-22, 2009) 30
 Ecological solutions Engineering solutions *Riparian buffer zones, aquifer recharge, marshes, constructed")
31 Ecohydrological Engineering Protect key ecosystems Minimize human impact Steer/enhance natural remediation and flow regulation* Reuse water (blue, green, gray water) Diversify sources Replace natural/local sources (transport water, desalination) Ecological solutions Engineering solutions *Riparian buffer zones, aquifer recharge, marshes, constructed wetlands 31
32 Linear Nutrient Flows (N, P, K, S) Rural Urban Natural fertilizers food wastewater discharge, storm overflow, urban emissions (e.g., NOx) accumulation 32
cycling Rural")


33 Nutrient (Re)cycling Rural Urban Natural fertilizers food wastewater discharge, storm overflow, urban emissions (e.g., NOx) biosolids, accumulation compost 33
34 Take-Home Messages Water is our most precious natural resource. It is a renewable resource. Globally, water stress is on the rise, because of increasing consumption and deteriorating water quality. The key challenges for integrated water management are (1) to balance the water needs of humans and those of natural ecosystems, and(2) to simultaneously anticipate changes in anthropogenic pressures (especially population growth and climate change). Economic valuation of ecosystem services can help raise public awareness about water and water-dependent resources, and inform sustainable regional development. Ecohydrological engineering solutions incorporate hydrological and ecosystem processes and principles into sustainable development strategies. 34


35 Water footprint 75L 120L 10L 35

36 THANK YOU FOR YOUR 36