Research Article Application of Microclimate Modelling and Onsite Survey in Planning Practice Related to an Urban Micro-Environment
|
|
|
- Bethanie Dalton
- 5 years ago
- Views:
Transcription
1 Advances in Meteorology Volume 20, Article ID , 10 pages Research Article Application of Microclimate Modelling and Onsite Survey in Planning Practice Related to an Urban Micro-Environment Lilla Andrea Égerházi, Attila Kovács, and János Unger Department of Climatology and Landscape Ecology, University of Szeged, P.O. Box 653, Szeged 6701, Hungary Correspondence should be addressed to Lilla Andrea Égerházi; Received 2 May 20; Revised 12 July 20; Accepted 31 July 20 Academic Editor: Andreas Matzarakis Copyright 20 Lilla Andrea Égerházi et al. This is an open access article distributed under the Creative Commons Attribution License, which permits unrestricted use, distribution, and reproduction in any medium, provided the original work is properly cited. Numerical simulations of human thermal comfort conditions were carried out by means of the urban microclimate model ENVImet in a popular children s playground located in Szeged, Hungary. Bioclimatic conditions were quantified by the Physiologically Equivalent Temperature (PET). Based on the PET values, thermal stress maps were created in two different periods of typical summer and autumn days. The study aims to reveal the seasonal and diurnal spatial patterns of the simulated thermal conditions and thus the degree of heat stress in different parts of the playground. Furthermore, we analysed the momentary spatial distributions of the visitors triggered by the microclimatic conditions of the area. According to the simulation, remarkable differences in the thermal conditions were found depending on the sun elevation and the resulting shaded conditionsaswellastheradiationofthe heated surfaces. The spatial distribution of the visitors seems to be highly influenced by the patterns of the thermal conditions but the location and the preference of the children s playground equipment also affects it. In order to reveal the possible causes of the people s behaviour, an onsite questionnaire survey was conducted on their opinions and possible modification requirements related to the design of the playground. 1. Introduction Due to accelerated urbanization, more than half of the Earth s populationliveinurbanizedareasandthisratiomaycontinue to increase in the future [1]. This also means that the number of people affected by the hazards of their housing and working environments such as air and light pollution and noise and thermal load (heat stress) is growing rapidly. In addition to urbanization, the trends of climate change, particularly the increasing frequency and intensification of extreme heat waves [2], increasetheimportanceof urban bioclimatological research. Urban bioclimatology examines the physiological impacts of the urban climate on the human health and the thermal comfort requirements. In urban environments, climate parameters are modified compared to the rural areas and even microscale climatic conditions change rapidly which have great influence on the thermal sensations and thermal stress levels of the residents and visitors. The microclimatic aspects of an area substantially determine the behavioural reactions as well as the subjective judgments of the visitors related to theareadesign,andultimatelyareausage. In the last years, numerous prominent urban bioclimate research projects were carried out in order to reveal the microclimatic conditions of open spaces (streets, squares, and parks) with different designs and also the visitors behavioural reactions (e.g., RUROS [3], UCS [4, 5], and KLIMES [6]). A number of further studies conducted in the field of outdoor thermal comfort have attempted to contribute to encouraging sustainable urban development in various climates around the world. These studies focus on the thermal effects of urban microenvironments based on different methods. Several studies analyze the thermal environment-dependent area usageandtheinvoluntaryhumanreactions(mainlytheclothing and solar exposure of visitors) triggered by these environments based on observations, for example, in Cambridge [7],Göteborg [8], Athens [9]as well as in Taichung City[10]. Numerous studies focus on revealing subjective assessments directed towards the thermal sensations, perceptions, and preferences of outdoor thermal factors based on structured
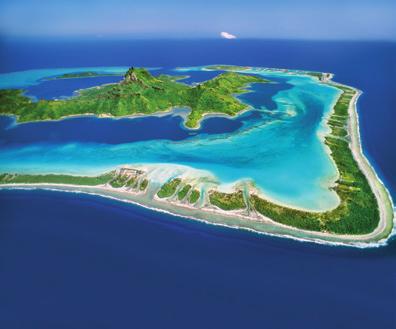
2 2 Advances in Meteorology onsite interviews (e.g., [11 14]). Cultural and psychological characteristics and differences in subjective reactions to the thermalenvironmentarealsofrequentlyanalyzed[15 17]. Recentpapershaveemphasizedtheroleandimportance of urban planning processes in the thermal comfort investigations []. The design of an urban space is determined primarily by aspects of architecture but it would be desirable that urban planners and architects create also thermally comfortable and enjoyable microscale climatic conditions taking into account the health and well-being of the citizens. Mainly due to the large role of urban planning, considerable efforts have been put into analyzing the microclimate perception of people in urban environments through cognitive mapping [19], the shading effects of the vegetation, and buildings on outdoor thermal comfort (e.g., [20 ]) as well as the thermal performance and effects of natural and artificial materials used in outdoor urban spaces (e.g., [24, 25]). Extensive research has also been conducted emphasizing the role of microclimate simulations in urban planning. The application of urban microscale models provides an opportunity to predict the different thermal stress conditions in high spatial and temporal resolution. Simulation results can give useful information for the architects and urban planners already before a construction process begins, therefore, they can estimate its possible thermal impacts and consequences. In case of existing places, thermally comfortable or critical areas can be identified by a modelling approach, and, if necessary, possible goals in relation to the area design can be determined. Nowadays, there are studies dealing with microclimate simulation in planning using the models RayMan [26 28], ENVI-met [19, ], or their combination [30, 31]. In Szeged, Hungary, several public places (squares, playgrounds,andapedestrianstreet)havebeenevaluatedin terms of thermal conditions and the resulting human reactions in the framework of a long-term urban bioclimate project. The applied methods consisted of, for example, onsite questionnaire surveys related to the subjective thermal sensations, perceptions and preferences of the visitors as well as their opinions about the design of the areas []. In addition, the momentary attendance of the places was observed [32]. In the second part of the project, the investigation was extended with a microclimate modelling approach performed by means of the models RayMan [33]andENVImet [34]. In summer 2011, one of the most modern children s playgrounds of Szeged was included in the thermal comfort studies. Children s playgrounds have a significant influence on the social life of their neighbourhood and provide recreational activity and enjoyment to the visitors of the area. Typically, the groups most affected by heat stress are the young children and the older adults who often take care of them []. Therefore, the thermal comfort examination of these types of public places is a particularly important research topic and can provide valuable information to architects and urban planners as well as decision makers. The main objective of the study is to identify different microclimatic areas with various thermal stress levels in the above-mentioned popular playground of Szeged according to the results of an urban microscale model simulation. In this context, we also analyze the momentary spatial distributions of the visitors triggered by these different microclimatic conditions. In order to reveal the possible causes of the visitors behaviour, they were asked to evaluate the design of theareainanonsitequestionnairesurvey. The paper is organized as follows. In Section 2,thestudy area and the methodology are introduced. In Section 3, the results of the model simulation, area usage, and the questionnaire survey are presented. We also propose some possible solutions to improve the thermal conditions in the area. Finally, in Section 4, we summarize the results. 2. Materials and Methods 2.1. Study Area. The examined playground is located in Szeged (46 N, 20 E,82mabovesealevel),amedium-sized city in the southeastern part of Hungary, having a population of 160,000 and an area of 40 km 2. The city belongs to the climatic region Cfb according to Köppen s classification (temperate warm climate with uniform annual distribution of precipitation) or to the climatic region D.1 according to Trewartha s classification (continental climate with a long warm season) [36]. The study area is one of the most popular and attended playgrounds in the city with an area of approximately 3,300 m 2. Children can choose from several playground equipments such as jungle gyms, swings, and slides; moreover a cottage in the western part of the area provides an opportunity to play in comfortable, shaded conditions and alsointhecaseofbadweather(figure1). The surface of the area is primarily covered by light-coloured gravel; however, in the immediate vicinity of the playhouse, paving stone can be found. A large number of deciduous trees (about 60) are planted mainly at the boundaries of the playground; however, in the middle parts of the area, there are only a few trees (about 20), moreover they are too young to provide shade yet. Therefore, in the morning and early afternoon hours, a considerable part of the area is exposed to direct sunlight which can adversely affect the thermal conditions in summer, though the shading of the trees would be a decisive way to control heat stress, especially in summer Applied Methods: Model Simulation, Area Usage, and Questionnaire Survey. In order to examine the microbioclimatic conditions of the area, a modelling approach was applied in the study. We used the model ENVI-met which is a three-dimensional nonhydrostatic climate model and is capable to simulate the interactions in the surface-atmospherevegetation system with relatively high temporal (10 min) and spatial (0.5 10m) resolution [37, 38]. The simulation required two groups of model input data: the configuration file (cf) contains the basic settings and the necessary initial meteorological parameters of the simulation while the area input file (.in) includes the morphological elements (buildings, vegetation, land covers, etc.) of the area. ENVI-met needs initialization time, therefore it is suggested to start the simulation at midnight or at sunrise.
3 Advances in Meteorology (m) Table 1: Basic initial meteorological input parameters of the simulation on both investigated days. Study area Jungle gym Children s sand pit Building Grass Concrete Road Light gravel Pavement Bench Tree Bush N Meteorological parameters 12th July 3rd October Air temperature at 2 m (K) Relative humidity at 2 m (%) Wind speed at 10 m (ms 1 ) Wind direction ( ) Spec. humidity at 2500 m (gkg 1 ) 4 2 Table 2: Categories of the PET values ( C) for different grades of thermal sensation and physiological stress level [42]. Thermal sensation Very hot Hot Warm Slightly warm Neutral Slightly cool Cool Cold Very cold PET categories ( C) > <4 Extreme heat Strong heat Moderate heat Slight heat No stress Slight cold Moderate cold Strong cold Extreme cold Physiological stress level Figure 1: Spatial design and surface cover of the examined playground. The morphological characteristics of the study area were previously assessed during field surveys. In the model the vegetation (trees and bushes) was divided into six groups basedontheirheights.thenadefaulttypeoftreeselected in the model was modified layer by layer according to our groups. This method was applied also in case of the bushes. Themodelwasrunwithaspatialresolutionof1.5m,and the results refer to 1.2 m. The simulation had a stabilization time of 24 hours and then results for the period from 9 a.m. to 6 p.m. CEST (in accordance with the opening hours of the playground) were applied for a hot summer day (12th July 2011) and a temperate autumn day (3rd October 2011), both typical in terms of the average climatic conditions of Szeged. We tried to select relatively windless and sunny days so that the thermal conditions could develop clearly in the study area. The necessary initial meteorological data for the model on both days were air temperature, relative humidity (both at 12 a.m.), wind speed (average of the tenminute measurements in the period from 9 a.m. to 6 p.m.), themostfrequentwinddirection(from9a.m.to6p.m.),and specific humidity (sounding measurements at 0 UTC). These necessary meteorological parameters were obtained from the meteorological station of the Hungarian Meteorological Service at a distance of about 6 km from the playground. The specific humidity was derived from [39]. The value at 2500 m necessary for modelling was obtained by interpolation (Table 1). The simulated thermal conditions were quantified by a widely used thermal comfort index which is the Physiologically Equivalent Temperature (PET). It is defined as the air temperatures at which, in a typical indoor setting, the heat budgetofthebodyisbalancedwiththesamecoreandskin temperature as those under the prevailing complex outdoor conditions [40, ]. The PET value ranges were defined according to different Central European thermal sensations and physiological stress levels [42](Table 2). After the modelling process, hourly thermal stress maps, thatis,spatialdistributionsofthesimulatedpet,werecreated with the software Surfer 8 from 9 a.m. to 6 p.m. for the selected days. Surfer is able to visualize accurately microscale model results. Maps in two distinct times of the days (11 a.m. and 4 p.m.) were analyzed. The momentary spatial patterns of visitors in the area (at 11 a.m. and 4 p.m.) are also illustrated on the maps and analyzed in terms of the actual thermal conditions. Additionally, an onsite questionnaire survey was conducted for 12 days (each day from 10 a.m. to 6 p.m.) related to the subjective evaluation of the design of the playground. The survey was carried out during the summer of 2011 and 2012 (226 interviewees) and the autumn of 2011 (3 interviewees); the dataset from each season comprises 6 days. The responses are fairly well representative of the population regularly visiting the playground. Table 3 informsaboutthedatesofthesurveysandalsothe overall climatic conditions. The meteorological parameters were obtained from the above-mentioned meteorological station. The data were averaged for the period from 10 a.m. to 6 p.m. for all parameters. The questionnaires took about 5 minutes to be completed. The first part collected information on the degree of the satisfaction with the design of the area marked in a sevenpoint semantic differential scale (from 3 very unpleasant to +3 very pleasant). Then subjects were asked to identify more than one preference and deficiency related to the area design. In the last part, we were interested in their possible modification requirements in the area. At first, we asked
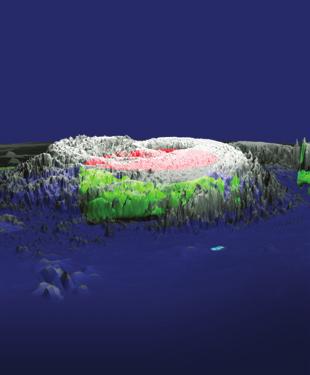
4 4 Advances in Meteorology Table 3: The dates of the questionnaire surveys and the basic climatic conditions. The parameters are marked in bold in case of the dates considered for simulations. Campaign Meteorological parameters Relative humidity (%) Wind speed (m/s) Temperature ( C) Summer of /07/ /08/2011 Summer of /06/ /06/ /07/ /08/2012 Autumn of /09/ /09/ /09/ /10/ /10/ /10/2011 Global radiation (W/m2 ) n/a n/a n/a n/a PET ( C) 54 12th July 2011, 11 a.m. 12th July 2011, 4 p.m. PET ( C) N 8 (a) (m) 8 (b) Figure 2: Thermal stress map (PET) and spatial pattern of visitors (black dots) at 11 a.m. (a) and 4 p.m. (b) CEST, 12th July The thick black line indicates the border of the playground. them to indicate the degree of their modification demand according to three categories: significant, slight, or none. Then they could give up to three concrete proposals for solutions from a list of six predefined factors (e.g., construct shade structures, plant trees, and construct fountain ), and they also had the option to mention other proposals according to their individual ideas. 3. Results and Discussion 3.1. Simulated Thermal Conditions and the Momentary Spatial Distributions of Visitors. According to the methods described in Section 2, the heat stress conditions expressed by the spatial distribution of PET values and their relationship with the momentary area usage of the playground are examined. The thermal stress maps indicate remarkable differences between summer (Figure 2) and autumn (Figure 3) and also between the investigated times. The heat load was more dominant in the summer day in the whole area than in autumn. In summer, in the morning (Figure 2(a)), the highest heat load appeared around the playhouse where PET values exceeded C denoting extreme heat stress (very hot thermal sensation). This can be explained by the strong heat radiation of the pavement (see Figure 1)
5 Advances in Meteorology 5 3rd October 2011, 11 a.m. PET ( C) 54 3rd October 2011, 4 p.m. PET ( C) N (m) 8 (a) (b) Figure 3: Thermal stress map (PET) and spatial pattern of visitors (black dots) at 11 a.m. (a) and 4 p.m. (b) CEST, 3rd October The thick black line indicates the border of the playground. Summer Autumn (%) Very pleasant (3) Pleasant (2) Slightly pleasant (1) Neutral (0) Slightly unpleasant ( 1) Unpleasant ( 2) Very unpleasant ( 3) Figure 4: Percentage distribution of the visitors general satisfaction with the playground. which was strongly heated by the direct solar radiation. In the middle and northern parts of the playground, slightly more moderate thermal conditions can be found, but even so, mainly warm and hot thermal sensations ( C) occurred. Intheimmediatevicinityofthesingletrees,thermalstress was negligible. Due to the shading effect of the dense foliage, thermal conditions were much more pleasant near the southern and eastern boundaries of the area; however, slight cold stress was still present ( C). Although the spatial distribution of the visitors can be highly influenced by the location and the preference of the playground equipment, it also has some connections with the patterns of the thermal conditions. Some visitors spent their time at the playground equipments exposed to the direct sunlight. Seemingly they did not care about the existing heat load too much. However, most people preferred the comfortable southern and eastern spaces protecting themselves from the direct sunlight. In the afternoon(figure 2(b)), despite the lower sun elevation, there were more unpleasant thermal conditions in the places exposed to the sunlight compared to those in the morning. Besides the direct radiation, this might be related to the strong radiation from the heated surfaces. The most unpleasant conditions corresponding to hot and very hot thermal sensations (PET of above C) were in the sunny middle and eastern parts of the area as well as on the southern side of the house. Similarly to the situation at 11 a.m., comfortable conditions prevailed in the southern shaded area. However, due to the altered shading conditions of the trees, the thermal sensation on the western part of theplaygroundbecamealsocomfortable.theattendance followed the spatial pattern of the thermal conditions, that is,peoplewerenotexposedtothedirectsunlightatall. Nevertheless, there were much less people in the playground at this time compared to the morning. The more stressful thermal load and, as a consequence, the increasing number of sun-heated equipments may play a role in this phenomenon. The selected autumn day can be characterized with lower thermal load (Figure 3). At this time, cold stress also appeared in large areas. In the morning(figure 3(a)), similarly to the summer day, warm load prevailed primarily in the northern parts (corresponding to slight and moderate heat stress, i.e., C). Additionally, moderate and strong heat stress conditions ( C) occurred on the western side of the houseeveninautumn.intheseplaces,therewaspractically nothing to protect the people from the direct radiation. Due to the lower sun elevation in autumn, greater parts of the area were shaded by the southern vegetation and the buildings. The PET decreased there below Cwhich
6 6 Advances in Meteorology (%) 50 (%) Summer Autumn 0 Summer Autumn Toys (diversity, quality) Fenced/safe Others Equipment/cleanliness None Shaded Large area Playhouse None Absence of shade Others Land cover Toys Water/pool (a) (b) Figure 5: Preferences (a) and deficiencies (b) according to the opinions of the respondents (a person could mention more than one assessment). already indicates cool conditions (moderate cold stress). It can be therefore concluded that areas with comfortable conditions were negligible, thus people could only choose places with thermal stress. Most people favoured the shady, cold conditions (Figure 3(a)) which can be considered to be a real human reaction in autumn, after a hot summer period. However, several children enjoyed their time on the jungle gym partly exposed to the direct sunlight. Regarding the late afternoon period of the autumn day (Figure 3(b)), cool thermal sensation (PET of below C) occurred in large parts of the area since they became shady. The heat stress zone ( C) shifted to the northeast compared to that of the morning hour due to the western position of the sun. The number of people was lower at this time and their distribution did not follow strictly that of the thermal conditions; the locations of the playground equipment had rather greater influence on the patterns of the visitors. The thermal stress maps indicate appropriately the spatial differences in thermal conditions in such a small area. However, the results of ENVI-met should be interpreted with caution due to inaccuracies in simulations, which have been also discussed in [19, 31]. The model gives inaccurate results in certain situations as near the large buildings at the edges of the maps clearly seen in Figures 2 and 3. There is an overestimation of radiation fluxes and thus PET in these spaces, therefore they were excluded from the analysis. It should be noted, however, that the results of ENVI-met entirely outline the adversely thermal effects of the pavement around the playhouse in the studied area (Figures 1 3) Questionnaire Survey Related to the Design of the Playground. According to the results analyzed in Section 3.1,the creation of more comfortable conditions becomes particularlyimportantwhichcanbeachievedbysomemodifications in the design of the area reflecting the visitor s opinions and requirements. In this section, the onsite seasonal evaluation of the visitors answers pertaining to the area design is analyzed. The first question concerns their general satisfaction with the area was marked in a seven-point semantic differential scale (from 3 very unpleasant to +3 very pleasant) (Figure 4). The vast majority of the votes correspond to the pleasant categories (+1 3): 94.6% in summer and 96.4% in autumn, respectively. Moreover, more than two-thirds of the respondents were fully satisfied (+3): 74.3% and 68.4% in the two seasons. We then surveyed the possible positive or negative judgments of the visitors about the area design (Figure 5) in order to reveal the causes of their satisfaction or dissatisfaction. A person could mention more issues at this question.
7 Advances in Meteorology 7 Summer Plant trees Autumn Construct shade structures (%) Significant Slight None Figure 6: Degree of the modification requirements of the visitors related to the design of the area. The differences between the seasons are found to be small. As a positive factor, most people emphasized the diversity andhighqualityoftheplaygroundtoysaswellastheclosure and security of the area. Many people found the park to be clean and well equipped. The large size of the area, the amount of shady places, and the existence of the playhouse were also mentioned a few times (Figure 5(a)). The high level of satisfaction is reflected by the fact that 58.3% (in summer) and57.1%(inautumn)oftheintervieweesdidnotmention any problem (Figure 5(b)). As a negative factor, however, the absenceorsmallamountofshadewaspointedoutbyseveral people (.7% and 16.9%, resp.). In addition, a few people emphasized the type of the dominant land cover (gravel instead of grass) and the absence of a (drinking) fountain or apool(figure5(b)). The dissatisfaction of the visitors could be reduced even more by creating more pleasant and comfortable thermal conditions in the area. To facilitate this complex process, finally the possible modification requirements in the area were surveyed where a person could mark more factors. In accordance with the overall satisfaction (Figure 4) and the few deficiencies found (Figure 5(b)), about 60% of the people would not change anything in the design in both seasons and only a few percent of them would modify it significantly (Figure 6). The most frequently marked modification requirements are tree planting and the construction of shade structures which reflect the main deficiency (absence of shade), that is, most people would prefer shady conditions in both seasons (Figure 7). The shade structures would be more desired in summer probably due to human thermal aspects,thatis,theintensesummerheatload.however,more plants are desired in autumn which may have a primarily aesthetic facet because of the decline of vegetation in autumn. Further important demands are the placement of a fountain and change in land cover (grass instead of gravel) which has both aesthetic and thermal aspects Planning Proposals for Solutions to Improve Thermal Comfort. In the case of the presented playground, it would be highly desirable to ensure suitable shading conditions in order to reduce the heat load of the children and the Construct fountain Change land cover Increase number of benches Change location of benches Others (%) Summer Autumn Figure 7: Modification requirements of the respondents related to the area design (a person could mark more factors). accompanying adults (often elderly people). This requirement is clearly reflected in the demands of the visitors according to the questionnaire survey described in Section 3.2. Themost obvious and natural solution may be to plant trees because of their shading and aesthetic qualities. Although there are some trees in the most uncomfortable middle parts of the studied area, they are too young to provide shade and will remain like this for a long time. It could be a good option to plant adult trees, but we think that it is not economical to replace the existing young trees in the playground with adult trees. Moreover, the thermal effects of adult trees strongly vary by season since they can reduce hot thermal conditions in summer; however, shading is not really required in autumn [43]. Another natural solution may be to create some green roofs, however it is not really possible in the study area. Maybe greening of the southern and eastern walls of the playhouse would be appropriate for this purpose. Thus the most practical option is to construct artificial and temporary shade structures in the unpleasant areas. These devices are to effectively reduce the amount of direct sunlight in the period of high heat stress (in summer, around noon) but allow it to reach the ground in cooler times of the year. Another advantageistoallowforcross-ventilationbelow. Such structures can be, for example, temporary shade sails (Figures 8(a) and 8(b)) or large shade umbrellas (Figure 8(c)) and might be placed at least above the most
![8 Advances in Meteorology (a) (b) (c) (d) Figure 8: Proposals for solutions to reduce heat stress by shade structures during summer: (a) and (b) shade sails [44, 45], (c) shade umbrella [46], and (d)](/docs-images/92/108132153/images/8-0.jpg "artificial shade canopy [photo: N. K antor]. exposed parts of the area during summer heat, especially above the most frequently used jungle gym system (in the northeast, see Figure 1).")


8 8 Advances in Meteorology (a) (b) (c) (d) Figure 8: Proposals for solutions to reduce heat stress by shade structures during summer: (a) and (b) shade sails [44, 45], (c) shade umbrella [46], and (d) artificial shade canopy [photo: N. K antor]. exposed parts of the area during summer heat, especially above the most frequently used jungle gym system (in the northeast, see Figure 1). There are examples of using artificial shade canopies (Figure 8(d)) which consist of small resistant plastic items that do not prevent air movement below, but properly protect from strong sunlight around midday due to their adjusted inclination. Additionally, it would be desirable to construct a fountain in the studied area which could improve both thermal and aesthetic conditions. 4. Conclusion In the studied playground, many children and adults spend their time most of the year and are often exposed to thermal stress conditions which are highly influenced by the design of the area. It is particularly necessary to manage these microclimatically different areas and therefore to provide information to the responsible decision makers and urban planners to make the best choices from the thermal comfort point of view. According to the analysis of the simulated thermal conditions, remarkable microclimatic differences were found in the two examined seasons and times. The most unpleasant areas were in the middle and northern parts of the area as well as around the playhouse in summer. The shady southern areas had favourable microclimate even in the summer afternoon. However, in autumn, cool conditions already appeared in these places. The detected thermal comfort differences depend on the sun elevation and the resulting shaded conditions caused by the vegetation and the surrounding buildings. Besides the direct sunlight, the radiation of the heated surfaces can greatly contribute to the thermal stress conditions. The thermal conditions prevailing in the playground highly influence the thermal perception of humans. This is clearly reflected in the involuntary behaviour of visitors altering their spatial distribution depending on the momentary thermal conditions. For example, most people were not exposed to the direct solar radiation in the summer day and preferred comfortable spaces. However, it is important to point out that the location and the preference of the playground equipment also have significant impact on the patterns in both seasons, and it can increase the probability of exposure to stress conditions. In order to reduce the unpleasant effects of heat load on the visitors, it would be desirable to construct artificial and temporary shade structures especially above the most frequently used toys. This demand, as well as tree planting and placement of a fountain, is clearly supported by the conducted onsite survey and it would be a significant step forward in providing more liveable microclimatic conditions in the area. As a negative factor, most people emphasized the absence or small amount of shade. However, most interviewees were fully satisfied and would not change anything in the design or only slight changes are required. More than half of the respondents did not mention any problem and pointed out the diversity and high quality of the playground equipment and the cleanliness as well as the closure and security of the area. The methods applied in the study (modelling and onsite surveys) can contribute to encouraging sustainable and climate-friendly urban development and can be generally
9 Advances in Meteorology 9 applicable to other similar situations. The ENVI-met simulations can be a useful tool to reveal thermal differences in microscale spaces, but the results should be considered with some caution. Due to its high complexity, the model computationisslowespeciallyincaseoflowspatialresolution (1 m or less) making it slightly difficult to apply in planning practice. However, the model takes also the thermal effects of surface cover into account which makes it beneficial in practice. Application of microclimate models in urban planning is suggested together with adequate onsite measurements reflecting the real microclimatic conditions in order to validate the outcomes of the simulations. There is a need for a generic microclimate model which takes the effects of all factors influencing thermal conditions (vegetation, buildings, and surface cover) into consideration. By means of such a complexmodel,theonsitemeasurementscanbeeliminated before a construction process begins. Our further study will be directed to compare the results with those from other microclimate models (e.g., RayMan) as well as from onsite measurements. Acknowledgment Special thanks are due to N. Kántor and Á. Takács for their tireless participation and coordination in the onsite questionnaire survey. Thanks to E. Tanács for proofreading of the paper. References [1] UNFPA, The state of world population 2011, Report of the United Nations Population Fund, New York, NY, USA, [2] IPCC, Contribution of working groups I, II and III to the fourth assessment report of the intergovernmental panel on climate change, in ClimateChange2007:SynthesisReport, R. K. Pachauri and A. Reisinger, Eds., IPCC, Geneva, Switzerland, [3] M. Nikolopoulou and S. Lykoudis, Thermal comfort in outdoor urban spaces: analysis across different European countries, Building and Environment, vol.,no.11,pp , [4] I.Eliasson,I.Knez,U.Westerberg,S.Thorsson,andF.Lindberg, Climate and behaviour in a Nordic city, Landscape and Urban Planning,vol.82,no.1-2,pp.72 84,2007. [5] S. Thorsson, Urban climate spaces a multi- and interdisciplinary research project, in Urban Climate News, vol. 30, pp. 11, [6] H. Mayer, KLIMES a joint research project on human thermal comfort in cities, Berichte Des Meteorologischen Instituts Der Albert-Ludwigs-Universität Freiburg, vol.17,pp , [7] M. Nikolopoulou, N. Baker, and K. Steemers, Thermal comfort in outdoor urban spaces: understanding the Human parameter, Solar Energy,vol.70,no.3,pp.227 2,2001. [8] S. Thorsson, M. Lindqvist, and S. Lindqvist, Thermal bioclimatic conditions and patterns of behaviour in an urban park in Göteborg, Sweden, International Biometeorology, vol.48,no.3,pp ,2004. [9] M. Nikolopoulou and S. Lykoudis, Use of outdoor spaces and microclimate in a Mediterranean urban area, Building and Environment,vol.42,no.10,pp ,2007. [10] T. Lin, Thermal perception, adaptation and attendance in a public square in hot and humid regions, Building and Environment,vol.44,no.10,pp ,2009. [11] J. Spagnolo and R. de Dear, A field study of thermal comfort in outdoor and semi-outdoor environments in subtropical Sydney Australia, Building and Environment,vol.38, no.5,pp , [12] S. Oliveira and H. Andrade, An initial assessment of the bioclimatic comfort in an outdoor public space in Lisbon, International Biometeorology,vol.52,no.1,pp.69 84, [] N. Kántor, L. A. Égerházi, and J. Unger, Subjective estimation of thermal environment in recreational urban spaces part 1: investigations in Szeged, Hungary, International Biometeorology,vol.56,no.6,pp ,2012. [14] E. Krüger,P.Drach,R.Emmanuel,andO.Corbella, Urbanheat island and differences in outdoor comfort levels in Glasgow, UK, Theoretical and Applied Climatology, vol. 112, pp , 20. [15] M. Nikolopoulou and K. Steemers, Thermal comfort and psychological adaptation as a guide for designing urban spaces, Energy and Buildings,vol.,no.1,pp ,2003. [16] I. Knez and S. Thorsson, Influences of culture and environmental attitude on thermal, emotional and perceptual evaluations of apublicsquare, International Biometeorology,vol.50, no.5,pp ,2006. [17] I.Knez,S.Thorsson,I.Eliasson,andF.Lindberg, Psychological mechanisms in outdoor place and weather assessment: towards a conceptual model, International Biometeorology, vol. 53, no. 1, pp , [] I. Eliasson, The use of climate knowledge in urban planning, Landscape and Urban Planning,vol.48,no.1-2,pp.31 44,2000. [19] S. Lenzholzer, Research and design for thermal comfort in Dutch urban squares, Resources, Conservation and Recycling, vol. 64, pp , [20] L. Shashua-Bar, D. Pearlmutter, and E. Erell, The cooling efficiency of urban landscape strategies in a hot dry climate, Landscape and Urban Planning, vol.92,no.3-4,pp.179 6, [21] J. He and A. Hoyano, Measurement and evaluation of the summer microclimate in the semi-enclosed space under a membrane structure, Building and Environment, vol.45,no.1, pp , [22] M.F.Shahidan,M.K.M.Shariff,P.Jones,E.Salleh,andA.M. Abdullah, Acomparison ofmesua ferrea L. and Hura crepitans L. for shade creation and radiation modification in improving thermal comfort, Landscape and Urban Planning,vol.97,no.3, pp , [] T. Lin, A. Matzarakis, and R. Hwang, Shading effect on longterm outdoor thermal comfort, Building and Environment, vol. 45, no. 1, pp , [24] A. Chudnovsky, E. Ben-Dor, and H. Saaroni, Diurnal thermal behavior of selected urban objects using remote sensing measurements, Energy and Buildings, vol. 36, no. 11,pp , [25] L. Doulos, M. Santamouris, and I. Livada, Passive cooling of outdoor urban spaces. The role of materials, Solar Energy,vol. 77,no.2,pp.1 249,2004.
10 10 Advances in Meteorology [26] Á. Gulyás, J. Unger, and A. Matzarakis, Assessment of the microclimatic and human comfort conditions in a complex urban environment: Modelling and measurements, Building and Environment,vol.,no.12,pp ,2006. [27] A. Matzarakis, F. Rutz, and H. Mayer, Modelling radiation fluxes in simple and complex environments application of the RayMan model, International Biometeorology,vol.51, no. 4, pp , [28] L. Shashua-Bar, I. X. Tsiros, and M. Hoffman, Passive cooling design options to ameliorate thermal comfort in urban streets of a Mediterranean climate (Athens) under hot summer conditions, Building and Environment,vol.57,pp ,2012. [] F. Ali-Toudert and H. Mayer, Effects of asymmetry, galleries, overhanging facades and vegetation on thermal comfort in urban street canyons, Solar Energy, vol.81,no.6,pp , [30] Á. Szűcs, Wind comfort in a public urban space case study within Dublin Docklands, Frontiers of Architectural Research, vol. 2, pp , 20. [31] D. Fröhlich and A. Matzarakis, Modeling of changes in thermal bioclimate: examples based on urban spaces in Freiburg, Germany, Theoretical and Applied Climatology, vol. 111, no. 3-4, pp , 20. [32] L. A. Égerházi and N. Kántor, Area usage of two outdoor public places with regard to the thermal conditions observationbased human thermal comfort study in the centre of Szeged, Acta Climatologica et Chorologica Universitatis Szegediensis,vol , pp , [33] L. A. Égerházi, N. Kántor, Á. Takács, and J. Unger, Patterns of attendance and thermal conditions on a pedestrian street, in Proceedings of the 8th International Conference on Urban Climate,2012,paper169. [34] L. A. Égerházi, N. Kántor, and T. Gál, Evaluation and modelling the micro-bioclimatological conditions of a popular playground in Szeged, Hungary, International Review of Applied Sciences and Engineering,vol.4,no.1,pp.57 61,20. [] C. Koppe, S. Kovats, G. Jendritzky, and B. Menne, Heatwaves: risks and responses, in Health and Global Environmental Change, Series No. 2, World Health Organization, WHO Regional Office for Europe, Copenhagen, Denmark, [36] G. Péczely, Climatology, Nemzeti Tankönyvkiadó, Budapest, Hungary, 1979 (Hungarian). [37] M. Bruse and H. Fleer, Simulating surface-plant-air interactions inside urban environments with a three dimensional numerical model, Environmental Modelling and Software, vol., no. 3-4, pp , [38] M. Bruse, ENVI-met website, [39] Wyoming Weather Web, Weather information from the University of Wyoming, Department of Atmospheric Science, number 2). [40] H. Mayer and P. Höppe, Thermal comfort of man in different urban environments, Theoretical and Applied Climatology,vol. 38,no.1,pp.43 49,1987. [] P. Höppe, The physiological equivalent temperature a universal index for the biometeorological assessment of the thermal environment, International Biometeorology, vol. 43,no.2,pp.71 75,1999. [42] A. Matzarakis and H. Mayer, Another kind of environmental stress: thermal stress, WMO Newsletter, vol., pp. 7 10, [43] P. Cohen, O. Potchter, and A. Matzarakis, Daily and seasonal climatic conditions of green urban open spaces in the Mediterranean climate and their impact on human comfort, Building and Environment,vol.51,pp.285 5,2012. [44] solutions/industry/ schools/playground shade/coloured shade sails with yell. [45] [46] solutions/structures/ pyramid shade/pyramid shade for playground.


11 International Ecology Geochemistry Mining The Scientific World Journal Scientifica Earthquakes Paleontology Journal Petroleum Engineering Submit your manuscripts at Geophysics International Journal of Advances in Mineralogy Geological Research Advances in Geology Climatology International Advances in Meteorology International Atmospheric Sciences International Oceanography Oceanography Applied & Environmental Soil Science Computational Environmental Sciences