Certificate change of SPV Name. DMIC IITGNL Site Layout Plan Report. Khasra Details and Lease Plan. Principal Water Allocation Letter
|
|
|
- Ashley Garrison
- 5 years ago
- Views:
Transcription
1 EIA of DMIC Integrated Industrial Township Greater Noida [DMIC IITGNL] List of Annexures Sr. No Annexures Annexure- I Certificate change of SPV Name Annexure- II DMIC IITGNL Site Layout Plan Report Annexure- III Khasra Details and Lease Plan Annexure- IV Principal Water Allocation Letter Annexure- V Authorization Power Allocation Letter Annexure- VI Environmental Monitoring Report and Data Collection Programme Annexure- VII Land Allotment Letter DMIC IITGNL Annexure- VIII All Approved Drawings/ Maps Annexure- IX Affidavit On Stamp Paper
2 EIA of DMIC Integrated Industrial Township Greater Noida [DMIC IITGNL] Annexure- I Certificate change of SPV Name

3
4 EIA of DMIC Integrated Industrial Township Greater Noida [DMIC IITGNL] Annexure- II DMIC IITGNL Site Layout Plan Report

5
6 Revision Status REV NO. DATE DESCRIPTION P For submission to DMICDC and GNIDA to review and comment P For submission to DMICDC and GNIDA to review and comment P For submission to DMICDC and GNIDA P For submission to DMICDC and GNIDA P For submission to DMICDC and GNIDA REV NO. DATE PREPARED BY CHECKED BY CLEARED BY APPROVED BY P JS/SD/TP/IK USN/SC BST BMD P JS/SD/TP/IK USN/SC BST BMD P SD/AC/IK USN/SC BST BMD P PH/SD/AC/IK USN/SC BST BMD P PH/SD/AC/IK USN/SC BST BMD DOCUMENT NO.: TCE.7504A-INFBU-292-BS-04 (P4) Note: Present report is to be viewed in conjunction with two supplementary reports titled: 1. Validation of Business Plan for Integrated Industrial Township of DMICDC at Greater Noida 2. Final Urban Design Framework Report
7 4.1.1 Bench-marking for Land Use Distribution for Select Projects Bench-marking for FAR of Select Projects Industry Profiling Study Table of Contents 4.2 Additional Bench Marking Studies Master Planning Executive Summary Introduction Background DMIC and the Project Project Status Client s Vision Bench-Marking for Sustainability Aim and Objectives of the Project Summary Scope of Work Transport Planning Best Practices Purpose of Final Site Layout Plan Report International Best Practices for Utilities IIT Project Approach Summary Methodology for the Project Data Review Review of Proposed Concept Master Plan Review of Proposed Transport Network Review of Proposed Infrastructure & Utilities: Design Basis Basis for Industry Mix Basis for Land use Distribution Basis for Dense Vertical Development GNIDA Lease Plan Clients Vision Observations on Change in Project Boundary Planning Principles and the Concept GNIDA Master Plan influence on the Proposed Final Site Layout Plan Final GNIDA Master Plan GNIDA Master Plan Cluster Conceptualization GNIDA Building Bye-Laws Neighbourhood/ Sector Level Core Principles Topography Survey Site Level Core Principles Location & Significance Topography Site Features Distinct Features Transport Planning Principles '5D' Smart Growth Planning Principles Transport Network Planning Principles Summary Project Site Appreciation Final Site Layout Plan Options Regional Context Site Appraisal Site Layout Plan Option Option 1 Final Site Layout Plan Features Proposed Land use Distribution Option Resident Population Estimation Option Site Description Existing Infrastructure Site Opportunities and Challenges Summary National International Best Practices... Background Site Layout Plan Option Option 2 Site Layout Plan Features Proposed Land use Distribution Option Resident Population Estimation Option Site Opportunities Site Challenges Planning Approach and Principles Planning Approach Prefeasibilty Study for Integrated Industrial Township China Belarus Industrial park Transit Oriented Development, Curitiba Mahindra World City, Jaipur Central Business District, Singapore Songdo Hi-tech City, South Korea Tianjin Hi-tech Park (Eco-City), China Proposed Urban Fabric Rationale for bench-marking Hi- Tech (Type A-Flatted) Industries Bio- Tech Industries
8 R & D Industries Hi-tech (Type B-IT/ITES) Industries Residential Clusters Commercial Buildings Green Open Spaces Power Transportation Introduction Roadway Classification Roadway Cross-Sections Freight Circulation Strategy Off-Street Parking Estimates Parking Guidelines Parking Requirements Parking Provision Network Statistics Transportation Indices Sustainability Statistics Introduction PNG CNG Infrastructure Plan General Population for water supply assessment Prevalent Water Supply Norms Adopted Norms for IIT Water Demand Assessment Source of Water Water Treatment Options Water Quality Standards after Treatment Water Supply System- Features Best Practises adopted Selection of ESR site Final Layout Plan Option Assessment Smart City Pillars of the Integrated Industrial Township Striving towards a Low Carbon and Resource Efficient Future The Recommended Option Final Layout Plan Final Layout Plan Statistics Resident Population Estimation for IIT Greater Noida Sustainability Score of the Final Layout Plan Parameters Considered for achieving Sustainability Quantifying the Sustainability Parameters Waste Water Management General Scope of this Report Data Center Sizing Pathway System for OSP Backbone Infrastructure Manholes-Hand holes: Gas Utility Key Recommendations Water Supply Scope Power Demand Calculation Power Source Identification Selecting voltage levels for transmission & distribution for IIT: Location of 220kV GIS Sub-Station (Main Receiving Substation-MRSS): Space Planning for Internal Power Distribution Observations on Existing Transmission Lines Renewable Energy Potential: Solar powered LED street lighting: Information and Communication Technologies (ICTs) Component Comparative Analysis Proposal for Solid Waste Management within Project Boundary Tentative Proposal for Transfer Station & Site Selection: Site Selection for Transfer Station (TS) Planning for different types of waste generated from Project area: General Waste Water Generation Waste Water Collection System Wastewater/Sewage Treatment Plant Zero Discharge Concept Recycling of Wastewater Detailed Final Site Layout Plan for Proposed IIT Phasing Strategy Storm Water Drainage Introduction Intensity of Rainfall Design Parameters for Storm Water Drains Design Criteria for Storm Water Drain Proposed Storm Water Drainage System Phasing Strategy Way Forward Phasing Strategy Phasing Strategy Way Forward Preliminary Cost Estimate Solid Waste Management General Tentative Quantity & Area Required: Approach to Costing Water Supply Infrastructure Sewerage Infrastructure
9 Storm Water Drainage Infrastructure Solid Waste Infrastructure Road Infrastructure Power Infrastructure ICT Infrastructure Gas Infrastructure Site Development and Land scaping List of Appendices.. Appendix A - Village Integration Strategy... i Appendix B: Social Infrastructure... iii List of Annexures... Annexure I: Cul-de-Sac Profile 1... vii Annexure II: Cul-de-Sac Profile 2... viii Annexure III:Correspondence between Power Distributor and GNIDA... ix Annexure IV :Water Demand Calculation... xi Annexure V Maps & Drawings... xii List of References xvii List of Tables Table 2-1: Proposed Industry mix, Area requirement and Employment Generation Table 2-2: Proposed Employment Generation and Population for IIT as per Pre-feasibility Report Table 2-3: Proposed Landuse distribution and FAR for IIT as per Pre-feasibility Report Table 2-4: Summary of Master Planning Components for Concept Master Plan from Pre-feasibility Report Table 2-5: Recommended Land use distribution within IIT as per GNIDA Master Plan Table 2-6: Permissible Ground Coverage, FAR and Height for Industrial Buildings in GNIDA bye-laws Table 2-7: Permissible Ground Coverage, FAR and height for Commercial Buildings in GNIDA bye-laws Table 4-1: Landuse Distribution of Select Projects Table 4-2: Bench-marking for FSI for Select Projects Table 4-3: Industrial Profile Mix of Select Projects Table 4-4: Landuse Distribution of Belarus Industrial Park Table 4-5: Landuse Distribution of Mahindra World City Table 4-6: Benchmarking for Sustainability in Urban Planning case of Townships Table 4-7: Benchmarking for Sustainability in Planning: Cities Table 5-1: Recommended Land use Distribution for IIT (GNIDA Master Plan) Table 6-1: Proposed Land use Distribution for Site Layout Plan Option Table 6-2: Projected Resident Population for Option 1: GNIDA FAR Values Table 6-4: Proposed Landuse Distribution for Site Layout Plan Option Table 6-4: Projected Resident Population for Option 2: GNIDA FAR Values Table 6-5: Projected Resident Population for Option 2: Future Phase Table 7-1: Parking Norms GNIDA Building Regulations Table 7-2: Parking Requirement for IIT, Greater Noida Table 7-3: Network Statistics Table 8-1: Prevalent Water Supply Norms/Standards Table 8-2: Water Demand-Potable, Non-Potable Table 8-3 Summary of Waste Water Generation Table 8-4: Catchment details Table 8-5: Type of Waste and Generation as per CPHEEO & Regional Centre for Urban and Environmental Studies, (RCUE) Lucknow for Agra City Table 8-6: Space Requirements for Electrical Infrastructure Table 8-7 : Systems / Sub-systems & Services to be covered as a part of server sizing for Data centre Table 8-8: Server Sizing for Data Centre Table 8-9: Telecom Operators providing services in Uttar Pradesh Table 9-1: Option Assessment of the Final Site Layout Plan Table 9-2: Smart City Pillars for the Integrated Industrial Township Table 9-3: Low Carbon Assessment Matrix Table 9-4: Landuse Distribution for Final Site Layout Plan Table 9-5: Projected Resident Population for Final Layout Plan: GNIDA FAR Values Table 9-6: Projected Resident Population for Final Layout Plan: Future Phase Table 9-7: Proposed Built-up Area and Population for IIT Greater Noida Table 10-1: Forecasted YOY Absorption for Landuse Categories (in percentages) Table 11-1 Summary of Block Cost Estimate for all infrastructure works Table 11-2: Water Supply Infrastructure Cost Table 11-3: Sewerage Infrastructure Cost Table 11-4: Storm Water Drainage Infrastructure Cost Table 11-5: Solid Waste Management Infrastructure Cost Table 11-6: Road Infrastructure Cost Table 11-7: Power Infrastructure Cost Table 11-8: Site Development and Land Scaping Cost Table 11-9: ICT Infrastructure List of Figures Figure 1-1: Location of Integrated Industrial Township with respect to DMIC Influence Zone Figure 1-2: Client s O je tives for the Proje t Figure 1-3: Consultant's Approach for the Project Figure 1-4: Schematic Representation of the Project Methodology Figure 1-5: Methodology for the Final Layout Plan Stage Figure 2-1: Proposed Master Plan as per Prefeasibility Report for IIT Figure 2-2: Existing Road Network Figure 2-3: Proposed Transport Network in Prefeasibility Report for IIT Figure 2-4: Existing Power Supply to Site Figure 2-5: Topographical Survey Map of Site Figure 2-6: Digital Elevation Model (DEM) of Site Figure 3-2: Zoning Analysis Site Surroundings Figure 3-1: Project Site and Proposed Surrounding land uses in Draft GNIDA Master Plan Figure 3-3: Regional Context of the Site Figure 3-4: IIT Site Location, in Gautam Buddha Nagar Figure 3-5: Site Map Showing References for Site Images Figure 3-6: Existing Structures within the revised Project Boundary Figure 3-7: 220 kv HTL along eastern edge of 60m N-S sector road Figure 3-8: Existing pond within the Revised Project boundary Figure 3-9: Samshan abutting the north end of the site Figure 3-10: 45m ROW Road along the South of Kot Escape Figure 3-11: Junction at the West Edge of the Kot Escape Figure 3-12:Dense Tree Plantation in Site Figure 3-13: 6 - Rithori Settlement Figure 3-14: Existing Structures within the Site
10 Figure 3-15: Railway Crossing Figure 3-16:Ajayabpur Settlement Figure 3-17: Partially Built Roads within the Site Figure 3-18: Existing Structures within the site Figure 3-19: Ajayabpur Railway Station Figure 3-20: Kot Escape during Monsoon Figure 3-21: Electric Poles within the Site Figure 3-22: Proposed GNIDA Master Plan Road Figure 3-23: Existing Road in Integrated Industrial Township Figure 3-24: Site Opportunities Figure 3-25: Site Challenges Figure 4-1: Master Plan Dholera SIR Figure 4-2: GIFT city Master Plan Figure 4-3: Green Space allocated in GIFT city Figure 4-4: Du-Bio-tech Park, Dubai Master Plan Figure 4-5: Analysis on Zoning of Du-Biotech Park Layout Plan Figure 4-6: Aerial view for Du-Biotech Park Figure 4-7: Kulim Hi-tech Park, Layout Plan Figure 4-8: Analysis on Zoning of Kulim Tech Park Layout Plan Figure 4-9: One-north Master Plan, Singapore Figure 4-10: Networking of Green spaces in the Master Plan Figure 4-11: Iconic Building Proposal in Dholera SIR Figure 4-12: Proposed Built-Form for GIFT city Figure 4-13: Iconic Building Proposed for GIFT city Figure 4-14: Location Map of China Industrial Belarus park Figure 4-15: Conceptual Planning of the Park Figure 4-16: Functional Zoning of the Industrial Park Figure 4-17: Master Plan of Belarus Industrial Park Figure 4-18: Zoning along TOD Figure 4-19: Curitiba Cityscape Figure 4-20: Curitiba Cityscape along Transit Corridor Figure 4-21: View of Mahindra World City Figure 4-22: Aerial View of Mahindra World City Figure 4-23: Land use Map of Mahindra World City, Jaipur Figure 4-24: Singapore CBD Area Figure 4-25: FAR Provision in Singapore CBD Area Figure 4-26: Singapore - Land use Figure 4-27: Mater Plan: Songdo Hi-tech City Figure 4-28: Commercial Complexes in Songdo IBD Figure 4-29: Residential Towers in Songdo Figure 4-30: Location of Map for Tianjin Eco-City China Figure 4-31: Illustrative View of the Tianjin Eco-City Figure 4-32: Concept of Eco-Cell Modules Figure 4-33: Eco-valley Tianjin Figure 4-34: Tianjin Master Plan Figure 4-34: Master Plan, Tianjin Figure 4-36: Functional Zoning, Tianjin Figure 4-37: Industry Zoning, Tianjin Figure 4-38: International Best Practices Figure 4-39: Las Vegas BRT Figure 4-40: Ridership Requirements Figure 4-41: Rubber Tired Trolley, Klamath Falls, Oregon Figure 5-1: Recommended Land use Distribution for IIT as per GNIDA Figure 5-5: Linear Shape of the Project Site Figure 5-3: Predominant Wind-Direction NW to SE Figure 5-4: Open Spaces in Site Layout Plan Figure 5-6: Wind Direction and Sector Planning Figure 5-7: Land use Zoning Figure 5-8: Green Open Spaces and Linear Parks Figure 5-9: Industrial Cluster - Concept Figure 5-10: Industrial Cluster - Sample Layout Figure 5-11: Residential Cluster - Concept Figure 5-12: Residential Cluster - Sample Layout Figure 5-13: Smart Growth Planning Principles Figure 5-17 Directness Index Figure 5-14: Link to Node Ratio Figure 5-15: Junction Ratio Figure 5-16: Directness Index Figure 6-1: IIT Site Layout Plan - Option Figure 6-2:.Pie Chart showing Proposed Landuse Distribution for Option Figure 6-4: Proposed Landuse Distribution for Option 1 vis-à-vis the Landuse Budget Figure 6-4: Proposed Building Height for Option 1 Final Site Master Plan Figure 6-5: Proposed FAR for Option 1 Final Site Master Plan Figure 6-6: Proposed Site Master Plan Option 2 for Integrated Industrial Township Figure 6-7:.Pie Chart showing Proposed Landuse Distribution for Option Figure 6-9: Proposed Landuse Distribution for Option 2 vis-à-vis the Landuse Budget Figure 6-9:Proposed FAR for Option 2 Final Site Layout Plan Figure 6-10: Proposed Building Height for Option 2 Final Site Layout Plan Figure 6-11: Proposed Hi-tech Industry in Option 1 Final Layout Plan Figure 6-12: Proposed Hi-tech Industry in Option - 2 Final Layout Plan Figure 6-13: Illustrative view showing the Hi-Tech industries cluster Figure 6-14: Proposed Bio-tech Industry in Option - 1 Final Site Layout Plan Figure 6-15: Proposed Bio-tech Industry in Option - 2 Final Site Layout Plan Figure 6-16: Illustrative view showing the Bio-Tech industries cluster Figure 6-17: Proposed R&D industries in Option 1 Final Site Layout Plan Figure 6-18: Proposed R&D industries in Option 2 Final Site Layout Plan Figure 6-19: Illustrative view showing the Bio-Tech industries cluster Figure 6-20: Proposed IT Industry in Option 1 Final Site Layout Plan Figure 6-21: Proposed IT Industry in Option 1 Final Site Layout Plan Figure 6-22: Illustrative view showing the IT industries cluster Figure 6-23: Proposed Residential use in Option 1 Final Site Layout Plan Figure 6-24: Proposed Residential use in Option 2 Final Site Layout Plan Figure 6-25: Illustrative view showing the residential cluster Figure 6-26: Proposed Commercial Use in Option 1 Final Site Layout Plan Figure 6-27: Proposed Commercial Use in Option 2 Final Site Layout Plan Figure 6-28: Proposed Green Spaces in Option-1 Final Site Master Plan Figure 6-29: Proposed Green Spaces in Option-2 Final Site Master Plan Figure 6-30: Illustrative view showing Core Figure 6-31: Illustrative view showing Entrance Cluster Figure 6-32: Illustrative view showing Central Park cluster Figure 7-1: Roadway Classification Map Option Figure 7-2: Roadway Classification Map Option Figure 7-3: 30m ROW Roadway Cross-Section (North) Figure 7-4: 30m ROW Roadway Cross-Section (South Loop Road) Figure 7-5: 45m ROW Roadway Cross-Section Figure 7-6: 60m ROW Roadway Cross-Section Figure 7-7: 80m ROW Roadway Cross-Section Figure 7-8: Truck Circulation Plan for Option Figure 7-9: Truck Circulation Plan for Option
11 Figure 7-10: Commercial Parking Provision Figure 7-11: Residential Group Housing Parking Provision Figure 7-12: Residential EWS Parking Provision Figure 7-13: Industrial IT Parking Provision Figure 7-14: Industrial R&D, Hi Tech & Bio Tech Parking Provision Figure 7-15: Utilisation of Existing Roads Option Figure 7-16: Utilisation of Existing Roads Option Figure 7-17: Reduction in Vehicle Kilometres Travelled Option Figure 7-18: Reduction in Vehicle Kilometres Travelled Option Figure 7-19: Reduction in CO2 Emission Option Figure 7-20: Reduction in CO2 Emission Option Figure 7-21: Pedestrian and Cycle Network for Option Figure 7-22: Pedestrian and Cycle Network for Option Figure 7-23: Public Transport Network for Option Figure 7-24: Public Transport Network for Option Figure 8-1: Potential Sources of Water for IIT Figure 8-2: Existing Sewerage Network Figure 8-3 Surrounding drainage Features of project area Figure 8-4 Existing Drains at Site Figure 8-5: Location of the Solid Waste Transfer Station Figure 8-7: Integrated Operations Centre (IOC) ICT rooms layout (1st FLOOR) Figure 8-7: Integrated Operations Centre (IOC) ICT rooms layout (GND. Floor) Figure 8-8: Typical Layout of CCC & Tele presence Room Figure 8-9: Way Ducts Housed in Concrete Channel Figure 8-10: Entry System into Manholes Figure 8-11: Gas Supply System in and around Delhi/NCR Figure 9-1: Parameters for achieving Low Carbon Development Figure 9-2: Distribution of EWS in different locations Figure 9-3: Blue-Green Network for the township Figure 9-4: Walkability Catchment of Residential Zone Figure 9-5: Proposed Final Layout Plan_IIT Dadri Figure 9-6: Pie Chart showing Landuse Distribution for Final Site Layout Plan Figure 9-7: Proposed future FAR for Final Site Layout Plan Figure 9-8: Proposed Final Detailed Site Layout Plan Figure 9-9: illustrative view showing Central Park Figure 9-10: Illustrative view showing core Figure 9-11: Illustrative view showing entrance cluster
12 List of Abbreviations ASHRE American society of Heating, Refrigeration and Airconditioning ITE Institute of Transportation Engineers BOD Biochemical oxygen demand kw kilo Watt BRT Bus Rapid Transport lpcd Litres per Capita per Day CBRE Group CB Richard Ellis Group LRT Light Rail Transit CEPT Centre For Environmental Planning and Technology M Meter COD Chemical oxygen demand MoEF Ministry of Environment and Forests CPHEEO Central Public Health & Environmental Engineering Organisation MOHURD Ministry of Housing and Urban Rural Development CRZ Coastal Regulation Zone MOUD Ministry of Urban Development DCR Development Control Regulations MRS Main Receiving Station DFC Dedicated Freight Corridor MRTS Mass Rail Transit System DMIC Delhi Mumbai Industrial Corridor MSW Municipal Solid Waste DMICDC MVA Mega Volt Ampere DNGIR Dadri NOIDA Ghaziabad Investment Region NCR National Capital Region DSIRDA Dholera Special Investment Region Development Authority NEERI National Environmental Engineering Research Institute DTC Delhi Transport Corporation NMT Non Motorised Mode of Travel EHV Extra High Voltage NMV Non Motorised Vehicles EIA Environment Impact Assessment NOIDA New Okla. Industrial Development Authority ESR Elevated Service Reservoir NPCL Noida Power Company Limited EWS Economically Weaker Section NTDPC National Transport Development Policy Committee FAR Floor Area Ratio phi Persons per hectare FSI Floor Surface Index pphpd passenger per hour per direction G+4, G+12 etc. Ground plus Four storeys; Ground Plus Twelve Storeys etc. PRTS Personal Rapid Transit System GIS Gas Insulated Sub-station PSP Public Semi Public GNIDA Greater NOIDA Industrial Development Authority R&D Research and Development GSB Granular Sub Base RCUE Regional Centre for Urban and Environmental Studies GT Road Grand Trunk Road RFP Request for Proposal ha Hectare RITES Rail India Technical and Economic Service IEEE Institute of Electrical and Electronic Engineers ROW Right of Way IIT Integrated Industrial Township SCADA Supervisory control and data acquisition IRC Indian Roads Congress SCADA Supervisory Control & Data Acquisition ISO International Organization for Standardization SDBC Semi Dense Bituminous Concrete ISTS Inter state Transmission System SEB State Electricity board IT Information Technology SIR Special Investment Region ITDP Institute for Transportation and Development Policy Sq Ft Square feet 8
13 sq km Square Kilometre sq m Square meter STP Sewerage Treatment Plant UD Urban Design UDF Urban Design Framework UP Uttar Pradesh UPPCL Uttar Pradesh Power Corporation Limited UPPTCL Uttar Pradesh Power Transmission Company Limited UPSERC Uttar Pradesh State Electricity Regulatory Commission UPSRTC Uttar Pradesh State Road Transport Corporation URDPFI Urban & Regional Development Plans Formulation & Implementation VKT Vehicle Kilometres Travelled vph Vehicles Per Hour WMM Wet Mix Macadam WTP Water Treatment Plant WTP Water Treatment Plant YEIDA Yamuna Expressway Industrial Development Authority 9


14 Executive Summary E-1


15 E-2


16 E-3

17 E-4

18 E-5

19 Page is intentionally left Blank. E-6
20 Illustrative Road Cross-section 60m ROW Illustrative Road Cross section 45m ROW E-7


21 E-8


22 E-9


23 E - 10


24 Illustrative Detailed Master Plan for IIT Greater Noida E - 11


25 E - 12

26 E - 13
 along the alignment of proposed Multi-modal High Axle Load Dedicated")
27 1. Introduction Project Status The first chapter entails the project background, project objectives, approach and broad methodology. It provides an overview of the project assignment 1.1 Background DMIC and the Project The Government of India has envisaged the development of Delhi Mumbai Industrial Corridor (DMIC) along the alignment of proposed Multi-modal High Axle Load Dedicated Freight Corridor between Delhi and Mumbai, covering an overall length of 1,483 km. Further a special purpose company called Delhi Mumbai Industrial Corridor Development Corporation Limited (DMICDC) was incorporated to establish, promote and facilitate development of Delhi Mumbai Industrial Corridor Project. For the implementation of the proposed Integrated Industrial Township at Greater Noida a separate SPV is formed between DMIC Project Implementation Trust and GNIDA. The SPV has been constituted for development and management of the proposed Integrated Industrial Township. The proposed site for Integrated Industrial Township (hereinafter referred as IIT) is situated within the notified Greater NOIDA Master Plan 2021 planning area and is located at its south-eastern edge abutting the proposed Eastern Peripheral Expressway (EPE). The proposed EPE runs parallel to the site on the southern boundary and adjoins the site on Delhi-Howrah railway line in the east. The proposed site for Integrated Industrial Township has an area of approximately hectares. The Integrated Industrial Township project has been conceptualized to harness the potential of an already existing manufacturing cluster (Greater NOIDA), which is in very close proximity to its proposed location. Some of the key objectives associated with setting up of Integrated Industrial Township at Greater NOIDA are: a. To act as catalyst for the industrial development of the investment region by attracting skilled human resources at the Township, The Delhi Mumbai Industrial Corridor Development Corporation Limited (DMICDC) has identified a site of ha for the development of the Integrated Industrial Township under DADRI-NOIDA-GHAZIABAD Investment Region of Delhi Mumbai Industrial Corridor (DMIC) with the foresight of creating a skilled and employable work force for the large scale investments for the commercial and industrial development expected in DMIC region. The location of the Integrated Industrial Township with respect to DMIC influence zone is shown in Figure 1-1 below: b. To create benchmark for comprehensive built environment for future smart cities, in DMIC investment region. c. To strengthen the status of Greater NOIDA and NOIDA as a manufacturing destination in the National Capital Region (NCR). d. To encourage creation and growth of new business and economy as whole by fostering collaboration and innovation, also enhancing the development, transfer and commercially viable application of latest technology. e. To foster collaboration between industries and existing / proposed educational institutes. f. To promote new industries with value addition to existing industries. TATA Consulting Engineers (TCE) in consortium with ATKINS (hereinafter as the consultants) have been appointed to provide consultancy services, with brief scope of work as described in section 1.3 for undertaking development in line with DMICDC s vision for the Integrated Industrial Township. 1.2 Client s Vision DMICDC has prepared the pre-feasibility report for the envisaged development in July 2013 (prepared by Halcrow, Synovate and Knight Frank). As stated in the report, the project has been envisioned to create - a sustainable environment of knowledge based ecosystem integrated with industries leading to innovation and forward-thinking businesses and lifestyle amenities that will enable skilled workers to participate and create innovative research and development leading to new products and services to meet tomorrow s needs a. The quality of businesses, facilities and lifestyle amenities provided will determine the positioning of the Integrated Industrial Township and play an important role in attracting national and international tenants to locate here. b. The infrastructure and services should adopt the best practices of land use planning and be comparable or exceed the standards available globally. Figure 1-1: Location of Integrated Industrial Township with respect to DMIC Influence Zone Source DMICDC website
 contracts in package(s) for the entire area of the Integrated Industrial Township and provide technical assistance")
28 f Aim and Objectives of the Project To prepare bid documents for Design-Build (D&B) contracts in package(s) for the entire area of the Integrated Industrial Township and provide technical assistance in the process of the selection of successful D&B tender(s). g. To provide design technical oversight during Detailed Design process by the Design-Build contractor during hand holding period. h. To act as Owner s Representative providing technical oversight support to the Client during the detailed designing. 1.3 Scope of Work The brief scope of work under the current assignment has been divided into four stages i.e. Master planning, Preliminary Design Engineering, and Tender Preparation for internal infrastructure of the Industrial Township and hand holding period. The major activities in the above stages have been enlisted below: a. Review of Existing Master Plan and Pre-feasibility Study, Detailed Site Layout Plan and Infrastructure Plan b. Environment Impact Assessment (EIA) Approval c. Engineering surveys and preliminary engineering design for Infrastructure d. Preliminary Design Report, Bill of Quantities (BOQ) & Cost Estimates Figure 1-2: Client s Objectives for the Project e. Preparation of Tender Documents and Drawings Source Pre-feasibility study report for IIT f. The aims and objective of the project has been defined by DMICDC in the Request for Proposal (RFP) for the Preparation of Layout Plan and Preliminary Design Report along with Tender Documents for Development of Trunk Infrastructure for Integrated Industrial Township under DADRI - NOIDA - GHAZIABAD Investment Region of DMIC Project. Key elements that enable the achievement of these objectives have been summarized in Figure 1-2 above. The expected deliverables have been planned keeping in mind following objectives. a. To review the concept Master Plan and other available reports and update them as per the present requirement. b. To procure land acquisition map from GNIDA and set the site boundary as per the ground condition and the Khasra Map. c. To prepare the Site Layout Plan, landscape plan, environmental impact assessment and infrastructure plan for development of internal road network, water supply, waste water and sewage distribution network and its management system, power, communication network, etc including external connectivity to site. d. To prepare a Business plan with suggested development and governance model of the Integrated Industrial Township. Based on the most suitable development alternative, assess the project landed cost and carry out a broad-brush financial analysis to estimate expected revenue streams, cash flows for the project and the anticipated financial viability of the project which will form the basis of detailed financial model and Structuring of project for the transaction advisor. e. To prepare preliminary engineering design and drawings for roads and utility services for the Integrated Industrial Township suitable for a Design-Build (D&B) tender. Tender evaluation and selection of DB contractors g. Technical assistance to client after submission of detailed designs and construction drawings from DB contractors or on receipt of EIA clearance, whichever is later 1.4 Purpose of Final Site Layout Plan Report The Final Site Layout Plan Report is the third and final deliverable for Master Planning Stage (or Stage 1 of the project) after the Draft Site Layout Plan Report submission. The consultants framed the Final Site Layout Plan options for the flagship project, which would further act as guiding document for the development. The entire process of plan formulation and other aspects is compiled in the Draft Site Layout Plan Report and has also been submitted to the client. While developing the Draft Site Layout Plan for the project, it was sighted that the site included a 132 kv HT line all along the eastern edge of the site, which was highlighted while presenting the layout options in a joint meeting with the SPV. It was analysed that the HT line and the buffer required for it as per the Indian Electricity rules, occupies significant extent of the developable area within the site. This in turn had impacts on the recommended land use distribution as per the GNIDA Master Plan Besides meeting the prescribed land use distribution, it was anticipated that presence of a HT line would affect the saleability and functions of the adjoining plots. Gauging the impeding impacts of the site, removal of HT line became the prime concern for the client as well as for the consultants. The options for diversion or taking the HT line underground seemed constrained, as a consequence of which, the client recommended change in project extents for the IIT site. The decision on changing the project th boundary was notified to the consultants during a joint meeting on 19 August. The revised project boundary excluded the controversial 132kv HT Line within the previous boundary. The new boundary is shifted westward along the built roads of the eastern periphery of the site. In order to compensate the land, additional land parcels are added in the northern part, making the site more linear. However the project area remains same as that of ha. 1-2


29 This report includes the revised plan formulations and other aspects related to the change in the site boundary. Similar to the previous Draft Report, this report includes the following:a. Project Site Appreciation The DMIC project context, site appreciation. Surrounding area zoning analysis(as in GNIDA MASTER PLAN 2021), existing site assessment, opportunities and constraints of the area, existing infrastructure, assessment of existing infrastructure on the site b. Review and Analysis of previous Master Plan (as per Prefeasibility report for IIT by Halcrow) Review the proposed land-use zoning and the budget, review of proposed infrastructure and utilities. The implication of changes to the previous site layout plan such as change in the project boundary, increase in the area of existing settlements etc. c. Design basis - The design basis considered for preparation of options for Final Site Layout Plan such as the land use budget, the FAR and the industrial mix suggested as per Prefeasibility report for IIT, industrial profiling, site constraints and opportunities, zoning analysis and the green strategy approach d. The Final Site Layout Plan Options The theme for the options, the salient features of the options, the land use budget, assessment of the options, the proposed landuse, proposed employment generation and projected population, proposed concepts for urban fabric and characters of various landuse etc. e. Roads and Transportation network The proposed road hierarchy, suggested road sections, recommended practices for sustainable transportation options f. Figure 1-3: Consultant's Approach for the Project Infrastructure Demand Assessment for the proposed Site Layout plan based on the projected population such as water supply, waste sewerage, drainage, solid waste and industrial waste, power supply and most importantly transportation and roads, ICT etc. g. Phasing Strategy approach to the development of the site along with the way forward. 1.5 IIT Project Approach 1.6 Methodology for the Project The consultants have already narrated a Detailed Methodology at the initial stage in the Inception Report. A schematic representation of the same is exhibited in Figure 1-4 and Figure 1-5. As recommended during various stages of Master Planning, IIT at Greater Noida is proposed to be planned with focus on the aspects and planning concepts which attempt to achieve: a. Integrated master planning promoting Work-Live-Play-Learning environment b. Vibrant Industrial Spaces Mixed use and urban design with focus on open spaces to enhance the identity and quality of built environment c. Land optimization and intensification through industrial clustering and building typologies to achieve maximum green cover. The client vision, project objectives and the scope of work has led in formulating the overall approach for the development The consultant s aim is to provide sustainable and systematic approach to the project planning and designing. Keeping in view the client s vision and objectives, the consultants have distributed the milestone activities under four broad stages as depicted: Figure 1-4: Schematic Representation of the Project Methodology 1-3


30 At project initiation, the consultant s team had interacted with the stakeholders to understand the detailed project requirements. The core team has undertaken site visits, data collection, data review and analysis to collate the entire th outcome in the Inception Report. It was submitted on 20 March, Keeping in view the iconic nature and national importance the project the master planning team had undertaken benchmarking exercise and literature review in a detailed manner. The team had studied sustainable and ecofriendly townships alongwith various sustainable planning guidelines documents to adopt key concepts. The same has been implemented in approach whilst designing for this iconic township. In continuation with the project activities, the master planning team has prepared two Site Layout Plan options based on site appraisal, zoning analysis, design basis, planning principles. These options were formulated with the continuous review and feedback from internal as well as external (stakeholders) members. After receiving client s decision on the preferred option, it has been developed further as Final Site Layout Plan for the IIT for which the team has refined the proposed UDF and streetscape. All these inputs together with proposed transportation network and conceptual infrastructure planning had contributed towards forming the Final Site Layout Plan for the IIT. Based on the Final Site Layout Plan and the initial conceptual infrastructure demand and planning, the preliminary engineering design of the utilities would be detailed out. This would act as a base to arrive at cost estimates (for the utilities and other infra) and 3D model of the same would be prepared using the appropriate software(as mentioned in the Inception Report). In the third stage, after approval of the preliminary engineering design and cost estimates, the consultants would prepare the BOQ, tender documents, set the pre-qualification criteria for selection of contractor, evaluate the tenders and would assist client in selection of the contractors. During the final stage of the project, the consultants would continue their assistance in handholding of the project. The team would review and check the design drawings, GFC drawings and also represent in client s periodic meetings with the contractor for the project review and assist in problem solving. Figure 1-5: Methodology for the Final Site Layout Plan Stage Note: (A Draft Report was submitted on 15th July The Final Site Layout Plan Report based on the revised project boundary was submitted to the Client on 30th October This report is the revised version of the Final Site Layout Plan Report accommodating the comments from the Client and final comments on the Site Layout Plan which was discussed during the period of November and December.) This chapter has given an insight of the project background, approach and methodology. In the forthcoming chapters all the stages of Final Site Layout Plan formulation have been narrated in succession in the separate sections. 1-4

31 2. Data Review Table 2-1: Proposed Industry mix, Area requirement and Employment Generation 2.1 Prefeasibilty Study for Integrated Industrial Township In this section, the Consultants have included the review of background data, studies, and available report on the Project Site of IIT. This has been elaborated under various sub-heads in this chapter. The proposed Concept Plan in the Pre-feasibility report is based on the outcomes of the Market Assessment study for the project including surrounding region. The market study has driven the Master Plan Pre-feasibility report in stating the type of industries to come up, the area requirements for the respective industries and the land use distribution (with FAR). The pre-feasibility study report also lays out provision for basic infrastructure (roads, water supply, sewerage, storm water drainage etc.) and the phasing strategy. Sl. No. Industries 1. R&D This report is reviewed and analyzed under various headings in the subsequent sections. 21, Bio-tech Hi-tech 27, Total 58, Proposed Employment, Population and Density As per Prefeasibility report for IIT report (Table 8-1, page 132), the employment generation and projected population for this development has been calculated as follows: Table 2-2: Proposed Employment Generation and Population for IIT as per Pre-feasibility Report Sl. No. Landuse Category Total Built-up Area (ha) Employment Generation/ Population Unit rate 1. Hi-tech 190/ ha 27, Bio-tech 100/ ha 9, R&D 197/ ha 21, Commercial Mixed Use 25 sq m/ person 30,471 persons/ dwelling unit (DU area 200 sq m) 33, Review of Proposed Concept Master Plan As per the existing Master Plan the vision for the Integrated Industrial Township is stated as: to create a new type of industrial township model for India that may be referred as Silver Wrapped in Gold, whereby industry pillars like high tech, R&D, Bio-tech (silver), can become the high tech catalyst to support a new, symbolic relationship of community clustering to surround it (gold). The amenities surrounding the industrial clusters forming the community will essentially include commercial, residential, education, research, recreation, offices & administration uses. The industrial city will thus be planned with the key objective to create a knowledge based ecosystem integrated with industries leading to innovation and economic development. 5 Residential Total Figure 2-1: Proposed Master Plan as per Prefeasibility Report for IIT Source Pre-Feasibility Study Integrated Industrial Township at Greater Noida, 2013 Based on the vision and the market assessment study, the proposed Industry mix is as follows, the employment generation and the area requirement are as presented in the following table. Area Requirement (acres) Source: Table 3-3, Pre-Feasibility Report for Dadri IIT, 2013, Halcrow, Synovate, Knight Frank The unique concept proposed for the Master Plan is in suggesting innovation in new factory typologies including multi tenanted vertical manufacturing and stack-up factories, plug & play industrial parks with the industrial estates providing the physical framework and industrial infrastructure required to generate synergies among different industrial clusters to form a tightly-knit industrial community with a competitive edge. Employment Generation (incl. utilities) Employment Generation and Population 122,168 Source: Table 8-1, Pre-Feasibility Report for Dadri IIT, 2013, Halcrow, Synovate, Knight Frank As per Table2-2, the total employment generation under Industries is 58,081 whilst the residential population is 33,617. The total site area is ha and the overall population 2-1

32 (including industries and other land use) is 1, 22,168. This implies a gross density of c. 404 persons/ ha. The gross residential density is 111 persons/ ha and net residential density of 200 persons/ ha. Also the net industrial density sums up to be 168 persons/ ha. These figures indicate that the gross density of the overall development is quite higher. Similarly the net residential density (200 pph) is also high due to the higher FAR values assigned to this category Proposed Landuse Distribution and FAR The proposed land use distribution for Greater Noida IIT is presented in the following table. It shows that approximately 51% of land use is allocated for Industrial use, 11% for Residential, 6.3% for commercial and approximately 32 percent for Roads, Green spaces and Utilities. The table also highlights FAR for the respective land uses which range from 2.25 for Industrial, 4 for commercial and 5 for residential categories resulting into a Global FAR of 2 for the entire development. The proposed FAR distribution is depicted below. Table 2-3: Proposed Landuse distribution and FAR for IIT as per Pre-feasibility Report Land Use Category % Distribution Area (sq m) FAR Built-up Area (sq m) Industries 50.8% 1,537, ,458,738 Commercial Mixed Use 6.3% 190, ,765 Residential 11.1% 336, ,680,848 Utilities 1.5% 46, ,468 Greens & Water Bodies 13.4% 403, Roads 15.6% 471, Existing Structures 1.3% 39, % 3,024,921 TOTAL 5,940,818 Source: Table 5-1, Pre-feasibility Report for IIT, 2013 It is observed that the higher FAR is due to the residential category followed by the commercial category. Even the FAR value of 2.25 for industrial category is higher compared to FAR provision in GNIDA. This is due to the fact that the respective consultant has proposed stacked, vertical and plug & play type of industries (owing to the vision of a flagship project) which will necessitate these industries to build as multi-storey structures to fulfil this philosophy. This aspect is further analyzed in Chapter-4 under benchmarking of FAR and land-use distribution. The same section also addresses the Client s initial query with reference to land use distribution (primarily for open green spaces) and development potential for saleable area of the envisioned project Review of Proposed Transport Network Figure 2-2 shows the transportation network proposed in the Master Plan commissioned by DMIC. The Concept Plan transport network is based on the 2021 GNIDA Master Plan and utilises existing roads in the immediate vicinity of the site. Overall, the Concept Plan network provides good connectivity and encourages walk trips. However, the following limitations require modifications to the network to comply with GNIDA and IRC standards. 1. The BRT corridor in the Concept Plan extends north of the project boundary while the existing 60m ROW North-South ROW road terminates at the junction of the proposed 80m ROW road. Based on site visits and feedback received from GNIDA, the 60m ROW NorthSouth road is being extended beyond the proposed 80m ROW road and is proposed to terminate at Boraki. While the BRT corridor could be extended north of the proposed site, such a proposal is subject to approval from GNIDA. 2. The proposed 30m ROW North-South road (numbered 2) does not accommodate access to Rithori. Based on feedback provided by GNIDA, existing villages and Abadi areas should be provided with multiple access points along roads proposed within the IIT. 3. The proposed network consists of numerous 30m and 40m ROW roads. Based on feedback received from GNIDA, the minimum width for any road (except internal sector roads) should have a minimum ROW of 45m. 4. The network shows circular roads (numbered 4) near residential areas. While circular roads appear more aesthetically pleasing in the plan view, they result in higher costs and longer trip distances. Figure 2-2: Existing Road Network 5. Closely spaced junctions such as the one numbered 5 are undesirable from a design point of view. Such designs increase junction widths resulting in junctions footprints that are wider than necessary. 2-2

33 2.1.3 Review of Proposed Infrastructure & Utilities: Water Supply- As per the Pre-feasibility report, total water demand for the IIT has been assessed based on the land area, projected population and potential employment. For the purpose of calculating the total water demand, per capita consumption of 150 litres per day (LPD) and 45 litres per day (LPD) have been considered for domestic and floating population respectively. For industrial water demand, average demand of 30,000 litres per hectare (lph) has been considered. The total water demand based on the above-mentioned norm is 15.3 MLD. Key Observations on Proposed Water Supply Systems: It is assumed that treated water will be made available to the IIT. So, the cost for the source development of water is not considered in the report. a. It is observed that potable water demand considered for commercial areas is high as per CPHEEEO Manual, 45 lpcd for commercial areas. b. Basis of the assumption for Industrial water demand is not provided as the water demand varies according to the type of industry. c. Recycled water can be used to meet the non-potable water demand and landscaping water demand such as flushing and industrial purposes thus reducing the total water demand by 20%. The excess recycled water can be used by the industrial processes depending on the individual industry. Municipal solid waste shall be collected at transfer station and segregated. The biodegradable waste shall be treated. The recyclable shall be given for recycling and inert shall be disposed in landfill. Total MSW generated is about 46 TPD Hazardous waste generated by the various industries shall be collected and disposed separately from the municipal waste. Power Supply - For the purpose of the demand estimation, power requirement based on the area of the land proposed under various uses has been considered. A net diversity factor of 0.7 is also considered at the overall site level to achieve a realistic estimate for the power infrastructure. In financial estimates, 220/66/11kV electrical network is considered for receiving and distributing power inside the plot. Key Observations on Proposed Power supply: c. 66kV voltage level mentioned in Pre-feasibility report is obsolete in Greater Noida. Hence alternate voltage level (33kV) will be chosen for power network. Gas - As per the Pre-feasibility report, there is no existing or proposed gas line passing through the site. Hence adequate connection should be allocated so that connection can be drawn from the same line after permission from relevant authorities. In the service corridor/ common infrastructure duct planned along roads, provision for installing the gas pipeline may be considered. ICT - As per the Pre-feasibility report, an allocated telecom network is expected to pass through the site and appropriate connections can be drawn from the same line after permissions from the relevant authorities a. The assumptions for industrial power demand are high whereas assumptions for residential and commercial are within acceptable range. b. No options have been considered for the power distribution in the township. d. The Fire Fighting Water Demand is not included which shall also be worked out. Waste Water and Industrial Waste - As per the Pre-feasibility report, the demand assessment for the waste water generation has been carried out based on the CPHEEO norms for the residential sewer collection and industry practice for the industrial effluent. For estimating the sewage generation, 80 percent of the supplied water to the residential, industrial and other uses is considered as the net waste water. The total quantity of waste water generation is 12.3MLD, which constitutes about 5.8MLD of effluent waste water from proposed industrial areas and remaining as waste water from non industrial uses. Key Observations on Proposed Wastewater Systems: a. Infiltration is not considered in the sewage generation as typically infiltration of about 10% of average sewage generation shall be considered. b. The effluent from industries cannot be disposed into the municipal sewers. However, it shall be treated separately and reused by the industries and optimize the total water demand. Storm Water Drainage - Existing Drainage System Field visits conducted by the Consultants indicated that GNIDA has already constructed the road side drains within the proposed site based on its assessment for the area. A number of recharge pits are also constructed at site. Design plans for the already constructed drains were not available at the time of inception stage Solid Waste Management - As per the Pre-feasibility report, there is no provision suggested for the collection, transportation and treatment of the solid waste generated at the project site. Figure 2-4: Existing Power Supply to Site Source Pre-feasibility Report for IIT 2-3
34 Table 2-4: Summary of Master Planning Components for Concept Master Plan from Pre-feasibility Report Pre-feasibility Report Proposal Land Use Distribution Industries: 50.8% Commercial Mixed Use: 6.3% Residential: 11.1% Utilities: 1.5% Greens & Water bodies: 13.4% Roads:15.6% Existing Structures: 1.3% Observations Landuse Distribution for Roads/ Green/ Utilities of 31.5% is well within the range of international benchmarking/ similar projects. Partial Zoning Compliance with respect to GNIDA Master Plan The Road component having 15% (including BRT) allocation is acceptable and required to serve the Integrated Industrial Township with adequate capacities of Road. Land Use Zoning The northern land parcels are zoned with High-Tech Industries The central land parcels are zoned with R&D Industries The southern land parcels are zoned with Bio-tech and Residential land use zoning FAR Industries: 2.25 Commercial Mixed Use: 4 Residential: 5 Utilities: 0.85 Global FAR: 2 The proposed zoning has a partial compliance with GNIDA Master Plan. All the FAR values including industrial, residential and commercial categories are on the higher side. As a resultant, Global FAR for the proposed development is also reflecting a higher value of 2. Remarks The suggested land use distribution needs is reconfirmed with the client and other Stakeholder. Permissible Industries and usage under the respective GNIDA Master Plan Zoning is verified Road width hierarchy is followed from GNIDA road standards. The permissible usages under respective zoning of GNIDA Master Plan need to be reviewed and study in detail. There is a scope of potential improvements in the suggested land use zoning which is discussed as final in the subsequent chapter. As per the clients requirements and the market objectivity, the respective FAR values need to be reviewed, reworked and reconfirmed with the Client and other stakeholder. Density Gross Density 404 pph Gross Residential Density 111 pph Net Residential Density 200 pph Net Industrial Density 168 pph The figures reflect the high-density nature of the development. As per the clients requirements, provision for EWS housing to be provided. The consultants team preliminary review suggests a possibility of accommodating such housing close to the Residential land use, around existing village settlements. However, this needs to be confirmed with the Client and other stakeholder. EWS Housing No provision for EWS housing has been provided. If the FAR values will be revised, accordingly the arriving density figures will also be changed. 2-4
35 2.2 GNIDA Lease Plan The Revised Lease Plan for Integrated Industrial Township is demarcated for ha, similar to the previous Lease plan area. The site still predominantly comprises of agricultural land with few existing structures scattered all over the site. These structures include kutcha, thatched structures, pucca one block structures-mostly abandoned samadhis (graveyards) and pumping stations Apart from the existing structures already coming within the purview of the old boundary limits the newly added parcel, also comprises of existing structures such as brick houses, mostly as the extension of the abutting settlement Ghodi Bachheda, a 220kv HT line along the eastern edge of the 60m GNIDA road and a natural water body, demarcated as pond. The northern edge of the site abuts a Samshan (crematorium) as well as an 18m wide kutcha road. Similarly the eastern edge of the site runs parallel to the 132 kv HT line, a fraction of which comes inside the project boundary towards the north-eastern corner. The HT Line was previously a part of the project area which currently has been consciously excluded from the site. This has also given the advantage of moving away from the railway track, due to which activities/functions can be planned along the eastern edge without the provision of a green buffer. Apart from the existing structures, Ajayabpur village also falls within the site, and is the largest existing settlement within the site. The village area (11.32 ha) does not constitute to the project area and has been excluded from the project area considering an adequate buffer surrounding the actual Abadi area. Around 1 ha of area is attributed to fall under Samadhi and temples which is again excluded from actual area within the boundary. The Lease Plan shows three GNIDA Master Plan roads within the site area covering ha. The three roads include 80m sector road running east-west towards the north side of the site, 60m sector road running north - south at the western edge of the site and the 60m wide elbow road horizontally dividing the site in two halves. There is also an irrigation canal running through the site and abutting along the southern edge of 80m sector road covering 6 ha of the actual site area. The demarcated pond and the existing structure in the newly added parcel cover 0.72 ha and 0.68 ha respectively of the site area. Altogether after the deductions, that sums upto ha, the available developable area for the project results to Ha. Figure 2-4 GNIDA Lease Plan Source Greater Noida Industrial Development Authority boundary, the GNIDA Master Plan roads, the location, alignment and boundary for the existing structures and the Kot escape representing the irrigation canal have all been given due consideration in the preparation of the proposed Site Layout Plan for IIT. 2.3 Observations on Change in Project Boundary Change in Project Boundary GNIDA Lease Plan and Master Plan from Pre-feasibility Report The team had previously overlaid the GNIDA Lease Plan over the Master Plan from Pre-feasibility report for IIT and had observed significant deviations in terms of boundaries and other aspects. Figure 2-5 shows change in project boundary these observations are listed below: a. Due to the change in the project boundary, the loss of land has been compensated by an additional land parcel (56 acres) incorporated to the north of the 80m wide sectoral road. The overall project site area remains unchanged (747.5 acres). b. The proposed internal road network in Halcrow Master Plan does not align with the road network in GNIDA lease plan. c. The road widths of the GNIDA Lease Plan as constructed on ground do not match the road widths proposed in Prefeasibility report for IIT. d. The area of the existing Ajayabpur village settlement boundary varies in the GNIDA Lease Plan and the Proposed Master Plan as per Prefeasibility report for IIT. The alignment of other built roads with the site and their proposed width as well the HT Lines is also mapped within the Lease Plan. The map is considered as the base for the revised proposal for the Final Site Layout Site Plan for IIT. The project site 2-5


36 Change in Project Boundary Previous Lease Plan and Revised Lease Plan Figure 2-6: Change in Project Boundary - Previous Lease Plan and Revised Lease Plan Source GNIDA There are significant changes from the previous Lease Plan to the Revised Lease Plan. The revised lease Plan consciously avoids the 132kv HT line previously along the eastern edge of the old project boundary. As a result, the site is reduced in width and has become more linear in shape. Figure 2-5 Deviations in Project Boundary Pre-feasibility Master Plan and GNIDA Lease Plan Source Analysis by consultant The major implications of these changes were: a. As per Prefeasibility report for IIT the existing settlement falling in the project boundary was of a smaller area. However as per GNIDA Plan it is significant in size. Although this area has been excluded from the total area, it is physically linked with the site and affects majorly in the planning exercise. b. The addition of some land parcels on the northern periphery of the site became a challenge to ensure physical connectivity and bringing in cohesiveness to entire development given that 80m road will have significant traffic movements once the project is fully marked. The other significant change is the addition of land parcels to the northern side of 80m proposed GNIDA road. Initially the 22 ha of land parcel has been added further to increase area to ha. The land parcel to the north is observed to be away from the Delhi-Howrah railway track. As a result, the requirement of a green buffer adjoining the railway track is neutralized. The site extends in north till the 18m existing kutcha road running east-west. The project boundary abuts an existing Samshan to the north due to which a niche is formed at the north end. It is also observed that the new land parcel includes existing structures as well as a 220 kv HT line towards the western edge of the site as shown in the figure above. The 60m wide GNIDA road running north-south forms the western edge of the site all along other than the newly added land parcel where a thin strip of land(varying in width from 35m -45m) abuts the western edge of the 60m road and is a part of the project area. However this strip of land cannot be put under direct and active use for the township. 2.4 Final GNIDA Master Plan GNIDA Master Plan 2021 Integrated Industrial Township, being an initiative of DMIC to drive manufacturing activity in the GNIDA region will subsequently lead to development and growth of the region. The township is aimed to promote advanced industrial development. GNIDA being one of the stakeholders in developing IIT, it integrates the initiative of DMIC and has introduced special provision for Integrated Industrial Township in the GNIDA Master Plan Even though the selected site was previously zoned under SEZ eco-tech and tech zone, it has now been exclusively designated as integrated industrial township zone. 2-6

37 Table 2-5: Recommended Land use distribution within IIT as per GNIDA Master Plan 2021 Landuse Distribution of mixed land use ground coverage and F.A R shall be determined on the basis of prime use/ activity as decided in the scheme. The following tables show the FAR and ground coverage permitted by GNIDA for various use of buildings:group Housing (Flatted and Cluster type) Sl. No. Land use Category Percentage 1. Industries 50.8% 2. Commercial/mixed use 6.3% 3. Residential (includes EWS) 11.1% 4. Utilities 1.5% 5. Greens & Water bodies 13.4% 6. Roads 15.6% 7. Existing Structures 1.3% The site is currently connected by 80m and 60m sector GNIDA roads to other collector roads till Pari Chowk where metro rail connectivity is proposed. A feeder connector towards the IIT site from the metro rail at Pari Chowk has also been proposed Easter Peripheral expressway abuts the southern edge abutting of the site which connects it to proposed Ganga Expressway around 1 km away from the southernmost part of the site. Source: GNIDA Master Plan 2021 The extracts of GNIDA Master Plan 2021, section indicate that the IIT is to be proposed with Hi-tech, Bio-tech, R&D and IT types of industries on an earmarked site for the IIT. The recommended Landuse distribution is illustrated in Table 2-5. However it is appended with the note that the suggested landuse could be varied by %. Industrial buildings Table 2-6: Permissible Ground Coverage, FAR and Height for Industrial Buildings in GNIDA bye-laws Roads/Linkages The regional level linkages are vital for development of the township. The linkages would provide uninterrupted access to the site. Figure 2-7: Location of IIT in GNIDA a. Minimum plot area 2000 sqm b. Maximum permissible:c. Ground coverage 35% upto sqm and 40% for above d. Floor area ratio 3.5 The Master Plan roads cutting across the proposed site for IIT connects it to the Grand Trunk Road (NH 91) in the east. The site is also well connected via rail as Delhi-Aligarh railway abuts all through the eastern edge of the site. Ajayabpur Railway station is one stop at the eastern edge of the site. Plot area Sl. No. (sq m) Max. Ground coverage (%) Max. Floor Area Ratio Maximum height in meters 1 Upto Above 1000 but not exceeding Above No limit 4 Flatted Factories Source Building Regulations for Greater Noida Industrial Development Authority, pg 36, section 24.3 Industrial buildings 2.5 GNIDA Building Bye-Laws Building regulations for Greater Noida Industrial Development Authority specify the ground coverage, FAR, density and height etc for the range of plot area for different land uses such as group housing, industrial buildings, commercial buildings and institutional buildings. Initially, after the market study by previous consultant, the FAR and ground coverage proposed for the flagship project was much higher than the provisions in GNIDA bye-laws. For instance the FAR for industries is proposed to be 2.25 where as in the building bye-laws the FAR is provisioned till 1.5. In case 2-7
38 Commercial Buildings Table 2-7: Permissible Ground Coverage, FAR and height for Commercial Buildings in GNIDA bye-laws Maximum Ground Coverage Maximum FAR Maximum height in meters Convenient shopping centre 40% Sector Shopping 40% SN Building Use Sub District centre, Shopping/commercial uses along MP roads and other master plan roads 40% 4.00 No limit Upto 60mtrs wide road The proposed Integrated Industrial Township is approximately 35km from Noida City which is one of the significant industrial cities of the region and a major catchment for skilled human resources beneficial for this upcoming development. The site is also in proximity to other major proposed landmark developments of the region such as the integrated transit facility at Boraki (approx. 4km) and the multi-modal logistics hub near Dadri (approx. 6km) that is likely to improve both the passenger and logistics connectivity/movement to this industrial township The township aims to promote R&D activities to give a boost to the manufacturing activities in the state. The Integrated Industrial Township is proposed with new age industry sectors such as Bio-technology, Hi-tech electronics industry, and Research and Development (R&D) Topography 4. Hotel 40% 3.00 No limit 5. Banks 40% 2.00 No limit 6. Cinema/Multiplex/Cineplex 40% 2.00 No limit 60% 2.0 No limit Warehouse/ 7. also located approx. 9.5Km from the project site. As per the Greater Noida master plan, Sector Road of 80 m width on North and 60m wide Sector Road on the West side are proposed. Project area is geographically located between & 2828 N latitudes and between & E longitudes. Spread over an area of Ha, the project area has an average elevation of 205m. Ground levels vary from 202m to 207m. The topographical survey map and the Digital Elevation Model (DEM) of project area are shown in following fig. Go-downs Source - Building Regulations for Greater Noida Industrial Development Authority, pg 36, section 24.4 Commercial buildings These norms are adopted and applied whilst formulating the land use plan, detailed layout plan and designing other aspects of the IIT 2.6 Topography Survey The site of the Integrated Industrial Township has total area of Hectares (747.5 acres). The terrain of the area is plain in general Location & Significance The site is located at a road distance of 11 km from Pari Chowk, Greater Noida. The site abuts the Delhi-Howrah Railway line and Ajayabpur Railway station is situated near the eastern periphery of the site and proposed Eastern Peripheral Expressway is abutting southern boundary of the project site. The aerial distance of the Sikanderpur (South east) town and NH91 (North East) are approximately 10km and 6km respectively. The Dadri railway junction is 2-8
 of")

39 Figure 2-6: Digital Elevation Model (DEM) of Site Figure 2-5: Topographical Survey Map of Site 2-9
40 2.6.3 Site Features Structures & Trees Many structures exist inside the project area. The two villages Ajayabpur and Rithori lie adjacent to project area. Ajayabpur village is bound within the site, while Rithori lies on the East boundary. The close proximity of these settlements with the proposed township is apparent. The existing buildings in the settlements are predominantly residential in nature. The other structures falling within the site are also residential, with some exceptions of religious buildings like Samadhi and temples. The existing trees on site are mainly deciduous in typology from medium to large in size. The concentration of trees is relatively more on the South-eastern portion of the site, and also surrounding the settlements. Please refer to Fig. 5 for the distribution of the trees Roads Before the proposal of Integrated Industrial Township, the GNIDA authorities started developing the area as per the proposed master plan. New roads were either fully constructed or partially constructed. The length of the existing roads is approx 18 km which are mainly BT Road (asphalt) and some are mud roads Drains, Canal & Pond GNIDA has constructed peripheral drains inside IIT Greater Noida. These drains have the outfall location at the Kot escape canal. The drains are of rectangular RCC sections. The width varies from 1.2 m to 3 m, and has a depth of approx. 1.5m. The total length of the drains is approx. 16 km. 2.7 Summary The above data and inputs are analyzed to understand the project context, client s vision, concerned authority and byelaws prevailing for the site and previous studies carried out for the project. All these together provide a comprehensive base for conceptualizing the layout plan for the Integrated Industrial Township. A summary of these input features are exhibited following which has formed the design basis for the development of IIT. a. Prefeasibility report - the industrial profile mix, the unique concept proposed for the industries and land use budget are taken into consideration. b. The Revised GNIDA Lease Plan acts as a base for preparation of the layout plan for the township. c. Principles and approaches adopted from Draft GNIDA Master Plan 2021 applicable for the site are considered while preparing the master plan. d. Observation from topography survey, i.e. site features, site topography, existing infrastructure and existing structures etc. also gave a clear understanding of the existing situation of the site. The Kot escape canal which passes through the project boundary is unlined canal. The top width of the canal varies from 17 m to 25m. The average depth of the canal is approx 2.5 m. Kot escape canal starts from Upper Ganga Canal running through the project boundary, parallel to the North Western face, meeting the Hindon River which in turn merges with the Yamuna River. The Kalda distributary canal runs parallel to the south west boundary of site. The width of the canal varies from 7 m to 12 m. This canal is used for irrigation purpose only and is regulated and managed by Uttar Pradesh Irrigation Department. Besides above, with change in project boundary there is deduction of some land on eastern part and the same has been compensated on the northern site. The new land parcel also contains one existing pond in the North West corner of the project site. The area of pond is approximately 0.72 Ha. 2-10


41 3. Project Site Appreciation This chapter highlights the site appreciation with respect to regional context, linkages & connectivity, existing features, zoning analysis, opportunities and challenges etc in an elaborated manner. 3.1 Regional Context Figure 3-2: Project Site and Proposed Surrounding land uses in Draft GNIDA Master Plan 2021 Source GNIDA Master Plan 2021 The project site is surrounded by various land uses when analyzed with respect to Draft GNIDA Master Plan The, eastern part abuts the proposed investment region by DMIC - DadriNoida-Ghaziabad Investment Region. The south western and the southern part abuts the tech zone and eco-tech zone. The southern and eastern part of the site are surrounded by investment and intense activity oriented zones related to industries and commercial activities and the eastern part adjoins the residential use. However, with the revised site boundary, it is observed from the Khasra map (for the project area) that the north-western side of the project area adjoins an existing settlement Ghodi Bachheda residential use. The newly added land parcel to the north includes the recreational use and adjoins residential use. When analyzed on satellite image (source: Google earth), it is observed that the adjoining residential sectors have been built and developed. However, the envisaged industrial development is yet to be implemented and commissioned on the demarcated zone. Figure 3-1: Zoning Analysis Site Surroundings The delineated site is also approximately 5km from the prime Consultant s modification based on prefeasibility report commercial centre/central business district and Knowledge Parks proposed within Greater Noida Master Plan. Other major land uses adjoining the Integrated Industrial Township include a large residential zone towards the north-west, and industrial and institutional uses on the south-eastern side (Figure 3-1). These existing and proposed neighbouring residential/industrial catchment areas are highly compatible land uses surrounding the proposed Integrated Industrial Township. There are key regional level connectivity proposals that are planned in and around the project site. As shown in Figure 3-3 the proposed IIT is connected to Greater NOIDA, NOIDA and Delhi through the Yamuna Expressway via three existing 60m sector roads. Two of these sector roads will 3-1 cross the proposed IIT to connect Greater NOIDA with the proposed DNGIR, NH 91/GT Road and the proposed Eastern Peripheral Expressway (as proposed in draft NCR Regional Plan 2021, currently under implementation). The nearest access points to the Yamuna Expressway and NH 91/GT Road from the site are located at a distance of approximately 11km and 6km, respectively. Based on field visits and surveys, a 60m NorthSouth road is being constructed along the western boundary of the site. Once built, this road will connect the proposed IIT to the proposed Eastern Peripheral Expressway s service roads, and the proposed Metro Station at Boraki. A major logistic hub/icd is also proposed to be developed as per draft NCR Regional Plan, in the region which will give boost to the subject project site.

42 Figure 3-3: Regional Context of the Site 3-2

43 3.2 Site Appraisal sector road in the west. It is also abutting the proposed 400 meter wide ROW Eastern Peripheral Expressway in the south and is bound by Delhi Howrah railway line on the east. This links the site to major transport corridors which provide excellent regional connectivity to the major economic centres in the surrounding areas. The proposed Integrated Industrial Township is approximately 35km from Noida City which is one of the significant industrial cities of the region and a major catchment for skilled human resources beneficial for this upcoming development. The site is also in proximity to other major proposed landmark developments of the region such as the proposed integrated transit facility at Boraki (approx. 4km) and the multi-modal logistics hub near Dadri (approx. 6km) that is likely to improve both the passenger and logistics connectivity/movement to this industrial township. 3.3 Site Description The site was revisited, after the project boundary was revised. During site visit, many significant physical attributes of the site were captured other than the ones that were previously observed. Most importantly the new land parcel of the project site includes a group of existing structures towards the western side of the site. These existing structures appear to be extension of the abutting settlement Ghodi Bachheda at the north western corner of the site. A kutcha road connects the settlement to Ajaibpur Railway station and diagonally crosses the site. The settlement in the current scenario appears to have expanded along the kutcha road. The 60m GNIDA road continues to run all along the western edge of the site. The revised land parcels of project area has a thin strip of land at the western edge of the 60m GNIDA road, the width of which varies from 35m to 45m. The subject lands are currently under agricultural use. Figure 3-4: IIT Site Location, in Gautam Buddha Nagar Source Maps of India website District Map of Gautam Buddha Nagar, UP The site is located at a road distance of 11 km from Pari Chowk, Greater Noida. The site abuts the Delhi-Howrah Railway line and Ajayabpur Railway station is situated near the north-eastern periphery of the site. The aerial distance of the Sikanderpur (South east) town and NH-91 (North East) are approximately 10 and 6 km respectively. The Dadri railway junction is also located close to the site. It is situated approximately 9.5 km from the site. In terms of administrative boundaries, the proposed site falls under Gautam Buddha Nagar district. The site is strategically located in a wide network of existing and proposed roads including National Highway 91, Eastern Peripheral Expressway and other Greater NOIDA Master Plan roads. The site includes 80 meter wide sector road in the North and 60 meter wide The 220kv high tension line are situated at the north-western corner of the site and runs parallel along the north-western periphery of the site. Apart from these, a pond is located at the north-western corner of the site, which is currently dried up and appear to be much smaller when observed on satellite image (google earth). The site is earmarked for the proposed GNIDA Master Plan roads at specific stretches and is also featured with existing built roads. These roads are in different stages of construction. For, instance Figure 3-10 shows the road south of Kot escape. It is a 45m wide fully constructed road with a median. There is also an overhead electric cable line running along the north edge of the road. 3-3 Towards the southern half of the site, partially built roads have been noted (Refer Figure 3-17). Though these roads are not represented in the GNIDA Master plan, they were built as 45m wide roads. These roads are currently built as 24m wide road. Apart from these, there are other kutcha roads (5m wide), built between the agricultural plots and the hedges. These are mainly used by the nearby residents for daily commuting purpose. The partially built 45m road running north-south towards the eastern side of the site is the edge of the project site as per the revised Lease Plan. The road connects to the 45m road running along the south of Kot-Escape. The drainage of the site is also partially laid along either side of the already built roads (Refer Figure 3-13). These roads although built on a grid pattern and are at right angle to each other, do not align to the project site boundary; thus forming odd land parcels at the edges of the site. The GNIDA Master Plan roads that fall within the project site are in different stages of implementation. The North-South 60m ROW road that borders the western edge of the site( Figure 3-11) is fully constructed till the Kot escape junction from the north end and is already in use. Beyond the Kot escape junction till the south end it is partially built, i.e. the surfacing of the road is yet to construct. The 80m ROW road proposed along the north side of the Kot escape is not yet constructed. The 60m elbow road, which cuts the site in almost two halves, is partially built. The site is also currently manifested with numerous mature trees spread across the site. Dense tree plantation is observed particularly in some areas near the 60m elbow road and towards the southern part of the site, near the existing settlement and structures. (Figure 3-12) Existing structures such as Samadhi, temples etc are present on the site, which are also marked in the Lease Plan provided by GNIDA. Such structures are typically located with dense tree plantation around. Figure 3-16 shows Ajayabpur settlement within the site boundary, as marked in GNIDA Lease Plan. The settlement comprises of concrete structures and mostly residential. A group of residential structures is also observed at the southern end of the site, much smaller than Ajayabpur, and not a settlement in itself. Rithori is another major settlement that previously was adjoining the site area at the south-eastern part of the site. The revised Lease Plan shows the settlement to be approximately 500m away from the site. The settlement continues to be primarily accessed through the site on its western periphery as it is bordered by the existing railway line on its eastern edge. The 132 kv High tension Lines that were previous running the all along the length of the site at the eastern end, have now been

44 consciously excluded from the project site area as per the revised Lease Plan. Although a smaller stretch of 132 Kv HT lines are still a part of the project area on the north-eastern parcels running along the railway line. The Delhi-Aligarh railway line running parallel to the eastern edge of the site has two crossings across it along the eastern boundary of the site. One to the north of Ajayabpur railway station and another towards the south-eastern tip of the site. The site is currently partly under agriculture use. Even sized agriculture plots mainly wheat and mustard fields are observed all through the site. The site is primarily flat in nature with a gentle slope towards Yamuna river side. However minor saucer depressions are sighted towards the southern end of the site. Electric cables and transformers are present on the site mostly along the built roads and running towards the abutting Rithori settlement. Figure 3-5 provides the references for site images which are enclosed subsequently. These site photographs provide a comprehensive visual tour of the project area and its features. Figure 3-5: Site Map Showing References for Site Images 3-4


45 Figure 3-8: Existing pond within the Revised Project boundary Figure 3-11: Junction at the West Edge of the Kot Escape Source Site Tour by the Consultant Figure 3-6: Existing Structures within the revised Project Boundary Source Site Tour by the Consultant Figure 3-9: Samshan abutting the north end of the site Source Site Tour by the Consultant Figure 3-12:Dense Tree Plantation in Site Source Site Tour by the Consultant Figure 3-7: 220 kv HTL along eastern edge of 60m N-S sector road Source - Source Site Tour by the Consultant Figure 3-10: 45m ROW Road along the South of Kot Escape Figure 3-13: Built Drainage along the Edge of 45m Elbow Road Source Site Tour by the Consultant Source Site Tour by the Consultant 3-5


46 Figure 3-16:Ajayabpur Settlement Figure 3-19: Ajayabpur Railway Station Source Site Tour by the Consultant Source Site Tour by the Consultant Figure 3-14: Existing Structures within the Site Source Site Tour by the Consultant Figure 3-20: Kot Escape during Monsoon Figure 3-17: Partially Built Roads within the Site Source Site Tour by the Consultant Source Site tour by Consultant Figure 3-15: Railway Crossing Figure 3-18: Existing Structures within the site Figure 3-21: Electric Poles within the Site Source Site Tour by the Consultant Source Site Tour by the Consultant Source Site tour by Consultant 3-6
47 this road is proposed to be extended across the railway line to provide direct connections to DNGIR, proposed GT Road, and proposed Eastern Peripheral Expressway Existing Infrastructure Water The infrastructure related to water supply includes the following activities: a. Water source location and capacity identification - As per Pre-feasibility report for IIT, it has been noted that there are alternative water source available for meeting the water demand of the Integrated Industrial Township. Primary source of water for Greater Noida is ground water which is present in the overall project region. Greater Noida has also been allocated share of the Upper Ganga Canal (about 85 cusec) and in near future water from this source may also be used for the IIT. Another potential source of water is the recycled water from an STP of 137MLD, currently under construction in Greater Noida. WTP has not been considered as it is assumed that treated water will be supplied to the Industrial Township from relevant sources. No source study and survey work for location and capacity is envisaged in order to identify water sources and thus has been excluded from the scope of work under current assignment. b. Design of required intake works, raw water sump and pumping station - As per DMICDC s requirements, intake works including raw water sump and pumping station are not considered as part of the planning and design under current scope of assignment Power d. 45m ROW Canal Road The proposed IIT site consists of a 45m ROW road immediately south of the canal and extends between the proposed North-South 60m ROW road and a 45m ROW North-South road. The road is located in close proximity to the proposed 80m ROW road. As a result, the junctions along this road will be located at a distance of approximately 100m from the proposed 80m ROW road and hence will not comply with the conditions specified in IRC In addition, the road does not enhance connectivity within the site. Therefore, it is recommended that this road should be demolished. e. 45m ROW Roads The proposed IIT consists of numerous 45m ROW roads. These roads have been constructed as four-lane divided sections and will serve as secondary collectors providing direct connections to various sectors within the proposed IIT. f. Existing Public Transport - Currently, the site is not served by any public transport systems. However, numerous 8-seater shared auto-rickshaws ply on existing roads providing connectivity between the villages in and around the proposed development, and larger urban destinations such as Greater NOIDA. Greater NOIDA is connected to rest of the NCR and surrounding towns/villages by UPSRTC and DTC buses. The following public transports systems have been recommended in the GNIDA Master Plan: The proposed township is planned adjacent to the already developed sectors of Greater Noida. As per UPPCL and UPERC norms, the total power requirement of the Integrated Industrial Township is around 160MW for total floor area of 5.9million sqm proposed for development as per pre-feasibility report. As per the same report a 220 kv substation is located at a distance of approximately 1 km from the site boundary in north. A 220kV line passes along the northern edge of the site and a 400 kv D/C line to 400 kv Palli sub-station also traverses along the eastern edge of the site as depicted in previous chapter Figure 3-22: Proposed GNIDA Master Plan Road Source: GNIDA 2021 Master Plan Existing Road and Committed Transport Network Figure 3-22 and Figure 3-23 show the 2021 GNIDA Master Plan roads and existing road network built on the site, respectively. Brief description of the transport network follows: a. Existing East-West 60m ROW Road The existing 60m ROW road is a four-lane divided roadway and currently provides the only connection between Greater Noida and the proposed site. According to the 2021 GNIDA Master Plan, this road is proposed to be extended east of its current terminus as an 80m ROW road with a grade-separated rail crossing. Post construction, this road will function as a vital regional corridor connecting Greater NOIDA, the proposed IIT and the proposed DNGIR. The road will also provide connections to the proposed GT Road and the Eastern Peripheral Expressway. b. Proposed North-South 60m ROW Road - The proposed North-South 60m ROW Road is currently being constructed as a four-lane divided roadway. According to the 2021 GNIDA Master Plan, this road is proposed to be extended to Boraki. It should be noted that an Integrated Transport Hub is being proposed at Boraki which will also include a Metro station connecting the region to Delhi. c. Multi-modal hub at Boraki, approximately 8 km north of the proposed IIT. The GNIDA Master Plan also recommends a new inter-city railway line from Dadri to Tuglakhabad. Once built, this rail line and the multimodal hub can provide rail and freight connectivity between the proposed Dadri IIT and rest of the country. Proposed East-West 60m ROW Road - The East-West 60m ROW Road has been constructed as a four-lane divided roadway. According to the 2021 GNIDA Master Plan, i. Light Rail Transit: A 28 km Light Rail Transit System on an elevated corridor with 18 stations between Boraki (GNIDA) and NOIDA City Center (NOIDA) has been planned in the GNIDA Comprehensive Transport Master Plan. All stations are proposed to have dedicated approach roads, pedestrian sidewalks and parking areas for feeder/minibuses. However, no stations have been proposed in the vicinity of the proposed IIT. ii. Bus Network: Sixteen bus lines have been proposed to provide connectivity within and beyond GNIDA boundaries. This scheme includes four bus terminals including one located at Kasna, approximately 6 KM from the proposed IIT site. The Plan also proposes Bus Priority Schemes such as providing exclusive lanes for buses. g. Inter-City and Freight Railway: The GNIDA Master Plan recommends development of a new railway station and a 3-7

48 will be accommodated within the Site, ensuring strategic connectivity for the prospective employee/ users of the township. 3.4 Site Opportunities and Challenges Site Opportunities The opportunities present in and around the site have been considered. Figure 3-24 showcases the site opportunities. They are as follows; a. High speed transportation connectivity is proposed in the vicinity of the site which connects the area to important nodes such as Boraki and Dadri. Presence of multiple modes of public transportation would encourage the commuters to the site to take public transportation which would in turn reduce the traffic flow into the site. a. Presence of 22kv HT line along the north-western edge of the site. A 35 m green buffer is required for the High tension line covering around 5 ha of land, thus making it unavailable for landuse planning b. The newly added parcel in the project area extends beyond the western edge of the 60m GNIDA road. A thin strip of land is included within the project boundary in the north-western side of the site. The width of the stripped land being mere 18.5 m to 3.5m only makes it difficult to do effective landuse planning. c. c. The proposed ROB along 80m sector road and 60m elbow road will strengthen the linkages of Greater Noida area and the upcoming investment region on the eastern side of the railway line. As these ROB would be an integral part of the project site, they increase the connectivity and subsequently enhance networking of industrial activities. e. Presence of multiple entry opportunities into the site ensures division of traffic inflow into the township. Scope for main entry to the township is present from the 80m wide road and also from the 60m wide north-south road at the west edge. f. Source Prepared by the Consultant The constraints present in and around the modified site area have been considered for preparation of the Site Layout plan options. Figure 3-25 exhibits site challenges. They are as follows; b. Proposed Eastern Peripheral Expressway connects major nodes/cities including DNGIR, which traverses on the southern edge of the site. This expressway also accommodates for a proposed Metro Corridor. The presence of expressway further ensures excellent connectivity of the site in the near future. d. Ajayabpur Railway Station to the east is in close proximity of the site. The railway station provides long distance connectivity to the site. Thus presence of a railway station increases the catchment area for the site in terms of skilled workers. Figure 3-23: Existing Road in Integrated Industrial Township Site Challenges Irrigation Canal offering pleasant visual sights for proposed land uses along the Site. The canal marked as Kot escape gives scope to develop the main entrance to township with proper landscaped green spaces integrated with the water body. The presence of a cremation ground (Samshan), abutting the north end of the site, makes the adjoining areas within the site inappropriate for residential or high-end commercial use. d. Increased vehicular traffic through the site to access the manned railway crossing. The manned railway crossing to the north of Ajayabpur site is currently accessed by a kutcha road coming from the north side of the site, bringing in large number of commuters into the site area. e. Increased noise level in the periphery of the Site. The site being surrounded by well-connected existing and proposed major roads in the GNIDA Master Plan level, it is expected to cater to a large number of vehicular traffic, thus increasing the noise level around the site. Towards the eastern side due to the presence of railway line, the noise will be higher at the eastern end too. f. Existing developments and their additional boundary within the site challenge overall zoning of the Site Layout Plan. The existing Ajayabpur settlement although outside the project scope area curtails the zoning flexibility around it. Other than Ajayabpur, Rithori settlement although outside the project area has all its access through the site. Thus the access for the settlement needs to be accommodated. g. Potential high real estate value owing to visibility and connectivity of the Site. The site being well connected locally as well as in the regional context has great opportunity to show case the site h. MRTS Feeder Connection to the site is being proposed along the north-western periphery. One of the stoppages 3-8


49 Figure 3-25: Site Challenges Figure 3-24: Site Opportunities Source Analysis by the consultant Source Analysis by the consultant 3-9
50 3.5 Summary The regional context, reconnaissance of existing infrastructure and the site visits have altogether contributed in framing the site appraisal. The Consultant s have put forward the site challenges and opportunities based on the primary and secondary data review. The entire exercise has aided in the formulation of Final Site Layout Plan options for the proposed IIT. The team has endeavoured in addressing the challenges and other aspects complied with site potential to arrive at the best possible options for the project which are elaborated in the forthcoming chapter. 3-10

51 4. National International Best Practices This chapter highlights the literature study undertaken with intent to grasp the extracts from the projects of similar nature that are implemented in India and other parts of the globe. This exercise has further enhanced the consultant s views on various other aspects such as industrial mix, land use distribution, FAR, latest sustainable planning practices, sustainable transport solutions, utility planning etc. which are narrated here under. The primary objective of the exercise is to study, analyse and suggest best solutions, concepts and strategies for the envisioned flagship project for the IIT. 4.1 Rationale for bench-marking As suggested in the Pre-feasibility Report, the basic parameters for the township are carried forward in preparation of the Site Layout Plan. These parameters include FAR, land use distribution and recommended industrial profile mix. At project initiation stage, the client consulted the project team to ascertain select aspects for the proposed development which emerged out of the Pre-Feasibility report. Therefore in order to respond to the initial queries related to proposed land use distribution and FAR, the consultants have structured the respective bench-marking exercise Bench-marking for Land Use Distribution for Select Projects Table 4-1: Landuse Distribution (in %) of Select Projects DMIC s first concern was regarding maximizing the land for sell, to which they had raised the query IS LANDUSE OPTIMAL 30.5% FOR GREEN AND OTHER UTILITIES INCLUDING ROADS? While bench marking for land use distribution aspects, both national and international projects were taken into account particularly, the successful/known industrial townships and their land use distribution are reviewed in depth. The key projects are analysed and the details are tabulated in the following Table 4-1 The quick review of the select projects indicate that majority of them have assigned significant percentage of landuse under Industrial category as they were planned for the envisaged development. Although the percentage distribution for commercial/institutional and residential categories is varying (due to respective requirements), the area under green spaces is within the range of 14 to 25%. Similarly, for roads, the variation is between 10-16%. If these figures are compared to that recommended for the proposed IIT (Pre-feasibility Report), they are found to be well within the desirable range and as per the specified guidelines (UDPFI). Landuse Category IIT (Prefeasibility report) Dholera SIR GIFT City Kulim Hi-Tech Park, Malaysia Du Biotech Park, Dubai Vikramaditya Udyogpuri, Ujjain Total Area (Ha) Industry (%) The table also shows that residential percentage across various projects varies from 40% to 20% depending upon the development objective. Similarly, for roads, the variation is between 10-16%. Industries vary from18%-20%. These figures are found to be comparable to landuse distribution suggested for IIT Dadri in GNIDA Sec except Industries which is 50.8%. Since the proposed township is envisages as a global destination Industrial township, half of the share is dedicated for industries. Commercial (%) The following inferences are drawn from the above table:- Residential (%) Public- Semi Public/ Institutional (%) Green (%) 13.4 Utilities (%) 1.5 Roads (%) (Excluding TP Roads) c. Road width needs to comply with Industrial Freight Movements. Aforementioned inferences had satisfied the clients query pertaining to the Land use distribution. The aspects of land use distribution are further studied and analysed through understanding of Master Plan and land use zoning. Dholera SIR and GIFT City in Gujarat and Vikramaditya, Udyogpuri, Ujjain in MP are few of the most talked about and forefront Industrial townships within India, GIFT being the flagship project for the state of Gujarat. The key features and details of the select projects are entailed as mentioned below Dholera SIR DMIC today is considered to be the most important economic resurgence of the country. It has identified 24 important nodes to be developed as industrial hubs across the six states that it passes through. Out of the 24 nodes, 6 fall within the state of Gujarat, of which Dholera SIR is the most important node for the state. The project will be the first designated investment region under DMIC. The township predominantly being an investment region has minimal land parcel devoted to land uses other that industries. Almost half the site is kept demarcated for global investors. The percentage of open space accounts for one-fourth of the site. The considerable proportion of open space is due to the fact that Dholera envisioned to become a major investment region will attract many heavy manufacturing industries for which adequate green spaces and buffer had to be provided. In addition to this the eastern periphery of Dholera is surrounded by coastal zone which further mandates for open spaces. The master plan is carved along grid-iron pattern road network with a central expressway. This acts as a high-speed corridor, with the adjoining land use designated for industrial and commercial uses. The residential areas form the outer periphery around the central industrial core. (Source: Final Development Plan (DSIRDA), 2010). a. Landuse Distribution for Roads/ Green/ Utilities of 30.5% is well within the range of international benchmarking/ similar projects. b. The Road component having 15% (including BRT) allocation is acceptable and required to serve the Integrated Industrial Township with adequate capacities of Road Figure 4-1: Master Plan Dholera SIR Source: Final Development Plan (DSIRDA),

 GIFT is planned as a financial Central Business District (CBD) between Ahmedabad and Gandhinagar as a Greenfield development.")


52 (Source Pre-feasibility Study, IIT, Dadri).The Dubai Biotechnology & Research Park is the major Life Sciences cluster in the Middle East. It is a Free Zone that provides the ultimate platform for Life Sciences companies to set up their operations and access the fast growing, emerging markets of the region. The Bio-tech Park, similar to Kulim tech Park provides R&D and training activities as one of the main elements of township. GIFT City, Gujarat (Source - GIFT is planned as a financial Central Business District (CBD) between Ahmedabad and Gandhinagar as a Greenfield development. It is designed as a hub for the global financial services sector with state-of-the-art connectivity, infrastructure and transportation access being integrated into the design of the city. The objective of the township predominantly being the development of a CBD, commercial and residential are two of the major land uses covering around 50 percent of the township. The green spaces here are given special consideration since they alone cover 15% of the proposed land use. Moreover the area of the township is Ha which is comparable to the proposed IIT at Greater Noida. Thus proposed land use distribution for industrial use is about one-third of the township. a. Site Area : 300 ha The specific features of the project are:a. Supply of Natural Gas to the entire development via pipes cost efficient and safer design b. Centralized AC system, called District cooling as cost effective and energy efficient Solution c. Figure 4-3: Green Space allocated in GIFT city Source Du Bio-tech Park, Dubai Unique Waste Management through underground suction pipes at high speed of 90 km/hr and treated through Plasma technology. Using walk-to-work concept as part of urban planning with a modal split of 10:90 between private and public transport. f. Use of electric personal rapid transit systems within the City. c. Envisioned Built Up Area : Over 3,000,000Sqm; Global FAR: 1 d. Master Planning Features: Land Use Clusters Planned along circular road network e. Manufacturing Units at peripheral locations; R&D and Commercial forming the central core d. The Master plan proposes a multimodal mix of Transport systems (MRTS/LRTS/BRTS, etc.) for both inter region and intra-city. e. b. Current Planned Built Up area : 278,709 Sq m The specific features of the project are:a. A DNA motif is woven throughout the park, where a meandering curvilinear form celebrates life within the desert. b. Building groupings tied to the headquarters, connected by a series of walkways, roads & underground parking facilities Figure 4-4: Du-Bio-tech Park, Dubai Master Plan : Source c. Sustainable Features include Day lighting & Views, Energy Efficiency, LEED Silver, Occupant Lighting Control, Occupant Thermal Control, Water Efficient Landscaping, Water Use Reduction Figure 4-5: Analysis on Zoning of Du-Biotech Park Layout Plan Figure 4-2: GIFT city Master Plan Source Source Prefeasibility report on Integrated Industrial Township, Halcrow Figure 4-6: Aerial view for Du-Biotech Park Source Prefeasibility report on Integrated Industrial Township, Halcrow 4-2
 is the first Hi-Tech Park in Malaysia.")


53 b. Land zoning of various functionally diverse building types in an integrated fashion reflecting the overall concept Kulim Hi-Tech Park, Malaysia (Source Pre-feasibility Study, IIT, Dadri).The Kulim Hi-Tech Park (KHTP) is the first Hi-Tech Park in Malaysia. The KHTP situated in the district of Kulim, in the state of Kedah, in the north-west of Peninsular Malaysia, covers an area of approximately 1,700 hectares. The township being planned for a hi-tech park with new ideas on industrial sector had R&D and training added to the industrial land use. Thus around one-third of the township is proposed to be industrial land use c. Irregular shaped Clusters woven in a DNA Module (Helical Shaped) a. Site Area : 1450 Ha b. Planned Built Up area : 58,692 sq m c. Sectors involved: d. High technology industry i. R&D/training ii. Housing iii. Enterprise house iv. Retail and Entertainment The specific features of the project are:a. The Master plan incorporates - Residential Clusters spread over the site and carefully integrated with Industries. Amenity zone intricately designed to serve industries as well as residential areas b. Total attracted investment to the park has exceeded US$3.2 billion from the First Phase of development. Figure 4-8: Analysis on Zoning of Kulim Tech Park Layout Plan Source Prefeasibility report on Integrated Industrial Township, Halcrow Figure 4-9: One-north Master Plan, Singapore Source north master plan One North Master Plan, Singapore (Source: a. Area: 200 Ha b. Estimated Population: 138,000 c. Built up Area: 5,000,000 sqm; Global FAR: 2.5 d. Sectors involved i. Biomedical Sciences ii. Information Communication Technology iii. Media iv. Physical Sciences & Engineering v. Housing vi. Retail and Entertainment Figure 4-10: Networking of Green spaces in the Master Plan The specific features of the project are:figure 4-7: Kulim Hi-tech Park, Layout Plan a. Designed for work-live-play-learn environment Source 4-3


54 Bench-marking for FAR of Select Projects Dholera SIR DMIC s next concern was regarding maximizing the land for sell, to which they had raised the query DENSITY IN COMMERCIAL/ RESIDENTIAL/ INDUSTRIAL LAND USE TO MAXIMISE FAR In order to respond to the second query, the consultants had done benchmarking for FAR values for respective categories as FAR is a tool to achieve prescribed density for any particular area within the city. Whilst carrying out benchmarking for FAR values, select projects within India are assessed to arrive at the analysis. As the project is situated in GNIDA s jurisdiction, GNIDA FAR values were also added in the comparison. Table 4-2: Bench-marking for FAR for Select Projects Landuse Category Greater NOIDA Integrated Industrial Township Prefeasibility Study Dholera SIR Industry Commercial 4 Residential 5 2 Institutional Utilities 0.85 Global FAR 2 GIFT City Vikramaditya Udyogpuri, Ujjain GNIDA DCR Figure 4-11: Iconic Building Proposal in Dholera SIR Source: The guardian website ((Source: Final Development Plan (DSIRDA), 2010).Dholera SIR being an investment region will have much of the built up dedicated towards manufacturing industries thus calling for lower FAR. Moreover, the region being nearer to sea and most of the land falling under CRZ, the township aims for lesser density and lower FAR. Thus the global FAR for the township is GIFT City, Gandhinagar (Source - city is envisaged as a financial and commercial hub for two major urban development nodes, Ahmedabad and Gandhinagar. Objective for this township, the FAR proposed for the commercial land use is very high, i.e The key observations from the above benchmarking exercise are: a. Compared with other projects of similar nature / aspirations the FAR proposed for Dadri IIT appears to be optimised by the Consultants who worked on Concept Master Plan Report. b. Industrial FAR is varying from 0.6 to 1.8 for other cases. For Dadri IIT the Consultants have proposed Vertical Manufacturing Stack-up Factories/ Plug-and-Play Factories unlike the Standard Factories to optimize the use of FAR. c. In case of Vertical arrangement, planning of units will need to be done carefully to avoid any Hazardous Industrial Accidents. It comes under the strict purview of Health and Safety Aspects. Figure 4-12: Proposed Built-Form for GIFT city Source FAR for IIT in Dadri when compared to the FAR provisioned in GNIDA bye-laws, are higher for each type of land use. After the bench marking and analysis exercise for FAR, it is observed that the global FAR proposed for the township is 2, which is on the higher side when compared to the global FAR for other cases. According to the case studies, the maximum proposed FAR for industries is 1.8, but the FAR proposed for industries in IIT is This is in cohesion with the idea for industries - Vertical Manufacturing Stack-up Factories/ Plug-and-Play Factories unlike the Standard Factories. Proposed FAR for residential and commercial/mixed land use is comparable to the select projects. The other projects aimed to develop signature iconic buildings, mostly in commercial front and hence provisioned for higher FAR to commercial use. The proposed FAR for commercial use in IIT accommodates the vision, to develop the project as a flagship project with iconic structures that may become land mark for the entire DMIC corridor. Since the proposed industries are forecasted to attract huge employment and population the area, the resident density of the township is expected to be high, thus making the proposed FAR for the residential zone on higher side Industry Profiling Study The industrial profile mix suggested in the prefeasibility report comprises of Hi-tech, Bio-tech and R&D industries covering around 50.8% of the total land use distribution of the proposed township. The industrial share comprises of 41.5% of the Hi-tech industry, 26.9% of Bio-tech industry and percent of R&D industries. The industrial use for the proposed township constitutes fifty percent of the township due to which a review and understanding of the industry types, their function as individual types and when functioning in association with each other is required. The township being predominantly aimed to develop as an Integrated Industrial Township, it is mandatory to understand the integration of the functions of the suggested industrial types. Moreover, the introduction of the concept of Vertical Manufacturing Stack-up Factories/ & Plug-and-Play Factories, is a deviation from the standard low rise factories practiced in the country. The workability and success of the new concept is clarified after considering industrial townships outside country where it has already been taken up and implemented. Thus the following table, shows select projects, the industrial profile, their typical and exclusive features, input required, out generated and treatment to the outputs. It also shows the integration of the three industry typology. Figure 4-13: Iconic Building Proposed for GIFT city Source 4-4


55 Table 4-3: Industrial Profile Mix of Select Projects Hi-TECH BIO-TECH R&D As per pre-feasibility Study:As per pre-feasibility Study:a. Bio-Pharma: Develop vaccines a. Optoelectronics b. Bio-Agri: Hybrid seeds, transgenic crops, bio pesticides Sectors Involved b. Nano technology c. c. Bio-services: clinical trial, contract research Allied sectors d. Bio-Industrial: Enzyme manufacturing As per pre-feasibility Study:Sub sector for Hi-tech and Bio-tech sectors such as IT, Electronics, Automobile, Food, and Pharma etc. Mostly the sector will constitute training centres for the above mentioned sectors. e. Bio-Informatics: Creation and maintenance Low to mid-rise Mid to High rise High rise Tianjin hi-tech park Building Typology Shanghai Pharm valley R&D Building, Taihu Science & Technology Industrial Park, Shanghai Tencent building, Shenzen hi-tech park Kuopia Science Park 4-5
56 Hi-TECH BIO-TECH R&D a. High strength organic liquid waste water which requires treatment. b. Equipment was reused as input for water which containing inorganic salts, sugars, syrups and typically has low BOD, COD, and TSS, with near neutral ph. c. Negligible, Waste Generated E.g. Water from washing and cleaning of the equipments. Process liquors d. Spent fermentation broth Negligible. e. Spent natural product The industry mostly associates with developing and researching activities. It is recommended in the prefeasibility Report that the output of Bio-tech industries would act as an input for R&D industries f. Spent aqueous solutions g. Leftover raw material h. containers Raw Materials Used Computer equipment, and semiconductor manufacturing equipments The table shows the functions, building types, and activities constituting the three types of industries. It is noted that hi-tech industries generate negligible waste since they do not come under heavy manufacturing type industries. The bio-tech industries will produce different categories of waste which may be re used as input for generating other products. For instance, Bio-Agri industrial waste may be used for enzyme manufacturing. Other wastes of bio-industries are mostly raw agricultural wastes, so perishable and degradable. Thus such combination of industries will not have hazardous or non-perishable waste generated. Moreover, the building typology observed in different Hi-tech, Bio-tech as well as R&D parks, show vertical high rise buildings thus confirming the vertical stack-up factories concept. These buildings also see that land is used optimally. Mostly such arrangements work with the concept of a common manufacturing unit and the administrative/management units are stacked up vertically. Here the manufacturing units of different industries are integrated to optimize land. i. Scrubber water from pollution control equipment j. Volatile organic compounds k. (Bio-Agri industrial wastes are input for enzyme manufacturing) Raw agricultural materials( typically bulky, perishable and degradable) 4.2 Additional Bench Marking Studies Master Planning China Belarus Industrial park (Source The forthcoming examples provide a detailed analysis and description to concepts such as walk-to work, developing sustainable urban communities and linear city planning along TOD keeping in mind the fact that the site is a linear site. Two of the examples, i.e., China-Belarus Industrial Park and Mahindra, World City, Jaipur, provide in depth study of the land use distribution for an industry dominated township. The other two examples, Singapore CBD and Curitiba CBD, give an idea of development of a CBD, and the FAR zoning around it. Location and Site Appraisal Regional Setting and Connectivity The site is located at the most valuable territories it terms of urban development, on one of the main urbanized axis of the Republic, in the eastern sector of the Minsk suburban zone. At the north-east of the site there is a regional centre Smolevichi, an estimated satellite town of Minsk. On the East there are forests and clean landscapes of the Valley of Volma River which is one of the elements of the ecological framework of Minsk suburban zone, ensuring environmental welfare of the capital. 4-6


57 The industrial park is located directly in the area of main Republican, which is a part of the Trans-European Transport Corridor 2 which is going to accommodate high-speed railway. The site is adjacent to the existing area of the projectable second Minsk transport ring and it is located on strategically important site of interaction of the air and land transportation. Site Neighbourhood Profile The Industrial park has an area of hectares. There are 15 villages on the site. Within the site there are several arrays garden cottage cooperatives as adjacent to rural settlements and located separately. North-western part of the site is occupied with specially protected natural territory. The northern part of the land area is located in the local recreation zone having Children's health camps and gardening communities in it. In the western part of the site there is a Reservoir with protected zones. Southern part of the site is traversed with international gas-main pipelines. In north-south direction the site is traversed with air power transmission line 11 kv. 2. The urbanized part of the structure is a system of roads, main streets and planning units. 3. Planning units are created as public zones for placing of objects for cultural and community services at the crossing of the main streets. These are areas for construction of shopping centers, leisure centers, business centers, hotels and catering and other facilities catering to everyday services. 4. The site is divided into various functional zones in response to its surrounding context. The industrial zone consisting of equipment & hi-tech zone, logistic zone, located near the north east of the site along the all the major connectivity offered by the highways, railways and airport. 5. The residential zone are located along the main axis of the planning - the main street and are located close to the public centres and recreation zone that provides convenient pedestrian and vehicle access to service rendering facilities. 6. Connection with employment places is pedestrian, cycling and by means of public transport. Green areas are located as a buffer along the water reservoirs and transport corridors. There is a zone reserved for future development as well at the south of the site. Figure 4-16: Functional Zoning of the Industrial Park Source: Figure 4-14: Location Map of China Industrial Belarus park Concept Planning and Functional Zoning The conceptual planning of the Industrial park has taken into consideration both natural and urban elements, as follows: 1. Natural axis a natural complex of Volma River and Petrovichy water reservoir, which cuts off the southwestern part of the Park, and the system of special green plantings. Figure 4-15: Conceptual Planning of the Park Source: 4-7

58 Land Use Distribution Target Industries Production zone is divided into industrial zone and logistics and storage zone. In the production area on the general plan there are zones for location of high-tech enterprises and enterprises of joint production. Industrial zone in the northern part of the ChinaBelarus industrial park is designed for accommodation of hightech enterprises. The leading directions in this field are electronic and information industry, aircraft industry, enterprises for the development of new technologies and materials, biotechnologies, nanotechnologies, as well as enterprises for development and implementation of technologies and equipment for environmental protection At the initial phase of development of the China-Belarusian Industrial Park its population will be mainly formed from construction and installation personnel, engaged in the construction engineering. At the same period a number of facilities of town-forming and service group will to be built, providing part-time employment of the population of the industrial park. Figure 4-17: Master Plan of Belarus Industrial Park Source: Table 4-4: Landuse Distribution of Belarus Industrial Park Land use Category Phasing for the Project China Belarus Industrial Park Industry 17.6% Commercial 1.5% Residential (%) 11.9% Institutional / Public-Semi Public 10.5% At the first stage the number of employed population of Chinese Belarusian Industrial Park will be 25 thousand people, 6.7 thousand of whom will come from Minsk and surrounding areas. For the second stage the number of employed population will increase by more than 5 times and will reach 13 thousand people, 30 thousand of whom will come from Minsk and surrounding areas. After full development of the territory the density of work places per unit of industrial areas will comprise 108 people/ hectare Regulation for Growth Development 49.5 % Roads Total (Ha) 9% RZ5 zones of building limitation, they are established for the objects of the Ministry of Defence of the Republic of Belarus and the Ministry of Transport and Communications of the Republic of Belarus; RZ6 areas of unfavourable geological and hydro geological conditions of the development, they are established across the boundaries of conditionally favourable zones and zones unfavourable for construction. China Belarus industrial park has similar kind of site response and planning concepts adopted for the land use distribution. The industrial park has been planned along a natural axis in the form of a water reservoir which is similar to the water canal found in the project site. Industries in both the cases are located along the main transit road and rail corridor offering good connectivity. Both the projects have adopted similar kind of regulation zones which consist of buffer spaces w.r.t to existing structures, green linear and central park or green links provided to improve the quality of life Transit Oriented Development, Curitiba (Source Transforming Cities with transit World Bank, 2012) Introduction Curitiba, located in Parana State, Brazil is internationally renowned as one of the world s most sustainable, well-planned cities, in large part because of its success at integrating BRT investments and urban development. The present master plan of the park is executed in accordance with the regulations and complies with the said regulations. According to the planning restrictions the following regulatory zones are established at the territory of the Park: Curitiba was planned as a city with well-defined linear densities along BRT served corridors. Early in the planning process, Curitiba s master plan that sought to channel growth along designated corridors, mix land uses, intensify land development at key BRT stations, and introduce high-quality urban designs that encouraged pedestrian access to the BRT corridor. RZ1 protection areas of natural resources, they are set for specially protected areas and facilities, recreation zones, water intake protection zones, water protection zones and coastal strips, mineral deposits; The city has integrated a "radial linear-branching pattern" to protect density by diverting traffic from the city centre and protect green areas by encouraging industrial development along radial axes. Green Utilities RZ4 areas of transport and engineering structures and communications, they are established within the protection zones; RZ2 sanitary protection zones of recreation and tourism objects; RZ3 sanitary protection zones, they are established by plants, buildings and other objects, which are objects of impact on human health and the environment; 4-8

 categories.")

 5.")

59 3. In Curitiba there is a very distinct zoning pattern. High density, large, multi-use buildings are located along the main corridors. As you move farther from the main corridors the buildings become smaller, less dense and become strictly residential areas. As the distance from the structural axis decreases, the value of FAR decreases contributing to a mix of high density high-rise and low density low-rise buildings. Figure 4-18: Zoning along TOD Source: Report on Transforming Cities with Transit 4. Curitiba had 50 types of specific zoning regulation (ZR) categories. Each zoning category defines requirements related to land use, building-to-land ratios, FAR, and maximum building heights. For example, in the city centre area, the zone ZC category allows the development of residential apartments and commercial and service facilities subject to specific parameters: FAR up to 5, first floor building-to-land ratios up to 100 percent, and no limit on building heights in most areas. (However, to ensure aesthetics, buildings are normally limited to 20 floors, and some areas are subject to building height limitations to secure flight routes.) 5. In addition, many zones facing structural axes (arterial roads) allow the development of residential apartments and commercial and service facilities with FAR up to 4, first floor building-to-land ratios up to 100 percent, and no limit on building heights in most areas. 6. Bi-articulated buses operate alongside sidewalks and slow-speed frontage roads. Ground-floor retail on the lower floor of buildings and upper-level office and residential space set back several meters to allow sunlight to reach the street level creates a rich mix of land uses along trinary corridors. 7. The inclusion of mixed land uses and affordable housing allows developers to increase building heights, adding density to the corridor. The market has responded to this rich, differentiated mix of bus-based services along the corridor with high-rise development, supported by zoning and public improvements like sidewalks and landscaping. Figure 4-20: Curitiba Cityscape along Transit Corridor. Curitiba shows a lot of similarity with the physical aspect and the growth development pattern of the present project. Curitiba is divided by a main arterial transit corridor which is similar to the central spine in the proposed project. Along this arterial road we can find the presence of higher FAR and functions like offices, retail, and hotels. In Curitiba we can see a shift from radial concentric growth to a linear growth pattern which has also been adopted by the project due constrains offered by the site w.r.t to its rectangular, linear shape and size Mahindra World City, Jaipur (Source: Location and Site appraisal Regional setting and Connectivity Mahindra World city is located in Jaipur, Off Ajmer Road, on National Highway-08. It is in close proximity to the proposed Delhi Mumbai Industrial Corridor and dedicated rail freight corridor. The project is located approximately 260 km from Delhi Figure 4-19: Curitiba Cityscape Figure 4-21: View of Mahindra World City Specific Features The site is well connected to NH-8, airport, railway station, bus station and the city with good roads. This is a multi-product special economic zone and is collaboration between Mahindra group and government of Rajasthan. 1. Curitiba, Brazil has created articulated densities along its BRT corridors. A design element used here is the trinary three parallel roadways with compatible land uses and building heights that taper with distance from the BRT corridor. 2. One of the key concepts of urban planning in Curitiba was a shift from radial concentric growth to a linear growth pattern. The plan sought to decongest the inner city by reducing employment density and promoting development along the structured axis: north south direction. This plan allowed for subsequent expansion of transit and structural axes (arterial roads). 4-9


 Table 4-5: Landuse Distribution of Mahindra World City 4.2.4.1 Land Use Category Industry 43% Commercial 13% Residential 16% Figure 4-22: Aerial View of Mahindra World City 4.2.3.2 Concept Planning and Functional Zoning 1.")
60 Site Neighbourhood Profile The site has a land area of across 1,214 Hectare. With respect to infrastructure facilities, the water supply on the site is being provided by Govt. of Rajasthan and an underground water reservoir with ample storage capacity and internal water distribution is available on site as well. The power supply for the project is made available by Jaipur Vidyut Vitran Nigam Ltd and 2 dedicated sub-stations of 33 kv and 220 kv on site which distributes power to units through underground cable network. 6. The design approach ensures maximum utilization of potable water as well as treating and recycling to avoid water scarcity. The water supply distribution systems are designed to not only reduce energy consumption by atleast 30% but also enhance efficiency with reduction in losses up to 50% Land Use Distribution Target Industries The industrial park offers multi-product SEZ with dedicated zones for IT / ITeS, Engineering and Related Industries, Handicrafts, Apparel, Gems and Jewellery, Warehousing and Logistics as well as a Domestic Tariff Area (DTA) for various industries Central Business District, Singapore (Source: Table 4-5: Landuse Distribution of Mahindra World City Land Use Category Industry 43% Commercial 13% Residential 16% Figure 4-22: Aerial View of Mahindra World City Concept Planning and Functional Zoning 1. The concept of Sustainable Urban communities has been used in the Mahindra World City. The city is like an economic nerve-centre located away from the main hubs with a focus on economic growth and development. 2. Conceived with the vision of nation building, the Mahindra World City aims to transform the landscape of urban development in India. It intends to attract the best corporates with its emphasis on economic development and employment generation by creating infrastructure of global standards. In addition, the creation of Residential and Social Infrastructure catalyses a self-fulfilling ecosystem within the site. 3. The Business Zone in Mahindra World City Jaipur is designed to take advantage of the cluster in which it is located. The zones are classified by industry, enabling them access to common infrastructure resources, thereby providing low cost of ownership and a hassle free experience. Green 4% Utilities 6% Roads 18% Total (Ha) 1214 Ha Mahindra world city in Jaipur has adopted the concept of Walk to Work concept and Sustainable Urban communities with its emphasis on Introduction Mahindra World City economic development and employment Singapore has come to embody a model of efficient and growthoriented urban development. The development in Singapore aims to create partially self-sufficient towns and districts which are then further served by four regional centres, each of which serves one of the four different regions of Singapore besides the Central Area. These regional centres reduce traffic strain on Singapore's central business district by replacing some of the commercial functions the Central Area serves. Land use regulations reinforce the existing monocentric structure of the country.each town or district possesses a variety of facilities and amenities allocated strategically to serve as much as possible on at least a basic scale, and on the regional scale, an intermediate one. Any function of the Central Area not served then is allowed by the regional centre to be executed efficiently as it has the most sophisticated transport system with feeder buses and metro lines, which link up the regional centres and Central Area effectively. It has a Radio-concentric metro system, working with an extensive network of feeder buses and also adopts the system of congestion pricing for cars in the CBD. generation by creating infrastructure of global standards. In addition, the creation of Residential, Commercial and Social 4. The business zone is classified into a Domestic Tariff Area (DTA) and sector specific SEZs which include: Infrastructure catalyses a self-fulfilling ecosystem within both the sites. a. IT/ITES b. Engineering and Related Industries c. Handicrafts d. Apparel Figure 4-23: Land use Map of Mahindra World City, Jaipur e. Gems and Jewellery Source: 5. The project ensures minimum possible disturbances to the natural topography and soil. The plan incorporates retention of the existing drainage profile of the region with welldesigned storm water drainage system to care of the peak discharge. Figure 4-24: Singapore CBD Area 4-10


61 Singapore has a monocentric growth pattern in which it has a central business district which caters to different regional districts and has the presence of higher FAR. Each district possesses a variety of facilities and amenities allocated strategically to serve it. The present project has a CBD which caters to the industrial and residential land use and has been allocated with higher FAR giving way to presence of land mark building. More over there is presence of utilities and services that are located in such a way that it strategically caters to the overall demand of the industrial site. Key concepts adopted from the above mentioned bench marking is as follows: 2. It is designed with variety of uses as - commercial office space, residences, retail shops, hotels as well as civic and cultural facilities. 3. The broad Landuse categories with the breakup of parcel area is exhibited as follows Commercial 40 million SF (40%) Residential 35 million SF (35%) Retail 10 million SF (10%) Stack up Factory concept/ Plug and Play Factories Hospitality 5 million SF (5%) Walk to work Public Space 10 million SF (10%) Designing for Live-Work-Play environment Compact City Planning, Cluster Planning Figure 4-25: FAR Provision in Singapore CBD Area Self sustaining sector planning Source: Integration of Mixed Land uses linked with green open spaces Regulation zoning codes to regulate growth and development of myriad land uses Planning and designing of quality landscaped areas, public realm and amenities greenways and Promenades Adoption of linear growth pattern with development along the central spine (transit corridor) Sustainable growth communities which emphasizes on economic development and employment generation by creating infrastructure of global standards Specific Features As land is scarce in development in Singapore, it aims to maximize use of land efficiently yet comfortably and to serve as many people as possible for a particular function, such as housing or commercial purposes by promoting high rise and high density buildings for their development. CBD has the FAR ranging from 8 to 25. The areas adjoining the CBD have the FAR of 6 and the FAR in residential area varies from 1.5 to Songdo Hi-tech City, South Korea (Source Location: Songdo is a new Smart City or Ubiquitous City built from scratch on 1,500 acres (610 ha) of reclaimed land along Incheon's waterfront, 40 miles (65 km) southwest of Seoul, South Korea and connected to Incheon International Airport by a 7.4 mile (12.3 km) reinforced concrete highway bridge, called Incheon Bridge. Along with Yeongjong and Cheongna, it is part of the Incheon Free Economic Zone. Figure 4-27: Mater Plan: Songdo Hi-tech City Source - Figure 4-26: Singapore - Land use Source:


62 Commercial Songdo International Business District (IBD) is planned with a world-class hospital, an international preparatory school, a museum, an ecotarium, a 100-acre Central Park, the Jack Nicklaus Golf Club Korea and a shopping mall. A 100 acre Central Park is the city's center piece - further highlighting the commitment to providing open and green space. All blocks connect pedestrians to open space, walking/biking corridors and public gathering areas. Open spaces and public gathering areas are arranged to optimize access to sunlight, views and open sky. Native or adapted species shall be utilized throughout the development. High water demand plants will be minimized or eliminated from landscape designs. Energy Use: All NSIC, LLC projects will be built to or above ASHRAE standards - an internationally recognized benchmark of design quality. These guidelines will create comfortable, energy efficient buildings. A central, city-wide co-generation facility fuelled by natural gas will provide clean power and hot water to the project. Energy efficient LED traffic lights and energy efficient pumps and motors are planned for installation throughout Songdo IBD. A centralized pneumatic waste collection system will be installed to collect wet and dry waste, eliminating the need for waste removal vehicles. Transportation: A 25 km network of bicycle lanes within the project will facilitate safe, carbon-free transportation. 5% of parking capacity within each project block will be set aside as parking for fuel-efficient and low-emitting vehicles. Office and commercial blocks will reserve an additional 5% of parking capacity for carpool vehicles. Figure 4-28: Commercial Complexes in Songdo IBD Source - Housing 22,500 housing units Housing Typology includes Sea view, Central park view etc. Figure 4-29: Residential Towers in Songdo Approach Source % of construction waste is targeted to be recycled. Parking is primarily located underground or under a canopy to minimize the urban heat island effect and maximize pedestrian-oriented open space above ground. Recycled materials and locally produced/manufactured materials will be utilized to the maximum extent possible. Infrastructure for electrical vehicle charging stations will be integrated into parking garage designs to facilitate the transition to low emissions transportation. Some projects will realize a Portland cement reduction of 20% or more through the utilization of flyash-content concrete. Low-VOC materials will be incorporated into all buildings Water Recycling and Materials: Tianjin Hi-tech Park (Eco-City), China Irrigation-based potable water use will target a 90% reduction versus international baseline, reduced through the use of efficient landscape design, water-saving irrigation systems, reclaimed storm water and reuse of treated grey water from a city-wide central system. ( Location and Site appraisal Regional setting and Connectivity Approach Songdo is developed to become the global business hub of North-East Asia. It has been developed with an idea of Central Park, as in New York. It is being termed as the sustainable city. There are six core design goals for Songdo International Business District Open Space, Transportation, Water, Energy, Recycling and Operations Potable water consumption in plumbing fixtures will target a 20-40% reduction based on the use type of the project. Storm water runoff will be used to the maximum extent possible given the project's climate zone and annual rainfall pattern. Vegetated green roofs will reduce storm water runoff, mitigate the urban heat island effect and promote biodiversity and species habitat preservation. Cluster planning Neighbourhood centres with places to work, live, shop, play, and feel part of a community. Green Spaces Songdo IBD has been designated with 40% open space acres - to maximize the connection to nature within the city for residents, workers and visitors. Figure 4-30: Location of Map for Tianjin Eco-City China 4-12
, which has been identified as the next growth engine in China, after the")


63 The Eco-city site is located 40 km from Tianjin city centre and 150 km from Beijing city centre. It is located within the Tianjin Binhai New Area one of the fastest growing regions in China. Tianjin Binhai New Area is in turn located in the Bohai Bay region (which covers Beijing, Tianjin and part of Hebei Province), which has been identified as the next growth engine in China, after the Pearl River delta and Yangtze River delta. The Master Plan attempts to strike a balance between competing needs, including the social, economic and environmental needs of the Eco-city. It was jointly developed by the China Academy of Urban Planning and Design, the Tianjin Urban Planning and Design Institute, and the Singapore planning team led by the Urban Redevelopment Authority. Site Neighbourhood Profile Figure 4-32: Concept of Eco-Cell Modules Source - Figure 4-31: Illustrative View of the Tianjin Eco-City Source - Tianjin Eco-city has a total land area of 30 sq. km. The Eco-city is planned for a population of 350,000. The goal is to develop the Eco-city over years. The start-up area is scheduled for completion by end Figure 4-35: Master Plan, Tianjin. Figure 4-34: Tianjin Master Plan Prior to the development of the Eco-city, the site comprised mainly saltpans, barren land and polluted water-bodies, including a 2.6 sq km large wastewater pond Source - Concept Planning and Functional Zoning The Master Plan can be summarised as "1 Axis 3 Centres 4 Districts" Born through a partnership between the governments of China and Singapore, the Tianjin EcoCity project demonstrates the commitment of both countries in addressing climate change, energy conservation, environmental preservation, and sustainable development. The city was planned around the concept of eco-cell modules (each a 400m by 400m grid) which designated the land use of the area. These eco-cells were aggregated to form econetworks and in turn eco-districts. Within each area, we introduced elements vital to sustainability such as a 12km eco-valley running through the core of the city. On the ground level, the eco-valley acts as a recreational corridor and drainage system for harvesting rain water; beneath the ground level, it serves as a utilities corridor and houses the train system. Eco-Valley is organized into seven parts, the plan will boast a Lifescape, an Eco-Valley, a Solarscape, an Urbanscape, a Windscape, an Earthscape and Eco-Corridors that will offer residents a different landscape ranging from the stepped, terraced greenery of the Earthscape to the more futuristic soil-shaped mounds of the Lifescape. Figure 4-33: Eco-valley Tianjin Source Land Use Distribution The Eco-city is planned to be compact, with a good mix of land uses and based on Transit-Oriented Development (TOD) principles. Each district is planned with amenities and jobs located close by. Local and centralised facilities are provided to serve the needs of residents in each neighbourhood. Each district is served by urban centres. Business Parks are located close to residential areas to provide employment for residents, which is within easy access of their homes. "1 Axis" this refers to the Eco-valley cutting across the Eco-city, which is the green spine of the city. It links up the City Centre, the 2 sub-centres and the 4 districts in the Eco-city, and provides a scenic trail for pedestrians and cyclists. The tram system, which will be built to meet the Eco-city's transport needs, will run along the Eco-valley. "3 Centres" this refers to the main City Centre on the promontory on the south bank of the Old Ji Canal and the two sub-centres in the south and the north. "4 Districts" this refers to the residential districts in the southern, central, northern and north-eastern parts of the Ecocity. Each district contains several housing neighbourhoods 4-13


64 comprising a variety of housing types, as well as their respective commercial and amenity centres serving their communities. The Eco-Industrial Park covers a planned area of 130 hectares, with ready-built facilities beyond land options for eco-industrial players to establish their North China industrial base in the EcoCity. Built in compliance with green building evaluation standards, this green industrial park will feature eco-technologies such as energy-efficient building materials, solar technologies and rainwater harvesting. The Industrial Park serves as a regional hub for Logistics, Warehousing, Distribution Centre, Electric Vehicles, Green Building, Clean Energy, Green Transport, Clean Water, Waste Management and Environment Management 4.3 Bench-Marking for Sustainability Figure 4-37: Industry Zoning, Tianjin Source Figure 4-36: Functional Zoning, Tianjin Source Target Industries Tianjin Eco-city consists of Eco-Business Park, Eco-Industrial Park and Eco-Information Park. Capitalizing on the strategic positioning of the Eco-City, the Eco-Business Park is poised to become the heart of research, training, testing, innovation and commercialization of clean technology in China. It will house a full continuum of clean tech activities from upstream R&D to commercialization and test-bedding. Phasing for the Project Tianjin Eco-city has a total land area of 30 sq. km. The Eco-city is planned for a population of 350,000. The goal is to develop the Eco-city over years. The start-up area is scheduled for completion by end Prior to the development of the Ecocity, the site comprised mainly saltpans, barren land and polluted water-bodies, including a 2.6 sq km large wastewater pond. Next phase of the Eco-City is an integrated community hub for work, live and play. The Eco-Information Park will provide abundant opportunities for investors, in particular those focusing on the IT cluster. "Development that meets the needs of the present without compromising the ability of future generations to meet their own needs. (Source: Brundtland Commission) Different benchmarking studies have been undertaken, at township and city level to understand the parameters that must be implemented so as to make a development sustainable. These studies have been chosen across the globe and are internationally known for their sustainable characters. There are no single standards which outline (or quantify) set of parameters attached with.specific values for Urban Planning component. However, there are useful guideline documents which elaborates on sustainable urban planning principles to be achieved in the development projects. These documents though compiled at different continents and geographies, echo the overlapping principles and parameters. Some of the guidelines documents referred are listed below:1. Urban Development guidelines by Ministry of Urban Development (MOUD), The Business Park is a Centre for: R&D, Innovation and Incubation, Testing & Certification, Regional HQ for MNCs, Data Storage, Software Development, Training & Education, Multimedia or animation. A sustainable city or sustainable urban development is defined as: Improving the quality of life in a city, including ecological, cultural, political, institutional, social and economic components without leaving a burden on the future generations. It is a city designed with consideration of environmental impact, inhabited by people dedicated to minimization of required inputs of energy, water and food, and waste output of heat, air pollution, methane, and water pollution. 2. Transit Oriented Development by Institute for Transportation and Development Policy (ITDP), USA 4-14
65 3. Eco-Low Carbon Urban Planning Methodology by FCO Prosperity Fund, China s Ministry of Housing and Urban Rural Development (MOHURD) and Atkins. 7. Sustainable parameters for Low Carbon cities, Malaysia The extract from these guiding documents is exhibited in the form of matrices one for the benchmarking sustainable townships and the other for sustainable cities across the globe where the sustainable parameters of each benchmark example is highlighted. 4. Sustainable Region Initiative, Vancouver 5. Charter for Sustainable Urbanism, Freiburg The first matrix depicts the benchmarking of various case studies which is inspired in attaining sustainable urban planning principles. It also demonstrates the sustainable planning parameters achieved in IIT, Greater Noida. 6. Sustainability Principles of Spanish Urban Planning Table 4-6: Benchmarking for Sustainability in Urban Planning case of Townships Sustainable UP Parameters Songdo, South Korea China, Belarus 1 (To be adopted) Land-Use Plan i Approach ii Cluster planning There are six core design goals for Songdo International Business District Open Space, Transportation, Water, Energy, Recycling and Operations Neighbourhood centres with places to work, live, shop, play, and feel part of a community. Emphasis on high-tech and competitive innovation productions with high export potential. Industrial park planning has taken into consideration both natural and urban elements like the natural axis offered by the site context as an approach to Planning. Plots or units are planned by way of creating structure of roads, main streets and planning units created by various zoning regulation. iii Mix Development iv v IIT, Dadri Tianjin Eco-City Compact Development / Densify Green Spaces Commercial office space, residences, retail shops, hotels as well as civic and cultural facilities. FAR for commercial and residential are on higher end, thus leading to compact vertical development Songdo IBD has been designated with 40% open space acres - to maximize the connection to nature within the city for residents, workers and visitors. A 100 acre Central Park is the city's centerpiece - further highlighting the commitment to providing open and green space. All blocks connect pedestrians to open space, walking/biking corridors and public gathering areas. Open spaces and public gathering areas are arranged to optimize access to Mix use development of equipment & hi-tech zone, logistic zone, outsourcing zone and public zones consisting of shopping centers, leisure centers, business centers, hotels and catering and other facilities. The Park has proposed the density of 22 P/Ha at site level and 205 P/Ha at residential territory. The development strategy of the landscape and recreation area of the park presupposes complex and balanced development of landscape and recreational areas that provide environmental and ecological conditions for stable development of the Park. Promote as the model for the future planning of sustainable cities in China. Design of the eco-city is based on four concepts, including an eco-valley, a water body development, five eco-districts and six urban centres. Organized into seven parts, the plan will boast a Lifescape, an Eco-Valley, a Solarscape, an Urbanscape, a Windscape, an Earthscape and Eco-Corridors which vary in terms of landscape and programmatic offerings. Eco-districts are made of eco-cells and ecocommunities. An eco-cell is 400x400m in size and can accommodate 2,500 dwelling units. Four such eco-cells make up an ecocommunity, consisting of 9,000 dwelling units. Four or more eco-communities make up an eco-district. The project offers a mix use development of industries, residential Areas like the Urbanscape, will be more compact with higher density buildings, whereas the plan also provides areas for smaller developments, such as its Windscape section. The planning places a strong emphasis on landscaping as residential towers rise amidst the parks, promenades and valleys that create the plan s primary network. Variation of landscape along the seven districts ranging from the stepped, terraced greenery of the Earthscape to the more futuristic soil-shaped mounds of the Lifescape. A Model City for world class Integrated master planning promoting Work-Live-PlayLearning environment Vibrant Industrial Spaces Mixed use and urban design with focus on open spaces to enhance the identity and quality of built environment Land optimization and intensification through industrial clustering and building typologies to achieve maximum green cover. Each cluster is to be designed in a selfsustained sector manner. Interwoven with greenways and linear green Sector/ Neighbourhood Concept Planning with Grid Iron Pattern Roads Mix use development of Industries along with other land use of commercial, residential, utilities is to be planned. And facilities like Shopping Mall, Hotels, Convention centre, financial institution, Galleries, offices and other entertainment. Compact City Approach is to be adopted Close-Knit Mix of land uses with sufficient Density and Diversity. Planning Resilient Planning, reducing Carbon footprints Greenways to be introduced for accessibility to all clusters The greenways will comprise Pedestrian and Cyclist walkways with high quality landscaping works. Introduction of central spine running vertically all along the site is to be flanked by continuous linear Green Park on its both sides. Planned canal promenade to be introduced along both the side of Kot Escape. 4-15
66 Sustainable UP Parameters Songdo, South Korea China, Belarus IIT, Dadri Tianjin Eco-City (To be adopted) sunlight, views and open sky. Native or adapted species shall be utilized throughout the development. High water demand plants will be minimized or eliminated from landscape designs. vi Socially Responsive It boasts of international school, hospital and other socially responsive world-class infrastructures. Accommodating the existing settlement and Provisions for affordable housing on site. 2 Accommodating the existing religious and sensitive structures in the master plan. Provisions for affordable housing on site Provision of neighborhood level common spaces and thereby achieving social cohesiveness in plan. Master Plan will be planned by taking into account adjoining settlements Climate Responsive Built Form i Orientation Due consideration given to building orientation and shape so as to trap wind direction and solar energy ii Form The site is reclaimed from sea, thus the site shape is very conducive to built-form iii Eco-sustainability features like designing common areas to support community spirit and social harmony among residents Provisions for subsidized housing and catering myriad income levels and professions, creating a diverse social atmosphere. Promote eco-culture among residents, where 90% will walk, cycle, or take transit. Materials NA 75% of construction waste is targeted to be recycled. The site has an organic shape but the roads and the plots are laid out in an grid iron (geometric) pattern. NA The plan provides Urbanscape, which has compact and high density built form and also provides areas for less density, such as its Windscape section which helps in urban ventilation Due Consideration to Prevailing Wind Direction (NW to SE) to achieve Urban Ventilation through alignment of roads and streets will be given. A unique urban built form is achieved for buildings by a cohesive landscaped thread. The landscape is a flexible entity that is also defined and shaped to offer different built form and experience to users. All buildings of the eco-city project feature an environmentally sustainable design and use green materials for construction. It has a 12km eco-valley running through the core of the city, which on the ground level acts as a recreational corridor and drainage system for harvesting rain water and beneath the ground level; it serves as a utilities corridor and houses the train system. Eco-districts has urban centers which provide amenities such as malls, schools, parks and recreational spaces. The site has a linear shape with a proportion of 1:4:5 Grid-iron pattern arrangement of roads and plots must be adopted. Development and aesthetic guidelines are to be prepared for the township depending on factors like land use and built form, context and location, neighborhood characterization and energy efficient materials. Shared physical and social infrastructure facilities are will be planned at site level like utilities (STP, IPS, SW, ESR and Gas), Roads, Open spaces, Educational and Healthcare facility, Hotels Safety and Security/Public facilities, Sports facilities and Retail facilities. Linear park on both the sides of central spine road strongly will strongly promote shared facilities recreational, RWH, cycle tracks, pedestrian facilities. Recycled materials and locally produced/manufactured materials will be utilized to the maximum extent possible. Some projects will realize a Portland cement reduction of 20% or more through the utilization of flyash-content concrete. Low-VOC materials will be incorporated into all buildings iv Shared Facilities NA Many physical and social infrastructure facilities are shared at site level like utilities (electrical, communication, gas, water, STP, and SW ), Kinder garden institutions, Schools, Hospitals, Trade companies, Public catering companies, Domestic services companies, Hotels 4-16
67 Sustainable UP Parameters v I Energy Efficiency Songdo, South Korea China, Belarus All NSIC, LLC projects will be built to or above ASHRAE standards - an internationally recognized benchmark of design quality. These guidelines will create comfortable, energy efficient buildings. NA 3 IIT, Dadri Tianjin Eco-City The project also incorporates sustainable technologies solar and wind power, rainwater harvesting, desalination, intelligent building systems, building energy optimisation, district cooling / heating systems, vacuum sewage systems and pneumatic waste collection systems to achieve energy efficiency (To be adopted) For achieving energy efficiency various sustainability principles will be adopted for land use planning and various sustainable materials for building construction will be recommended sustainable materials like Alcoa - Smog eating façade, Danpalon Polycarbonate, Recycled Steel, Low - E Windows, etc. Transportation i Walk Accessible pedestrian zones are the overall coherent form of the city. It had identified pedestrian zones thresholds at different sectors to make it for pedestrian friendly and reducing the caruse. Various connections with employment places is offered in the park like pedestrian, cycling and public transport. NA ii Cycle A 25 km network of bicycle lanes within the project will facilitate safe, carbonfree transportation. NA NA Cycle network will be planned along the roads and green ways iii Transportation 5% of parking capacity within each project block will be set aside as parking for fuel-efficient and low-emitting vehicles. Office and commercial blocks will reserve an additional 5% of parking capacity for carpool vehicles. Scheduled bus lines with arrangement of bus stops are planned at all main streets. Also it is proposed to build reserved routes for high-speed trams for passengers traffic to link to regional connectivity modes of transport by way of air, road and rail. NA Efficient transport facilities such as bus rapid transit system, car share and bicycle facility will be introduced Maximum parking will be proposed underground as basement parking to optimize ground area for landscaping and pedestrian facilities Parking is primarily located underground or under a canopy to minimize the urban heat island effect and maximize pedestrian-oriented open space above ground. Infrastructure for electrical vehicle charging stations will be integrated into parking garage designs to facilitate the transition to low emissions transportation. Greenways is to be proposed all throughout the site. 4-17
68 Table 4-7: Benchmarking for Sustainability in Planning: Cities Sn. Sustainable UP Parameters Vancouver, Canada Freiburg, Germany 1 Curitiba, Brazil Land-Use Plan i Approach The approach to make Vancouver a City of Sustainable Neighbourhoods in The Land Use Plan 2020 is committed to reducing land use as far as possible and includes about 30 hectares less building space than was previously available. Transit Oriented Development along BRT served corridors ii Cluster planning Neighbourhood centres with places to work, live, shop, play, and feel part of a community. NA NA iii Mix Development The city is being completely rezoned to create a mix landuse character for each neighbourhood. Vauban neighbourhood was the first zero-energy village where parallel to private development, infrastructure was created that encompassed schools, kindergartens, youth facilities, civic meeting places, a market place, as well as spaces for recreation and play. Adjacent to the Transit corridor, vertical development with mix landuse is observed. Mixed use buildings such as offices/commercial at the bottom and residential; at the top for the ones with highest FAR. iv Compact Development / Densify NA Green Spaces The city has planned parks, gardens, beaches and centres. The city s 2020 action plan aims to make Vancouver as the greenest city. 40% of each neighbourhood is planned to be under green. The city is located in a green belt, with 500 hectares of green space stretching from the periphery right into the heart of the city. Each neighbourhood is made socially responsive, by including housing for all economy. EWS housing is assisted with infrastructure, well connected tram systems, schools and hospitals. v vi Socially Responsive NA Higher FAR adjacent to transit corridor, with gradually reducing FAR away from the corridor. Vertical development adjacent to BRT corridor, so that max. people get access to public transportation. Built parks instead of canals to reduce flooding. Also used parks to make the city more liveable. Creating and retaining parks and green space beside the rivers. This acts as a floodplain. When the Iguazu River floods, some areas created are used as boating lakes. The recycling plants provide employment to the homeless, disabled, and alcoholics. Transport coupons are provided in exchange of waste to the poor. The recycling program created jobs for the poorest sector people 2 Transportation 3 Transportation Vancouver rejected inner-city freeways in the 1960s. It puts emphasis on increasing transit use by restricting downtown parking, and reducing transportation demand by approving new housing close to downtown jobs. Freiburg s traffic and transport policy, which drew attention nationwide, gives preference to environment-friendly modes of movement (pedestrian traffic, cycling, and local public transport). The city was rewarded for its efforts with the "European Local Public Transport Award". Bus Rapid Transit System first came in Curitiba in It provided designated lanes only for buses and provided colour coded for buses going in different routes. i Walk 80% of the citizens use walkways and cycle tracks for daily commuting NA Curitiba has the largest downtown pedestrianised shopping area in the World. Pedestrianised the downtown area. ii Cycle NA The contribution of cycling to the city s volume of traffic increased from 15 to 28 percent NA iii Public Transportation The City works together with Trans Link and Metro Vancouver municipalities to build and maintain an integrated transportation system Public transport increased from 11 to 18 percent. The distances driven by motor vehicles decreased from 38 to 30 percent. Compared with other major cities in Germany today, Freiburg has the lowest motor vehicle density, with 423 motor vehicles per 1,000 people. Curitiba has bus system that is so good that car traffic decreased by 30% while the population trebled in a twenty year period. 4-18
69 Sn. Sustainable UP Parameters Vancouver, Canada Freiburg, Germany 3 Curitiba, Brazil Environment i Air Quality City Plan emphasizes on air quality, involving citizens and businesses to protect the air quality Freiburg takes care of the Air quality and emissions from as early as NA ii Water Management City Action Plan 2020 includes :- NA NA Waste Management The Greenest City 2020 Action Plan includes the target for towards zero waste for the city. Covers garbage collection for all the household. *Introduction of the concept of waste avoidance The city has adopted green swap The people in poorer areas would collect garbage from their end, deposit at collection points and in exchange would be given basic needs such as rice, vegetables etc. iii Safe, accessible drinking water for all, reducing water consumption and conserving Vancouver s waterways, preparedness for disasters Waste avoidance is rewarded by a system of incentives: benefits for the use of textile diapers, discounts for collective waste disposal pooling and for people who compost their own green wastes Non-recyclable waste from the region is incinerated at a plant in the Industrial Park Breisgau It supplies energy to 25,000 households. Energy generated from the fermentation of bio-organic wastes covers one percent of Freiburg s energy demand. 4.4 Summary The exhaustive exercise that has been carried out above was to bring in together sustainable approaches practices around the world and to integrate the appropriate parameters into the context site. The table below summarizes the best guidelines and principles adopted from various international examples and also mentions the approaches that will be adopted for the landuse plan to make it sustainable and climate responsive. Principles for Integrated Industrial Township Mixed Land Use Compact Planning Placemaking Opportunities Energy efficient Building and LEED rated building Work-live-play-learn environment Mixed Land Use Emphasis on quality green open space Articulated densities/far and land use along the transport corridor TOD development Linear Planning Concepts Compact Development International Examples Best Practices Guidelines and Principles Urban Development guidelines by Ministry of Urban Development (MOUD) Transit Oriented Development by Institute for Transportation and Development Policy (ITDP) Du Biotech Park, Dubai Sustainability The sustainable parameters are sourced from detailed studies of Global Planning Documents which serve as 'guidance' towards planning for sustainable townships/ cities. These are: 1. Land-Use Plan i. Eco-low carbon Approach One North Masterplan, Singapore Sustainable Region Initiative, Vancouver Charter for Sustainable Urbanism, Freiburg iii. Mix Development Sustainability Principles of Spanish Urban Planning iv. Compact Development / Density Sustainable parameters for Low Carbon vi. Exclusive Green ways (promoting walk-to-work Curitiba, Brazil ii. Climate Resilient Planning v. Quality Green Spaces ensuring Healthy Lifestyles 4-19
70 Principles for Integrated Industrial Township International Examples Best Practices Guidelines and Principles cities, Malaysia Development Concepts for Industrial Product mix Cluster Development Mixed Land Use Emphasis on quality green open spaces Articulated densities/far Compact Planning Mixed Land Use CBD Mixed Land Use Development Concepts for Industrial Product mix Emphasis on quality green open spaces Socially Responsive Planned public transportation throughout the site China Belarus Industrial park Climate Resilient Planning Features Energy efficient built form concepts Eco-city Master Planning Concepts Diverse Public Green spaces Walk-to-work Tianjin Eco City Compact city planning Energy efficient Building and LEED rated building Articulated densities/far Pedestrian Friendly City Mixed Land Use Enhancing the existing water ways Songdo, South Korea Kulim Tech Park, Malaysia Eco-Low Carbon Urban Planning Methodology by FCO Prosperity Fund, China s Ministry of Housing and Urban Rural Development (MOHURD) and Atkins. Sustainability concept) vii.. Socially Responsive (covering all sections of society and their needs) 2. Climate Responsive Built Form i. Street and building Orientation ii. Building Forms and Skyline Singapore iii. Materials iv. Shared Facilities v. Energy Efficiency 4-20


71 rounded or flat sections placed across the roadway. While they are effective in slowing fast vehicles, unlike speed breakers, they can be traversed comfortably by cycles, buses and emergency vehicles. Traffic calming measures have been successful in reducing speeds, accidents and even traffic volumes. For example, in the US, speed humps have helped in reducing travel speeds and accidents, on average, by 23% and 41%, respectively. 4.5 Transport Planning Best Practices As stated in the vision statement, the proposed IIT is envisioned to incorporate international best practices. This section describes best practices in transport planning adopted across the world, which can be adopted in the proposed IIT. Bicycle Share Greenways National and Internation al Best Practices Considered Car Share BRTS b. Greenways Greenways are dedicated cycle and pedestrian routes that are visually and physically segregated from roads and surrounded by trees and plants. Due to the ambience and comfort associated with Greenways, they have a higher probability of influencing car users to shift to cycling and walking. Greenways are usually combined with other bicycle and public transport schemes like Bicycle Sharing and Bus Rapid Transit to provide seamless inter-modal travel options. According to a survey conducted by RITES in 2008, 41.5% of all trips in Delhi are bus trips and 6.8% are bicycle trips. Nearly all bus commuters walk to the bus stop from their point of origin or to their final destination. Therefore, Greenways in the Indian context can facilitate safe and comfortable short distance trips, and provide vital first/last mile connectivity for public transport users. Circulators/ Trolley Buses Smart Signals Modern Design Strategies Figure 4-38: International Best Practices a. Traffic Calming Traffic calming measures are design interventions adopted to reduce traffic speed, volumes and enhance safety for all road users including pedestrians and cyclists. While smoother, straighter and wider roads facilitate uninterrupted traffic movement, they also inadvertently lead to increased speeds and therefore, traffic accidents. This increases the probability of crashes and fatalities especially those involving motorized and non-motorized modes of transport. Traffic calming measures help in slowing down traffic and even reduce traffic volumes. Traffic calming can be grouped into the following categories: i. ii. iii. iv. Vertical Deflections - Speed humps (not speed breakers), raised intersections, raised crosswalks, textured pavements. Horizontal Deflections - Chicanes, pedestrian refuges islands. Roadway Narrowing - Curb extensions, chokers. Closures - Median diverters to prevent turns, cul-de-sacs, full closures, half closures, median barriers. c. Bus Rapid Transit According to EMBARQ, 166 cities in the world have adopted BRT with varying degrees of success. The ITDP ranks BRT systems as Gold, Silver and Bronze using a 7category (33 sub-categories) scoring system. Under this ranking scheme, only 7 BRT systems qualified for a Gold rating, and 16 qualified for the silver and bronze rating. It should be noted that the Ahmadabad BRT system was the only Indian BRT system which obtained a rating (silver) while other systems like Delhi and Pune were unrated for not being able to meet ITDP's qualifying criteria. Therefore, unsuccessful implementation of BRT systems in Pune and Delhi should not be misconstrued as a failure of the system itself. The BRT corridors in both Delhi and Pune were deemed unsuccessful due to planning and design flaws such as discontinuous bus lanes, lack of access to bus stops, nonsegregation of ordinary and BRT buses, poor enforcement, and inefficient intersection treatment. A number of cities including some in developing Asian countries have immensely benefitted from well planned and design BRT systems. Further, the advent of new technology has resulted in narrowing the gap between BRT and LRT. As shown in Figure 4-39, "train-like' BRT buses are now being adopted to overcome the resistance, apprehension and/or stigma associated with riding an ordinary bus. Figure 4-39: Las Vegas BRT After the success of the Delhi Metro, policy makers in Indian cities have developed a preference for metro projects over improved bus systems. While Metro rail systems have been successful in India and around the world, a policy report prepared for the Asian Development Bank shows a minimum ridership requirement of 40,000 passengers per hour per direction to justify a Metro system. An LRT system requires a minimum of 20,000 while a BRT is suitable for as low as 5,000 pphpd to as high as 35,000 pphpd (Tiwari 2006). Figure 4-40 provides a summary of ridership range for different modes of public transport. This report also states that while the minimum distance required by a BRT to attract ridership is 5 km, it is 15 km for both Metro and the LRT. As the BRT has lower fixed infrastructure requirements, is easier to construct, it can operate in lower population densities than the other two alternatives. Further, it can also be extended more widely into urban areas than a Metro or an LRT. Even in terms of operating cost per trip, BRT is the cheapest option among the three with an average cost of INR for a bus trip, INR 30 for an LRT ride and INR for a metro ride Ridership Range (pphpd) Traffic Calming BRT Speed humps, bumps, tables and raised crosswalks are the most commonly used traffic calming measures. They consist of raised, LRT Metro Figure 4-40: Ridership Requirements 4-21

72 Additionally, capital costs for high quality BRT systems range from approximately Rs 10 to 20 Crore per kilometer while LRT systems cost approximately Rs 100 Crores per kilometer. Elevated and Underground Metro rails cost approximately Rs Crore per Kilometre. It should be noted that the Silver standard Ahmedabad BRTS cost approximately Rs 14 Crore per Kilometer (China 2014) while the Delhi Metro cost approximately INR 175 Crores per kilometer. Additionally, the operating costs for the Metro and LRT are also considerably higher than that for BRT systems. According to ITDP s Bus Rapid Transit Planning Guide, the operating costs of Metro systems are 10 to 100 times higher than that of BRTS, all else being same. Complete Streets are also gaining popularity in India. The Municipal Corporation of Chennai and ITDP (Chennai) recently launched a complete streets program. Under this initiative, Chennai roads are proposed to provide wide and continuous footpaths and protected cycle tracks. The design is will accommodate bus users, pedestrians and will have clearly designated areas for on-street parking. Other modern design practices include median optimization to provide flares at junction, dedicated turn lane, acceleration and deceleration lanes, and multi-modal junction design. f. As a concept, Personal Rapid Transit System (PRTS) has also gained popularity especially after its implementation at Heathrow airport in London. A PRT system was also proposed in Amritsar but was eventually dropped due to its cost implications. Similarly, the PRTS proposal for the Masdar industrial township in Abu Dhabi has also been abandoned. With rapid strides being made in the field of self-driving vehicles, any investment in systems like PRT is likely to become obsolete in the coming years. For example, Google's self-driving cars have travelled more than 15 lakh miles through dense urban environments without any accidents. While the technology hasn't been made available commercially, it is likely to bring a paradigm shift in smart public transportation as cities will be able to plan PRT systems at a fraction of the current costs. d. Circulator Systems - As the name suggests, circulators consist of modern buses or even context sensitive rubber-tire trolleys that circulate across a region to provide connectivity between urban destinations. Urban circulators operates within a closed loop, usually 3 miles or shorter in length, and operate at high frequencies. Circulator systems of various types have been successfully used across the world either as standalone systems or as feeder services for mass rapid transit systems. Circulators are usually branded separately from other public transport systems by attaching cultural or historical significance. Theme based circulators like the one shown in Fig 4-41, have the potential of adding character to the service area while adding an element of novelty to public transport systems thereby increasing the probability of attracting car users. Figure 4-41 Rubber Tired Trolley, Klamath Falls, Oregon Circulator systems are inexpensive since they require no special infrastructure such as guide-ways, exclusive lanes, specially designed vehicles or special signals. Such systems provide easy mobility and access to the residents as well as professionals in the area at a high frequency reducing the need for car usage particularly for those who reside and work within a 5 km area. e. Modern Design Modern design principles include concepts such as complete streets and innovative junction designs which enhance safety and travel experience for all modes of transport including non-motorized modes. Complete streets are streets operated and designed for everyone including pedestrians, bicyclists, other non-motorized transport, automobiles, public transport, transit riders and even street vendors in the Indian context. Complete streets ensure equitable distribution of road space to all road and not only car users. In spite of such modal variations, street design and transport planning in India has been heavily biased towards supporting private vehicles while not accommodating pedestrians, transit users and differently-abled road users. Complete streets in the Indian context should include footpaths, bike lanes, special bus lanes, and low speed lanes for cycle rickshaws, frequent and safe crossing opportunities, median islands, and designated spaces for street vendors, provisions for safety of differently-abled citizens, and comfortable and accessible public transport stops. Complete Streets have the potential to provide significant benefits especially in developing countries like India. For example, a Complete Streets concept has been implemented along Avenue Eduardo Molina in Mexico City (ITDP 2013) to give priority to pedestrians, public transport and bicycles with 20 kilometers of bike lanes, bike parking at stations, and numerous pedestrian safety measures. The strategy is expected to reduce travel times for transit users, pedestrians and cyclists by 40%, and also have a significant impact on carbon reductions. Smart Signals - Traffic signal technology has undergone significant improvements over the past three decades and has resulted in development of several algorithms and devices that have enhanced the efficiency of signal systems. Adaptive signal systems (commonly known as "smart signals") represent one such technological advancement. Smart signals rely on vehicle detectors placed strategically along a region's roadway network. The vehicle detectors count traffic every minute and dynamically relay information to a central computer. The central computer processes this information through a complex algorithm which is programmed to find the most efficient signal timing plan for all intersections under its control. In contrast to smart signals, most signals in India are based on fixed signal timing plans prepared by local traffic police departments. These signal timing plans cannot take into account fluctuations in traffic during different times of the day. As a result, drivers experience unreasonable stops due to inefficient allocation of green time. Smart signals have the ability to recognize traffic demand levels across a wide region and provide green lights in a strategic sequence that ensure minimum possible stops. Cities like New Delhi and Pune have implemented "Smart Signals" with varying degrees of success. While New Delhi implemented a UK based system, Pune installed a system developed by C-DAC in India. This C-DAC 'Smart Signals" system was installed at 38 key junctions in Pune (CDAC 2007) at a cost of INR 6 Crore. The system is expected to result in an annual savings of Rs 6 Crore through fuel and delay savings. g. Car Share/Car Clubs Car share or Car Clubs is an innovative concept that is gaining ground in numerous countries such as the USA, the UK, France, the Netherlands, Malaysia, Turkey, China and Germany. Although there are very few known Car sharing schemes in India, other developing countries such as Brazil, Mexico, and China have successfully implemented this strategy on a large scale with significant benefits. Additionally, the NTDPC s report (NTDPC 2014) on Urban Transport recognizes and recommends Car share as an important urban transport strategy. This concept is a form of car rentals in which private 4-22
73 companies deploy a fleet of energy efficient cars and rent them on an hourly basis. Patrons approach vacant cars and swipe their membership or credit cards to rent the car. This scheme generally includes providing designated parking spaces at various locations and providing real time updates on parking and vehicle availability to customers via smart phone apps and web browsers. The benefits of Car sharing include: effort) bicycles for rent on an hourly basis. Patrons approach bicycle share station and swipe their membership/credit cards to rent a bicycle. The rental stations occupy minimal linear space and can either be designed to blend into the region s character or add character to a region. It must however be noted that accidents involving cyclists on Indian roads are disproportionately high The benefits of bicycle sharing include: a. Greater flexibility for commuters who wish to use public transport but are wary of depending entirely on public transport. For example, commuters can ride the bus/train in the morning and rent a car for their return journey, if necessary. Similarly, the system also provides additional flexibility to carpoolers who do not have to depend on fellow carpoolers during emergencies. a. Providing flexibility for public transport commuters. For example, commuters can ride the bus/train in the morning and rent a bicycle for their return journey. Similarly, the system also provides additional flexibility to carpoolers who do not have to depend on fellow carpoolers during emergencies. b. Comfortable last mile connectivity between residence/office and nearest public transport stops thereby encouraging car owners to use public transport for the longer segment of their commute. The pricing structure for car share is developed strategically to encourage shorter trips and prevent overnight rentals. c. Efficient use of parking space. Commuters who use private vehicles park their cars at their workplace occupying valuable parking for the entire day. With car sharing on the other hand, cars are parked for short periods of time resulting in higher average parking turnover rate and hence increase the parking capacity of the region they operate in. d. Generate revenues for themselves through advertisements (external or dashboard) and for public agencies through parking space sale/leases. e. Studies conducted in the US and Europe show that 22% car share members gave up a private vehicle after joining a car sharing program. In addition, 34% of the members said that they avoided buying a car after joining a car sharing program. This report also estimates that every car sharing vehicle results in taking 14.9 vehicles off the road and reduced net parking demand by 13.9 vehicles for each shared vehicle parked (FTA 2005). Other studies (Cooper 2000) in the US have shown that car sharing had helped reduce total vehicle miles travelled (a measure of congestion) by 25% for members who owned cars but an increase of 19% for carless members in the short term. The study further showed that car share members reported a 26% increase in walking, a 10% increase in cycling, and a 14% increase in use of public transport. b. Provide comfortable last mile connectivity between residence/office and nearest public transport stops thereby encouraging car owners to use public transport for the longer segment of their commute. c. Improved traffic operations if sufficient number of car owners shift to bicycling. d. Generate revenues for themselves through advertisements, and for public agencies through parking space sale/leases. e. By encouraging residents to cycle for commute or recreational purposes, bicycle sharing also promotes healthy communities. For example, the London bicycle sharing scheme has provided significant health benefits such as reductions in heart diseases in men and depression in women (Woodcock 2014). The transport planning best practices presented in this chapter have the potential to transform the proposed IIT into a truly smart and sustainable city. Traffic calming measures like raised crosswalks and modern design concept like Complete Streets will enhance pedestrian safety and in turn encourage more walk trips. Other measures such as BRT, Circulator, Car share and Bicycle share will result in creation of an integrated and seamless transport network for residents and employees of the proposed IIT. a. Bicycle Share Similar to Car share, bicycle sharing is also gaining ground in numerous countries such as the USA, the UK, China and India. Under this scheme, private companies construct compact parking stations with a fleet of high performance (low 4-23


74 4.6 Utilities Bench Marking and Best Practices water supply from the unorthodox sources of rainwater collection (20%), recycled water (30%) and desalination (10%). The long-term plan is to become entirely self-sufficient in water Water and Waste Water Rainwater collection: Currently the city gets 20% of its water supply from rainwater collected in reservoirs and catchments. Two-thirds of Singapore s surface area is classified as protected drainage basins, with regulated land use which facilitates the collection of rainwater Singapore Stockholm Tianjin Almost all the best practice around the world related to water management underline the importance of recycling waste water and dedicating as usable, thus bringing down the demand. Treated wastewater that would have been discarded in a conventional system of water management is aggressively utilized in residential and industrial areas as recycled water. Branding recycled water: In 2002, the city opened its first production plant for recycled water, which currently provides 30% of the city's water supply.singapore has developed a new technique for recycling wastewater: a four-stage treatment process (conventional treatment, micro-filtration, reverse osmosis and UV treatment), branded NEWater. This water is drinkable, and is distributed to the city s drinking water reservoirs, but most of it is utilised in industry. Today Singapore has five NEWater plants. A deep, 50-km pump-free sewage system is under construction to provide these five plants with wastewater. A conceptual diagram of the intelligent water system as a new means of producing water is shown in the figure below. Sustainable water management: It is the goal of Singapore to become self-sufficient, with 40% of water from recycling, 30% from desalination, and 20% from rainwater collection. Well on the way to achieving this goal, the city has now broadened its views on water management with an ambitious plan for sustainable water management called ABC Waters (Active, Beautiful, Clean), from The vision is to integrate water management more closely with the urban environment, and the plan includes more than 100 projects for the next 10 years. One example is the Marina Bay, which in addition to providing fresh water, also functions as a green area for recreational activities Sino-Singapore Tianjin Eco-city The Eco-city site is located 40 km from the Tianjin city centre and 150 km from Beijing. The Eco-city is sited on non-arable land. The master plan of Sino-Singapore Tianjin Eco-city was jointly developed by the China Academy of Urban Planning and Design, the Tianjin Urban Planning and Design Institute, and the Singapore planning team led by the Urban Redevelopment Authority of Singapore. Figure 4-43 Conceptual Intelligent Water System In addition, the operational data from each water/waste water treatment plant is managed centrally as water infrastructure information, thereby enabling efficient operation of each facility Figure 4-42: Water Management Loop, Singapore Singapore water management Singapore has become a world leader in water management firstly because of its location as a densely populated city-state on an island lacking freshwater lakes. Thanks to the award-winning holistic work of its public utilities agency, the city currently receives more than half of its Demand Control: With campaigns and economic incentives per capita water consumption is continuously being reduced and is now down to 155 litres per person per day. The 5% loss through water spillage is among the lowest in the world. The master plan intends at development around a central core of conserved ecological wetlands and rehabilitated water bodies. The main centre of the Eco-city is located on the southern bank of a historical thousand-year-old river course, which has been planned for a variety of uses, including commercial, cultural and recreational ones. A comprehensive green transport network, i.e., non-motorised and public transport, is developed along with a light rail transit system serving as the main mode of transport. 4-24
75 Green spaces are interspersed throughout the city. Located in an area of low rainfall, the Eco-city draws a significant part of its water supply from non-traditional sources such as desalinated water. Consume less water. Integrated waste management is to be implemented in the Eco-city, with particular emphasis on the reduction, reuse and recycling of waste. Recover residual materials. Key Performance Indicators: 26 Key Performance Indicators (KPIs) conforming to national standards in China and Singapore, as well as international standards for the Tianjin Eco-city are listed below. Quality of Water from Taps - Water from all taps should be potable. Usage of Water from Non-Traditional Sources - At least 50% of the Eco-city s water supply will be from non-traditional sources such as desalination and recycled water by Usage of Renewable Energy - Renewable energy should account for at least 15% of the energy utilized in the Eco-city by Possible sources of renewable energy for the Eco-city include geothermal energy, hydropower and solar power. Carbon Emission Per Unit GDP - The carbon emission per unit GDP in the Eco-city should not exceed 150 tonne-c per US$1 million. Make Montréal a leader in the green economy. Improve our green infrastructures. Ambient Air Quality - The air quality in the Eco-city should meet at least China s National Ambient Air Quality Grade II Standard for at least 310 days Reliable Water supply on 24X7 basis 100% recycle of reclaimed water Dual piping system (Potable and non potable) Equitable water distribution Minimized NRW/ UFW Energy efficient pumps and motors Optimized design of pumping main Optimized design distribution system 100% meter connection Smart metering Complete automation using SCADA system Quality of water meeting WHO/IS10500 standards Singapore, Masdar City, Abu Dhabi Stockholm, Sweden Tianjin, China ii. Waste water System 100% connection to sewer network Optimized design of trunk sewer network Advance Treatment process (Sequential Batch Reactor) 100% Recycle of reclaimed water Energy efficient pumps and motors Singapore, Masdar City, Abu Dhabi Stockholm, Sweden Tianjin, China The city committed to reducing potable water production by 15% by 2015 compared with To achieve the objective: Montréal, in cooperation with the Montréal community, commits to: Reducing water loss by locating and repairing breaks in the underground aqueduct infrastructure and controlling illegal use. Indexing water consumption by sector of activity by performing sampling by type of activity to establish effective consumption targets. Improving the efficient use of potable water by promoting the sale and installation of water efficient devices among key players in the distribution, construction and real estate management sectors. Raising awareness among citizens about the importance of protecting this resource. Montréal, Canada Benchmarking and case studies International Examples i. Water Supply System The amount of potable water produced per person in Montréal is high compared with other major North American cities.the main explanations for this high level of production are the poor condition of the aqueduct network and defective, non-compliant equipment in many industries, businesses and institutions. Barrier-Free Accessibility - The Eco-city should have 100% barrier-free access. Proportion of Affordable Public Housing - At least 20% of housing in the Eco-city will be in the form of subsidised public housing by Infrastructure Utilities International Benchmarking and Best Practices Adopted Increase the number of environmental certifications. Proportion of Green Buildings - All buildings in the Eco-city should meet green building standards. Green Transportation - At least 90% of trips within the Eco-city should be in the form of green trips by Green trips refer to trips via nonmotorised transport, i.e. cycling and walking, as well as trips on public transport. Table 4-8: International Benchmarking considered for IIT Water & Waste Water Improve the quality of runoff water. Montréal is a city on a human scale, proud and respectful of its heritage, where everyone contributes to creating a vibrant, prosperous, united, viable and democratic community. Montréal, its citizens and the institutional leaders of the community are making sustainable development a priority. Objectives: Figure 4-44: Reduction in Water Demand - Montréal Reduce greenhouse gas emissions. Improve air quality. Keep families in Montréal. 4-25
 Allowing water to soak into the")

.")
76 4.6.2 Storm Water & Drainage Sustainable Urban Drainage System (SUDS) is an innovative, ecosystem-based approach to land development and storm water management. The key principle that influence the planning and design process enabling SUDS to mimic natural drainage by: Storing runoff and releasing it slowly (attenuation) Allowing water to soak into the ground (infiltration) Slowly transporting (conveying) water on the surface Filtering out pollutants Allowing sediments to settle out by controlling the flow of the water A key objective in SUDS is designing a landscape so that the movement, treatment, and storage of storm water are similar to what occurs on a natural landscape. Design involves the preservation of natural areas, especially those in low-lying places that naturally collect storm water, and the grading of the landscape to disperse runoff from roofs, roads, and parking areas into existing natural areas or specially planted areas (called rain gardens or bioretention areas). In areas where pavement is required, strategies are used to minimize the area of pavement, and, in some cases, to use permeable paving materials that allow storm water to infiltrate into the ground Riverside Place, Riverside Court, Stamford Riverside Court was the re-development of an electricity sub-station comprising of high density urban housing around two loosely defined courts. These open directly onto shared pedestrian and vehicular space with an access street entering under an arch from Wharf Road. The idea of betterment has resulted in an increased rate of runoff justified on the grounds that stored water is best released before flood water enters Stamford from the wolds higher up in the catchment. The SUDS technique used are Permeable paving Rills and canals. Permeable paving sometimes augmented by shallow geocellular storage The following benefits of SUDS were highlighted through this scheme: Design interaction with sympathetic professionals can deliver exciting schemes Permeable pavement can deliver a source of clean water for amenity features such as canals, rills and other water features with negligible land take. Permeable pavement can be rehabilitated after siltation on the surface and performs well in heavy rainfall An urban design approach delivers high quality urban landscape Flexibility in design delivers exciting and easily maintained urban space Florida Aquarium Parking Lot, Tampa The study site is a parking lot at the Florida Aquarium in Tampa, Florida. The study uses the entire parking area, 4.65 ha, to define the drainage basin. The parking lot was modified for the study by reducing the length of each parking space by 61 centimetres, which allows for a 122-cm wide grass swale between rows. The vehicle front end now hangs over a grass swale instead of pavement, which prevented any reduction in the number of parking spaces within the parking area. Four different scenarios were investigated to determine the most efficient method of runoff reduction and pollutant removal. Eight basins, two of each type, were constructed and fitted with instrumentation to collect flow weighted water quality samples and measure discharge amounts during storm events. The four treatment types are: Lords View Logistics Park Lords View has been planned as an environmentally friendly and ecosensitive industrial and logistics park. This is reflected in: Benefits & Achievements: Centrally landscaped storm water reticulation for irrigation purposes, will reduce the potential impact of new developments with respect to storm water drainage discharges On-site storm-water management and waste management, The advantage of centralised stormwater attenuation at Lords View Industrial Park will mean that property owners will not be required to attenuate stormwater on their specific sites, thereby optimising savings in terms of site utilisation. Asphalt paving with no swale Asphalt paving with a swale Cement paving with a swale Permeable pavement with a swale Table 4-9: International Benchmarking considered for IIT- Storm Water Drainage Infrastructure Utilities Storm Water drainage System International Benchmarking and Best Practices Adopted Benchmarking and case studies International Examples Sustainable Urban Drainage System(SUDS) o Source Control Lords View Logistics Park, South Africa Riverside Place, Stamford, Florida Aquarium Parking Lot, Tampa o Infiltration o Swales & Pond Figure 4-46: Permeable Pavements & Rain-garden Figure 4-45: Centrally landscaped storm water 4-26


77 4.6.3 Solid Waste Management Some of the forerunner cities which have initiated various strategies to cater the major issue of waste management are listed in following sections. With synchronizing their vision with growth and zero waste, they have achieved a sustainable waste management with almost no waste for dumping Case Studies from Different Cities Climate Smart Waste Management Reducing GHGs and Growing New York's Economy The GHG Cost of Solid Waste No material is a "waste" until it is destined for a landfill or other disposal. Until then, every product or item is a resource that has value and potential for other uses. This value has been added during all the steps in the product's life cycle - from raw material extraction and delivery, through manufacturing and distribution. When products are consigned to landfills or combusted, all the raw materials and most of the energy that went into making them are lost. Land filling or combusting: in a landfill's anaerobic environment, decomposing organic materials give off methane, a greenhouse gas 22 times as potent as CO2; combusting landfill gas or wastes generates heat-trapping CO2 and nitrogen compounds, but overall GHG emissions from combusted waste are lower than from the same amount of waste left to decompose. Conserving Resources, Cutting GHGs Emissions (Waste Management Practices): The table below summarizes the types of waste management practices available to local communities, the GHG implications of each, and other benefits of each practice. The table begins with the most efficient practices, waste prevention and reuse, which emit the smallest amount of GHGs; practices that are more GHG-intensive follow. Replacing fossil fuels with low carbon systems (such as hydrogen or electric power) for transporting and handling waste would make any solid waste management practice more efficient and less polluting. Transportation and Handling: most solid waste management systems today collect, move and process large volumes of waste, using fossil fuelpowered vehicles and equipment that emit carbon dioxide (CO2), nitrous oxide (N2O) and methane (CH4). Save more than 280 trillion BTUs of energy each year-as much energy as is consumed by more than 2.6 million homes. Add as many as 67,000 jobs in the state by Reduce New York's GHG emissions by nearly 21 million metric tons annually. Beyond Waste targets a progressive reduction in the daily amount of municipal solid waste destined for disposal, from the current 4.1 pounds per person per day to 0.6 pounds by To accomplish this reduction, the plan focuses on increasing local solid waste management planning; expanded technical assistance, guidance, tools and funding would help address challenging planning issues. By adopting a mix of solid waste management practices that reduce waste and favour efficiency, leaving only limited residues for combustion or Landfilling, communities can minimize the tax dollars they spend for waste disposal, conserve materials and avoid GHG emissions. New York's Climate Smart Communities are taking the lead in testing and adopting efficient solid waste management. Industries and other private sector concerns that generate a large amount of waste can reap the same benefits from more efficient waste management practices. Most New York communities recycle some of their solid waste, but approximately four-fifths of it ends up in waste combustors or landfills. Their waste generation outpaces recycling: even increasingly efficient recycling programs cannot keep up with the flood of nonrecyclable products and packaging entering the waste stream. The most recent inventory of New York State's GHG emissions estimates that the system of solid waste disposal generates almost 4 percent (about 9.8 million tons) of the state's GHG emissions. For communities that have landfills within their borders, however, waste management accounts for a much higher percentage of total municipal GHG emissions. GHGs come primarily from two steps in the management of solid wastes: otherwise become waste can be more sustainably managed throughout the economy. The plan projects that this kind of materials management could: Material Management The way of the Future: In a materialsefficient economy Goods and services are designed to require much less virgin material Strategies are in place for materials efficiency and waste prevention in homes, businesses and institutions Promotion and support are widespread for materials conservation, recovery and efficiency A robust economy exists for secondary (recovered) materials The maximum amount of material is recovered from the waste stream A hybrid electric truck for collecting solid waste and recyclables proclaims the intent of the City of New Rochelle, a Climate Smart Community, to reduce GHG emissions from managing its solid waste. (Photo courtesy City of New Rochelle) With material resources used much more efficiently, New York will significantly reduce GHG emissions, resource depletion, energy use and pollution. Managing materials efficiently will help sustain the low-energy economy and provide good local jobs. Beyond Waste: A Sustainable Materials Management Strategy for New York: Achieving materials efficiency will require action by governments and the private sector. The recently-published state materials management strategy, Beyond Waste, begins New York's shift from "end-of-the-pipe" waste management to looking "upstream" at how materials that would 4-27

78 Leading by example is crucial in moving to efficient, GHG-reducing materials and waste management. The Town of North Hempstead involved all eleven school districts within its jurisdiction in a highly visible effort to increase recycling. (Photo courtesy of the Town of North Hempstead) Table 4-10 Sustainable Waste Management Practices Solid Waste Management Practice Examples GHG Outcome Waste prevention Avoid generating waste in the first place Avoids GHG emissions from transportation, handling and disposal of wastes not generated Reuse Redirect to new users items that still have value for their original purpose Usable wastes (e.g., clothing, furniture, building materials) given or sold to be used for their original purpose Avoids GHGs from virgin material extraction/delivery, from manufacturing/ distribution of new items, and from waste disposal Use waste paper for animal bedding, waste glass and tires for civil engineering applications; some preparation may be required Avoids GHG emissions from disposal and from virgin material extraction and manufacturing for new use; transport and preparation may emit some GHGs Avoids disposal cost and non-ghg pollutants, can save money for manufacturers by conserving raw materials Saves money for users of redirected materials, recovers material and energy value, avoids cost and non-ghg pollution from disposal Recovers material, energy value of waste; saves the cost of virgin material acquisition; reduces new user's cost and pollution Add recycling in new venues (e.g., workplaces, public spaces, public events), Avoids GHGs from virgin material extraction/delivery; reduces GHG emissions from Avoids cost and non-ghg pollution from disposal, provides Redirect items with value for uses other than their original purpose Comprehensive recycling Include new materials and venues; expand participation & capture of targeted recyclables Other Benefits Product stewardship/ producer responsibility, Waste prevention incentives, Technical assistance Beneficial use Solid Waste Management Practice Recovery of waste organics Make nutrients in organic wastes available to people, soil organisms, plants Energy recovery Burn under controlled conditions waste materials that cannot be recycled, capturing combustion heat Best residual management Dispose of remaining Examples GHG Outcome Other Benefits recycle new materials, recruit new recycling participants, replace demolition with deconstruction disposal (transportation and separation are still necessary, but Landfilling or combusting is avoided) cheaper raw materials for manufacturers, sale of recovered materials can help pay for solid waste management Distribute excess prepared food to institutions or agricultural users; compost food scraps, nonrecyclable paper, yard debris; transport, some handling needed Avoids or reduces GHGs from disposal (in particular, methane from decomposition of organics in landfill), sequesters carbon in soil Properly equipped combustors can convert water into steam; steam used to heat buildings or generate electricity Recovers energy value from wastes; when substituted for fossil fuelled heat or power, eliminates that amount of fossil fuel CO2 Landfills with liners, leachate collection/remov al, best operating Decomposing wastes generate methane, a powerful GHG; Makes food available for people or animals, provides soilbuilding compost for landscaping and gardening, avoids or reduces disposal cost, avoids nonghg pollutants from disposal Burning at high temperatures destroys chemicals and diseasecausing bacteria; some combustion ash is used beneficially (e.g. cover in landfills) Methane combustion captures some energy value Solid Waste Management Practice wastes in a way that is environmentall y sound and sustainable Examples practices, groundwater monitoring, closure/post closure care, financial assurance, gas recovery GHG Outcome Other Benefits capturing and combusting for power generation destroys methane and can avoid some fossil fuel use but still emits CO2 from landfilled wastes; nondegradable wastes remain available for future recovery The Sino-Singapore Tianjin Eco-City, Singapore The Sino-Singapore Tianjin Eco-city is the result of a collaborative agreement between the governments of China and Singapore to jointly develop a socially harmonious, environmentally friendly and resourceconserving city in China Effective Waste Management & Recycling: To promote effective waste management, residents will be encouraged to sort their waste into categories. Recyclable waste will be sent to recycling stations located within the Eco-City. Non-recyclable waste will be collected via a Pneumatic Waste Collection System and incinerated to generate electricity. With increasing concerns over greenhouse gas emissions and the effects of climate change, the concept of eco-cities as a model of sustainable development has gained traction, of which the Tianjin Eco-City project is one prominent example. Singapore s reputation as a clean green city in Asia, together with its track record of close collaboration with China, made it a suitable partner for this undertaking 4-28


, and sensors on streetlights that detect movement and adjust the illumination accordingly.")
 has worked closely with the Eco-City Administrative Committee (ECAC) to develop an integrated environmental and waste quality monitoring system for the")
79 Regarding the concept of Smart City thanks to its strategy based on a transformational vision of the city on a long-term. It has an objective to become a self-sufficient city of productive neighbourhoods, human speed, in a hipper connected metropolis with no emissions. This city evolution strategy is focused to guarantee the citizen living quality, social and urban improvement, trying to add value to the neighbourhoods, encouraging all its urban potential in the sustainable development and green economy. This vision encompasses projects of different areas, thanks to technology and innovation. It pretends to achieve an improvement in the services that the City council provides to the citizens as well as a better management and general knowledge of the city. (minimizing driving time and emissions), and sensors on streetlights that detect movement and adjust the illumination accordingly. This is an initiative to allow Sant Cugat and its residents to save money, be more efficient, reduce their environmental footprint, and illustrate the potential of smart cities. Singapore s National Environment Agency (NEA) has worked closely with the Eco-City Administrative Committee (ECAC) to develop an integrated environmental and waste quality monitoring system for the Eco-City. NEA is also working with the ECAC to ensure that Eco-City's various environmental-related KPIs, such as treatment of hazardous waste, noise pollution levels, ambient air quality, carbon emissions level, per capita domestic waste generated and overall recycling rate, are met. The Waste Statistics for Singapore is given in figure below: Barcelona collaborates to international level with numerous institutions and other cities with the aim to find solutions to the city challenges of today and it is widely thoughtful for these; a reference in Smart Cities. Barcelona developed the urban platform in 2013 as a new ICT architecture that provides a single, transversal platform that interconnects the entire city. The project was proposed to create a sustainable city model that can manage different resources in an efficient way, including water, public services, temperature regulation, CO2 emissions, civil works, humidity and energy efficiency. The platform has three components; Sentilo (raw source data), City OS (intelligence component) and Applications (City Council and third parties as output information providers). Thanks to the use of an intelligent process engine that connects different events in real time, emergency situations can be anticipated and responses from different services coordinated in a more efficient and expedited way. ICT is key to reaching this goal as it enables the city to manage resources efficiently and reduce the impact of urban infrastructure on the environment. With the urban platform, the city can also capture information in real time, allowing for quicker decision making and response times. The result is a more sustainable, resilient city. Selective pneumatic waste-collection network: Differentiates between organic and inorganic waste and paper. Jointly applied for a European project on intelligent automated urban waste collection. The urban platform installation will help the city save energy and reduce pollution thanks to sensors monitoring water levels for irrigation, garbage containers, parking, people flow, energy efficiency in city buildings, civil works, etc. Moreover, the intelligence processes engine will make it possible to provide contingency plans for situations such as heavy snow or urban flooding. Cost reduction will also be achieved by the deployment and maintenance of sensors and processes that deliver information using a unified directory, thereby minimizing duplicity of data and infrastructure. Smart Sensors in Waste management: Figure 4-47: Waste Statistics for Singapore Barcelona Smart City The Barcelona Smart City model identifies 12 areas under which Smart City projects are initiated: environmental, ICT, mobility, water, energy, matter (waste), nature, built domain, public space, open government, information flows, and services. Sensors installed inside containers to monitor the fill level. This data is sent in real time to a control centre, which enables optimal management of collection. EV (Electric Vehicles) charging stations, sensors on trash and recycling bins to minimize costs and the environmental footprint for city waste and recycling collectors, water sensors in parks to ensure water is used more intelligently, sensors in parking areas to indicate empty spaces Building the Bridge to the Future, New Sangdo City, South Korea New Songdo City s origins are clearly rooted in the business hub strategy, especially South Korea s recognition of its economic vulnerabilities and advantages within globalization s maturing regime of neo-liberalism. The Ministry of Finance and Economy understood that South Korea s model for economic growth was encountering a process of deindustrialization and needed reform to be competitive with Japan and contend with China s emergence as a global economic power. A key part 4-29


80 of the strategy was to entice corporations to set up offices in South Korea by creating an optimal living environment, including world-class educational and medical facilities demanded by foreign nationals. have garbage chutes which feed into a central dump beneath the basement where heat energy from the waste is captured and reused to heat the buildings. There are currently five garbage processing facilities in the Sangdo area, all of which are low-profile, inconspicuous buildings that give off no smell. These five facilities recycle 76.3% of their waste. Songdo international city aims to recycle all resources, including water, carbon, and waste. By 2020, the city plans to reuse 40% of its sewage by sending it to be processed and sanitized rather dumping it. These actions will help reach the goal of reducing carbon monoxide emissions by 26,500 tons and saving about $44 million in water and waste cost for the city. Designed as a low-carbon, eco-friendly city, New Songdo City has abundant green areas and high-technology waste management systems. New Songdo City hosts a vibrant, rapidly growing international community. With outstanding public security, the GCF and its staff will enjoy a safe living environment. Easy access to well-equipped hospitals providing specialized services for foreign patients, and abundant leisure and cultural facilities are also available. Conveniently located within the Seoul metropolitan area, New Songdo City is only 20 minutes from Incheon Airport, connecting it to 182 international cities. Proximity to 101 embassies will keep the GCF and its staff close to the diplomatic community and the children of the GCF will have access to 16 international schools as well. The city's location also provides convenient access to Korea's financial infrastructure and trained personnel. Manage their properties and infrastructure in ways that cut carbon emissions created by the use of energy Reduce the amount of general waste produced in every aspect of their operations and segregate and divert as much as possible from landfill for reuse/ recycling or energy recovery Reduce the use of natural resources and source recycled material when available The citywide information network enables TelePresence to connect apartments, offices and schools through video. In Sangdo, video conferencing compliments the delivery of education, health care and government services. The same network also regulates electricity and water use in all the buildings, effectively cutting operational costs and curbing waste Canary Wharf, Developing Sustainable Communities, London Construction of Canary Wharf, one of the biggest and most successful initiatives of its kind in Europe began in It kick-started regeneration across London s Docklands. Just over two decades later, and have transformed previously derelict areas into more than 16 million square feet of office, retail and leisure space creating a world-famous business and shopping district in central London. Throughout this process, Canary Wharf has sought to enhance the environmental, social and economic well-being of the local communities in which it operate. This report outlines the 2012 progress in meeting this commitment. Vision of New Sangdo city: Reduce carbon emissions to 38% below BAU levels by It has built and managed working environments. It aims to carry out those responsibilities in ways that are safe and sustainable with minimal negative impact on the wider world. This involves careful management of construction, energy use and carbon emissions, water use, waste disposal and recycling and transport. When Canary Wharf was originally planned and its first buildings opened almost a quarter of a century ago, the project demonstrated the latest thinking and technology related to energy use. Times have changed. So has Canary Wharf Group. Now, more efficient and creative management of energy and the reduction of carbon emissions are among the most important business priorities. It is what all of the stakeholders, including shareholders, tenants, local communities and employees, rightly expect of them. Achieve the goals of reusing 40% of waste water and 76% of waste. Waste Management Strategy for New Sangdo City: Despite being a very urban environment, Sangdo international city was planned to be a green city since its initial conception. The city was designed to use clean energy sources to reduce greenhouse gas emission and the Central Park has been designed with truck-free garbage disposal system. The city will become a model example for implementation of waste management in a metropolis. Strategies for Waste Management: With over 70 restaurants, cafes and bars, Canary Wharf is as much a food destination as it is a business district. Inevitably, this has a bearing on waste as well as waists. To keep the former under control, in 2012 they decided to expand a pilot programme launched in Jubilee Place Sangdo is known for its innovation system for trash removal. Trash is directly deposited from the home through an autonomous system which can be used as a model for other cities. Apartments and office buildings Vision Canary Wharf City: 4-30
, with nearly 20,000 citizens trading their recyclable solid waste, adding up to approximately 151,000 tons of material")


 412 2,979 492 % Combustion 28% 56% 79% Anerobic Digestion (tonnes) 51 274 0 % Anerobic Digestion 3% 5% 0% Compost (tonnes) 0 0 83 % Compost 0% 0% 13% Landfill (tonnes) 0 0 0 % Landfill 0% 0%")
81 Although the project does not include major recycling targets or CO2 emissions reduction projections, it has yielded significant results on a small scale. In 2013, 12 editions of the barter market were conducted (one every month), with nearly 20,000 citizens trading their recyclable solid waste, adding up to approximately 151,000 tons of material across all categories. Shopping Mall in 2011 which saw an increase of overall recycling there from 16% to 60%. Moreover, thanks to a switch in recycling technique from composting to anaerobic digestion, waste food from Canary Wharf was used to fuel generators that feed power back to the National Grid. For the office buildings they manage, 72% of waste was recycled, beating the target of 70% for One reason for the overall success of recycling in the buildings managed is the fact that they make recycling easy and convenient for tenants, visitors and for their own people. Every office and retail outlet has either a two or three bin system: one for mixed recyclable waste, one for non-recyclable waste and a third for food waste, where appropriate. Oil used in Canary Wharf restaurants is recycled as bio-fuel. Table 4-11 Waste Management Office Buildings Total Waste (tonnes) 1,491 Retail Buildings Infrastructure 5, Disposal Methods Recycled (tonnes) 1,027 2, % Recycled 69% 39% 9% Combustion (tonnes) 412 2, % Combustion 28% 56% 79% Anerobic Digestion (tonnes) % Anerobic Digestion 3% 5% 0% Compost (tonnes) % Compost 0% 0% 13% Landfill (tonnes) % Landfill 0% 0% 0% The achievements: In 2012, they recycled more than 72% of the waste in their office buildings. They manage all the waste from public areas, retail units and office tenants In 2013, they have aim to expand their food recycling programme. They will also aim to recycle at least 40% of their infrastructure waste and 60% of the waste generated by their retail tenants. The main environmental goal of this project is to divert valuable recyclable waste from final disposal in landfills, but it is also expected to bring significant co-benefits: Mexico City, Barter Market Project In March 2012, Mexico City s administration initiated a barter market project to trade clean and separated household solid waste recyclables for locally produced agricultural products. The overall objective of the barter market is to build an educational program promoting a culture of recycling and local consumption among the population of Mexico City. There was a definite need for this kind of action. With about 12,500 tons of municipal solid waste generated per day ending up in landfills, the City created the barter market to explore sustainable alternatives to Landfilling, as well as develop and maintain a culture of waste minimization and recycling. Additionally, there is a growing need to provide support to local producers and traditional forms of agriculture in the rural areas of Mexico City. The barter market takes place once a month on a Sunday morning in public places such as parks or plazas. The market is itinerant in order to gradually cover the different boroughs of Mexico City. Each citizen can trade up to 10 kilograms of waste per market day in one or more category of valuable recyclable, which currently includes paper, cardboard, PET, glass, tetra-pack, aluminium and tin cans and electronic waste. The agricultural products traded are grown by local producers in the rural areas of Mexico City and range from fruits and vegetables, to plants and homemade jams. The barter market has developed strategic partnerships with 80 local producers and several recycling companies that are responsible for collecting the waste gathered during the event and transporting it to recycling facilities. Health benefits: The products traded at barter markets are good quality and contribute to the fight against malnutrition, a recurrent health issue in Mexico. Economic and social benefits: The market not only benefits local agricultural producers, who receive subsidies from the City in the trading process, it also benefits the private waste industry by generating jobs in recollecting and reusing valuable recyclables traded on market days Buenos Aires, Solid Waste Reduction Project An estimated 3 million people live in Buenos Aires a number that doubles during the day with the influx of commuters generating more than 6,000 tonnes of waste per day. The city faces the twofold problem of a large solid waste load and limited capacity to absorb waste in landfills. There is little available free land for the construction of Solid Urban Waste (SUW) treatment plants, and the installation of landfills inside the territory of the City of Buenos Aires is also unfeasible. Therefore, the Solid Urban Waste Reduction Project aims to reduce the amount of SUW sent to landfills, guaranteeing a prior treatment of 100% of waste. This will be accomplished through waste separation at origin, recovery, recycling and valorisation, as well as measures ranging from infrastructure development including the opening of new treatment plants to awareness campaigns, aimed at holding both citizens and businesses accountable for their waste. 4-31

82 One of the central elements of the plan is SUW separation at the source, which explains the key role played by citizens. The city s administration is currently implementing an intensive awareness campaign to educate citizens children and adults on how to sort, separate and deposit waste correctly. As of January 2014, there has been a 44% reduction in waste sent to landfills compared with the previous year. Progress has been made in containerization and lateral collection of SUW in order to avoid garbage bags on the streets, mitigate smell and improve the street s aesthetics. Waste transfer stations have been installed, which has had a positive impact in CO2 reduction generated by transportation. The City has also launched Green Centers for recyclable materials, arid waste and pruning residue, and installed a Mechanical Biological Treatment (MBT) plant. There are two major environmental goals for this project: to treat 100% of waste prior to being sent to landfills, and to reduce overall waste sent to landfills by 83% by 2017, with the recycling rate expected to reach 68% by the end of the project. The project has also been designed to generate new employment opportunities and foster greater social participation and transparency in the waste and recycling chain. Thus far, 4,500 urban recoverer jobs have been created, with 2,000 more expected, in a sustained effort to create long-term formal employment growth The Kista Science City, Stockholm, Sweden To achieve the City s environmental goals, an efficient cooperation between inhabitants, the private industry, the public sector and many other players is crucial. Environmental and information technology are both key priorities in developing a sustainable society. Kista Science City is a creative melting pot in Stockholm where companies, researchers and students collaborate in order to develop and grow. The foremost sector in Kista is ICT (Information and Communication Technology). Figures show that few places on the planet can demonstrate the same high concentration of expertise, innovation and business opportunities within ICT. Explore the 3D-world for a deeper insight in what Kista Science City can offer people and their business. Green IT Strategy: Green IT is the collective name for the measures designed to improve their environment with the help of IT. It involves using information technology to reduce negative impact on the environment, as well as lowering the energy consumption and environmental impact of the IT sector as a whole. Efficient public services are key factors in a thriving city and they should be characterised by a common desire to prioritize citizens' different needs and desires. The city s responsibility is to provide support and facilitate in everyday life. Applying for permits, schools, elderly care or to plan the commuting rout to work, are just a few examples of popular e-services offered. Sweden s Waste Management Strategy: Due to Sweden s innovative waste-to-energy program and highly efficient recycling habits, the Scandinavian nation faces an interesting dilemma. They have run out of trash. Sweden s waste management and recycling programs are second to none as only four percent of the nation s waste ends up in landfills. By contrast, according to the U.S. Environmental Protection Agency, over half of the waste produced by U.S. households ends up in landfills. Because the Swedish manage waste so effectively and then use what remains to partly power their country, they are now living an environmentalist s dream; a shortage of garbage. conventional vehicle cause pollutions with large environmental impact and in the procurement process the city set specifications for requirements in terms of environmental standards collective vehicles and work machines. For example bio-fuel, tires, bio-degradable lubricants. The main stance of policy of waste collection is biogas and mechanised waste collection to decrease the transportation. But also to collect as much of the hazardous waste as possible, increase the recycling of material and reuse it so many times as possible to decrease the amount of virgin raw material but also the amount of fossil fuel by energy recover at the last step. The City of Stockholm needs all the heat and energy that is produced by the waste, there by nothing is placed on landfill. As waste management has developed towards less manual collection with safer workers environment and reduced environmental impact from waste collection and transportation, the City of Stockholm recommend Mechanical systems for waste collection. Mechanical waste collection system for solid waste and sorted waste fractions used and recommended are: Stationary and mobile vacuum suction systems, Large compacting containers and large containers partly underground Waste collection systems with waste grinders for food waste Waste Prevention & Reduction Program of Stockholm City: The Waste Management Administration in Stockholm is assigned to create an environmental friendly, cost-efficient and service minded waste management. Since the Stockholm citizens have a key role in reaching this goal, communication activities and customer guidance are two key activities for the Administration. The aim is to achieve increased confidence in the waste management system and to increase the number of customers who consider themselves well informed about waste management. Reduction of the amount of generated waste is one of the most important challenges within the environmental field and in accordance to the waste hierarchy; this is the primary environmental objective for waste management in the City of Stockholm. The city has small instrument to impact directly on the waste flows. To increase the awareness of the consumers the communication efforts should origin from the hierarchy of waste. The Stockholm Waste administration focuses on awareness of people residing in the city. They arrange Guide for source segregation, conferences, Educational Programs, dissemination and promotion of best practices, waste recycling be focussed etc to make their people fully understand. They have also issued certain bylaws and penetrate it to city council level for a robust waste management. The City of Stockholm is a stockpile organisation. That means all waste collection and treatment is purchased. Waste management with Figure 4-48: Mechanical waste collection, Stationary underground vacuum system Collection of Food Waste: To increase the collection and treatment of food waste, the Waste Administration will inform all restaurants in the city and invite them to rearrange their waste handling system towards separate collection of their high-quality food-waste. The information will be combined with a visit from the staff or external consults at restaurants that are interested to participate in the separate handling of food-waste. The city will also continue the work on initiating more food-waste treatment facilities. This will be done both by purchasing treatmentcapacity and establish new plants or increase capacity at e.g. wastewater treatment plants in the region or owned by the city. This work is both a short-term and a long-term. Short-term is preparing and sending out tenders for treatment of food-waste of different qualities and longterm is expanding permits for existing business or building new plants. 4-32
 The Integrated Solid Waste Management Plan is a comprehensive 10year plan aimed at reducing waste generation and improving overall waste")
. The City has a limited capacity to collect and treat waste, and in 2005 less than half (44%) of the waste produced in Dhaka was collected.")


83 Dhaka, Integrated Solid Waste management Plan (ISWMP) The Integrated Solid Waste Management Plan is a comprehensive 10year plan aimed at reducing waste generation and improving overall waste management in the Bangladeshi capital city of Dhaka. Like many fast-developing cities in the region, Dhaka is facing growth challenges (Greater Dhaka s population is expected to rise from 14.5 million in 2005 to 17 million by 2015). The City has a limited capacity to collect and treat waste, and in 2005 less than half (44%) of the waste produced in Dhaka was collected. This is partly due to a lack of awareness among local populations, who rely mainly on informal waste collectors (tokai), and partly because the Dhaka City Corporation (DCC) in charge of collection lacked the means and skills to set up an effective collection mechanism and a waste treatment policy that could recover materials through recycling Yokohama Smart City With a population of 3.7 million inhabitants, Yokohama is the second largest city in Japan. Rapid urbanization poses significant urban challenges in terms of energy use, traffic jams, and pollution, which have led to a significant increase in the volume of total greenhouse gas emissions. The Yokohama Smart City Project strives to achieve a better management of energy use and mitigate climate change. The Yokohama Smart City Project (YSCP) is an effort to develop a model for smart cities by means of cooperation between citizens, private companies, and the municipality, and to export the successful model to Japan and the rest of the world. Large-scale operational experiments are being held with Yokohama, a large, advanced city with a diverse topographical range of districts, as the stage. The hierarchical bundling of Energy Management Systems (EMS) enables energy management at the level of individual EMS and demand-side management at the level of the overall system. Yokohama Smart City Project (YSCP), an initiative to establish overseas expansion of Japan's smart grid, was selected as a Next Generation Energy Infrastructure and Social System Demonstration Area by the Ministry of Economy, Trade and Industry in April The ISWMP aims to manage municipal solid waste throughout its lifecycle, reduce greenhouse gas emissions, and encourage public and private sector participation. It is based on the improvement of three key operational items: Waste Reduction, Waste Collection and Waste Disposal, with a strong emphasis on raising public awareness and a significant upgrade of the existing collection assets and landfills. The connection between the Dhaka population and local authorities was a necessary condition for the success of the ISWMP. Indeed, the Clean Dhaka Master Plan is based on a ward-by-ward approach and strongly mobilizes local communities. The Clean Dhaka Award Competition exemplifies the communication strategies undertaken by both North and South administrations to mobilize citizen support. In addition, the tokai have been included in the new waste collection system: they will be in charge of collecting small containers dedicated to household recycling and will participate in awareness campaigns. Dhaka authorities hope to collect and treat at least 68% of the waste produced in the inner metropolitan area, which would mean an accumulated 180% increase in collection and final disposal efficiency in comparison to 2005 s 44% collection rate. The plan intends to reduce CO2e emissions mostly through the re-engineering and improvement of waste disposal sites. The re-engineering of the existing site of Matuail and the controlled landfill in Amin Bazar are projected to reduce emissions by an average of 99,000 tons of CO2e per year. The opening of a composting facility in Dhaka is also projected to reduce an average 177,000 tons of CO2e emissions per year. Specifically, will introduce HEMS for homes, BEMS for offices and commercial buildings, FEMS for factories, and EV and charging stations for the transport sector, and will curb peak energy demand and conserve energy through their mutual linkage. The City is collaborating with the private sector (Accenture, Tokyo Gas, Toshiba, Nissan Motor, Panasonic, Meidensha, TEPCO, etc.) to work on various projects such as introduction of renewable energy, energy management of households, buildings and local communities and next generation transportation systems. Four waste treatment plants are currently in operation in the City of Yokohama, including Tsurumi, Tsuzuki, Asahi and Kanazawa. Each plant recovers thermal energy from waste incineration by converting it into steam, which is then used in steam turbine generators or for heat supply to nearby facilities. City blocks which have a high demand for heat exist near some of the waste treatment plants. In this case, there is a good chance that constructing steam pipelines and supplying heat to the neighbouring high demand areas will be effective. The aim is to transform a city already provided with social infrastructure into a low-carbon city while maintaining the comfort of its residents. In order to do so, will introduce a CEMS and develop and operate energy management systems optimized for this specific region. Together with these efforts, will use PV generation and other forms of renewable energy, and work to change the way that citizens relate to energy. 4-33
84 Table 4-12: International Benchmarking considered for IIT- Solid Waste Management Sr. no City New York City The SinoSingapore Tianjin EcoCity, Singapore Barcelona Smart City New Sangdo City, South Korea Canary Wharf Best Practices Adopted The city has adopted the Material Efficient Economy, which has following elements: Goods and services are designed to require much less virgin material Strategies are in place for materials efficiency and waste prevention in homes, businesses and institutions Promotion and support are widespread for materials conservation, recovery and efficiency A robust economy exists for secondary (recovered) materials The maximum amount of material is recovered from the waste stream Residents are encouraged to sort their waste at source Non-recyclable wastes are collected pneumatically Incineration of waste to generate electricity National Environmental agency (NEA) of Singapore work closely with Eco-City Administrative Committee (ECAC) to monitor the waste management and environmental safeguards Barcelona collaborates to international level with numerous institutions and other cities with the aim to find solutions to the city challenges of today and it is widely thoughtful for these; a reference in Smart Cities. Barcelona developed the urban platform in 2013 as a new ICT architecture that provides a single, transversal platform that interconnects the entire city. EV (Electric Vehicles) charging stations, sensors on trash and recycling bins to minimize costs and the environmental footprint for city waste and recycling collectors Sangdo is known for its innovation system for trash removal. Trash is directly deposited from the home through an autonomous system. Apartments and office buildings have garbage chutes which feed into a central dump beneath the basement where heat energy from the waste is captured and reused to heat the buildings. There are currently five garbage processing facilities in the Sangdo area, all of which are lowprofile, inconspicuous buildings that give off no smell. Every office and retail outlet has either a two or three bin system: one for mixed recyclable waste, one for non-recyclable waste and a third for food Sr. no. City Best Practices Adopted Remarks The SWM Philosophy of New York city is shift from end of pipe treatment to looking upstream at how materials that would otherwise become waste can be more sustainably managed throughout the economy. The key points in Singapore waste management system is source segregation, waste to energy and Institutional arrangement. The system is similar to JAFZA of Dubai. As stated, Barcelona is a reference to smart city. The city has ICT Platform for centralized control of all services City has sensor based collection system and selective pneumatic system for waste collection Mexico City, Barter Market Project Buenos Aires, Solid Waste Reduction Project Autonomous system for waste processing for buildings is unique for Sangdo city. Dhaka, Integrated Solid Waste management Plan (ISWMP) Mexico City s administration initiated a barter market project to trade clean and separated household solid waste recyclables for locally produced agricultural products. The city s administration is currently implementing an intensive awareness campaign to educate The city has emphasis on citizens children and adults on how to sort, education and awareness for separate and deposit waste correctly. waste segregation and Waste transfer stations have been installed, which deposit. Centralized collection has had a positive impact in CO2 reduction centers for recyclable waste is generated by transportation. The City has also another innovative idea launched Green Centers for recyclable materials, towards sustainable waste arid waste and pruning residue, and installed a management in the city. Mechanical Biological Treatment (MBT) plant. The Kista city has highly Kista Science City is a creative melting pot in efficient system of collection, Stockholm where companies, researchers and transportation and treatment students collaborate in order to develop and grow. system for waste. The foremost sector in Kista is ICT (Information Their waste to energy and Communication Technology). programme is very efficient. Sweden s waste management and recycling Sweden s achievement to programs are second to none as only four percent restrict land filling <4% is of the nation s waste ends up in landfills. great achievement. The SWM Plan for Dhaka is The ISWMP of Dhaka city has plan for awareness more relied on revamping campaign for higher collection of segregated and re-engineering of waste and revamping the existing system of existing waste management waste collection and disposal. system. The aim is to transform a city already provided with social infrastructure into a low-carbon city The city is good example of collaboration of Technology while maintaining the comfort of its residents. In order to do so, will introduce a CEMS and develop providers. and operate energy management systems The waste to energy optimized for this specific region. programme of Yokohoma city Each plant recovers thermal energy from waste is for recovering heat from incineration by converting it into steam, which is waste and supplying heat to then used in steam turbine generators or for heat nearby areas. supply to nearby facilities. 10. Yokohama Smart City The city has achieved significantly high level of recycling and recovery of waste is achieved in Canary Wharf by providing facility for higher level of source segregation and convenience of recycling. The barter market system is quite sustainable way of recycling waste. It also works on the principle of ecology, where the waste is converted to manure given back to agriculture. Recycling of other waste to benefit the Rural market is also another way of economic sustainability of the neighboring areas. The Kista Science City, Stockholm, Sweden waste, where appropriate. Oil used in Canary Wharf restaurants is recycled as bio-fuel. Remarks 4-34
85 BEST PRACTISES Sr. No. Stage of Waste Handling Best Waste Management Strategies being Practiced Sustainable Waste Management While one of the key measures of a society s advance is the degree to which it can distance itself from its trash, waste is increasingly viewed as a strategic resource. In developed economies, tightening regulations around the disposal of waste and the increasing cost of land-filling are driving demand for innovative solutions across the municipal solid waste (MSW) value chain. In developing economies, the focus is on building out basic infrastructure in the face of rapid urbanization and rising levels of affluence. In all cases, emerging smart technologies offer the opportunity to enhance MSW collection, generate renewable energy, and optimize the environmental performance of landfills. The trend analyzes the global market for smart MSW technologies, with a focus on four segments: smart collection, smart processing, smart energy recovery, and smart disposal. Global market forecasts for the volume of MSW generated and managed globally and the revenue generated from the deployment of smart waste technologies, segmented by geography and smart waste segment, extend through next future. This report also examines key stakeholder initiatives, regulatory issues, market drivers, challenges, and technology developments and profiles the major stakeholders across the MSW value chain. 5 Waste Segregation at Transfer Station 6 Recycling of Waste Table 4-13: Best Waste Management Strategies being Practiced Sr. No Stage of Waste Handling Waste Quantification Best Waste Management Strategies being Practiced The waste quantification shall be done on the basis of national/ state laws and after studying trend of waste generation from different sectors In developed nations, waste management is people driven. The local people shall be encouraged for waste segregation at source. Basic study reveals that people in Singapore and other developed nations have adopted waste segregation at source and are focussed on waste reuse practices. Waste Segregation at Source The resident shall be encouraged to focus on waste reduction by different measures such as Think before Throw, optimal use of product and by Donating clothes and other products which may be useful for Economically weaker sections There are different collection processes being used by different nations. The aim of a robust collection system is to collect 100% of waste from source without any ambiguity. There are two prominent waste collection system as explained below, both have pros and cons as per the requirement: Door-to-Door Collection: It is a conventional method to collect waste from each and every individual household. The main alteration in this system is the application of RFID and GIS, so as to have real time data/ information of town at a central location. The kerbside bins are equipped with RFID unique system and have a central control. These bins are smart bins which send signals to the control centre using ICT services and thus making operation easy and hassle free. Automated Waste Collection System: This system is a pneumatic based system. The waste from source through dedicated chutes (Wet or Dry) used to get transported directly to the Transfer stations through underground pipelines. This system also encourage individual to practice source segregation. Waste Reduction 4 Waste Collection from Source to Intermediate Centrally Located Waste Facility (Transfer Stations) 7 Transportation of Inert/ Residual waste 8 Waste Disposal/ Treatment It is seen that the collected waste at CLWF are being segregated using modern technologies like metal separators. Also, in some countries, application of microbes has been seen to separate organic and inorganic waste. Mostly, the inorganic and organic wastes are segregated followed by other wastes like recyclable and non-recyclable wastes. The segregated waste then transported to different locations as per their characteristics like recyclable wastes to recycling centres and inert/ residual waste to the Landfill sites. It is one of the major pillar of 4Rs and a key for sustainable waste management. Every nation in today s scenario is focussed on waste recycling to its maximum extent. The segregated recyclable waste used to get transported in a closed GPS enabled trucks to material recovery centre. These waste then further segregated into different components vis-a-vis paper, plastic, glass, metals etc These waste shall be processed and transformed to some useful products After a thorough segregation of waste at Transfer station, about 6-8% of waste would be left out as residual in nature. It is because these wastes have no second use and can also not be degraded easily. An optimal route shall be chosen to transport these inert wastes to its final processing-cum-landfill site. It is recommended to use closed trucks and shall be equipped with GPS to have a real time tracking. The routes on GIS and GPS of trucks shall be integrated with ICT central control centre. The main aim of central control centre is to guide trucks to choose optimal routes so as to cut down fuel consumption and increase in efficiency of the overall system. It depends on the quantity of waste generated from city. If there would be high volume of waste, then it is preferable to install a Waste-toEnergy (WTE) plant within the project premises. It is optimal and efficient to plan WTE if waste generation would be in range of 150 or more. The WTE can be based on Refused-Derived Fuel/ Pyrolysis/ Incineration etc. It is recommended to treat organic waste separately using any compost based technology if the size of waste is on lower side and other inert waste to be sent to nearby Landfill site if there would be any. These inert wastes are to be processed further and can be used as a raw feed for WTE installed at Landfill site itself. The other waste which would have no use and have no adverse impact on land as well as on groundwater can be disposed off in a sanitary Landfill. 4-35
86 Sr. No. Stage of Waste Handling Table 4-14: Summary of Solid Waste Management Benchmarking of 8 Smart cities across the world Best Waste Management Strategies being Practiced Cities a) Waste-to-Energy Waste (Landfill) It will reduce the waste and in same time would generate energy which can be used in electricity generation. It is recommended that the waste quantity for WTE should be more enough to sustain the plant and generate the energy at same time. If the waste is on lower side, it would not be economically viable to invest huge capital on WTE. It would be best to utilize nearby Landfill site (for low waste quantity), if available with installed WTE plant. Barcelona The Kista Science City, Yokohama Sangdo Canary Wharf Stockholm, Smart City Sweden Buenos Aires Singapore New York Project Area (Sq. km) Population Density (persons/ha) % of Population Served 100% 100% 100% # 100% 100% 100% 100% 100% By compactor automatic trucks By compactor automatic trucks On time (By AWS) AWS By compactor automatic trucks By compactor automatic trucks By compactor automatic trucks By compactor automatic trucks Land disposal is the final stage of any nation for dealing with waste management. It is recommended to verify and quantify of waste being sent to landfill site for disposal so as to have trends and records of waste being dumped. This would also help in checking the efficiency of overall waste management. % ICT integration yes (100%) Not available yes (100%) yes (100%) Not available Yes Yes Not available % Incineration 38% 40% 14% 20% 30% -- 60% Not available % Waste to Energy same above Not available Not available Same as above -- 74% -do- Not available % Landfill/ Residual 3% 30% 14% 1% 10% 6% 10% 15% Recycling % 19% 20% 72% 76% ** 30% 2% 30% 75% Disposal The waste which even can have no or minimal impact on environment, shall be dumped in a sanitary landfill only. This will ensure 100% efficiency of system and also control leachate mixing with groundwater. A dedicated leachate treatment shall be installed within the landfill site so as to collect and treat the leachate generated beneath the ground due to anaerobic reaction in solid waste. Quantification of waste to be done in project so as to envisage waste generation on the basis on standard norms. No township/ city should process these waste without any consent of state pollution control board, if they are willing to process within their project area. As per prevalent Indian guidelines, these wastes are to be solely handled by authorized dealers/ vendors. The polluters shall collect the waste from their premises to a central location within their premises which shall be accessible to the vendors. The vendors/ dealers shall collect waste from each unit/ premises, on timely basis so as to reduce chaos and other social issues The treatment, processing and final disposal of waste shall be done by the vendors equipped with any WTE plants. Waste 9 Details Secondary Collection and Transportation Bio-Medical and It is a best method to reduce and reclaim the waste, which have no use and over burdening the Landfill. E-Waste/ Hazardous Waste as * Targetted # Partly AWS ** Combined figure for biomethanation & recycling $ target for
87 24 X 7 availability, Demand flexibility, High supply reliability, Available more space for plot owners use with the elimination of in-house chiller plant, Fewer constraints for creative building design and lower initial and operating costs. a) In Singapore, about 70% of electricity usage in commercial buildings is related to air-conditioning and two third of which in chilling plants. For example, Singapore District Cooling Pte Ltd (SDC) provides district cooling services to developments at the Marina Bay New Business District. It is a joint venture between Singapore Power and Dalkia, a French energy company. The success of implementation by SDC has elevated the energy efficiency for air conditioning with greater certainty and effectiveness Power There are following cities which have been considered for International Benchmarking: SINGAPORE 1) Reliable, quality power source and Reliable distribution network & Smart energy management and Smart power grid: a) Singapore relies completely on import for its energy needs. The power sector already has about 30% excess fossil-fired generation capacity till date. b) Singapore s key drivers (As indicated in an Intelligent Energy System Singapore s Smart Grid Initiative) are: a. Establish two-way data communication Metering Infrastructure (AMI). by Advanced 4) Enable the management of Distributed Energy Resources including renewable generation. d. Enable the integration of new initiatives such as Electric Vehicles. e. Integration of new Outage Management System (OMS) to enhance management of power outage,24 x 7 monitor & control, outage detection and supply restoration. 2) b) Despite these challenges, according to a new white paper launched by industry experts in January 2014, renewable energy could meet about 7.3 percent of Singapore's current peak power demand by The paper notes that solar, biomass, and biogas power generation is already viable in Singapore c) Sino-Singapore Tianjin Eco-city is one small city of Singapore.This city has target to generate minimum 20% renewable energy by Possible sources of renewable energy for the Eco-city are geothermal energy, hydropower and solar power. District heating and cooling system: District heating and cooling is an energy and economically efficient urban utility service.district cooling services presents attractive value propositions to building owners due to many advantages: 1) 2) ii. iii. iv. v. vi. vii %20Singapore%20Smart%20Grid%20Pilot.pdf- An Intelligent Energy SystemSingapore s Smart Grid Initiative en.wikipedia.org/wiki/sino-singapore_tianjin_eco-citysino-singapore Tianjin Eco-city - Wikipedia, the free encyclopedia arget=navurl://803c9f39dd045469c58bb8ecb9ca2029&wi ndowid=wid Singapore district cooling system ntent/sites/singapore%20district%20cooling/site%20co ntent/overview/documents/dcs%20paper%20(jun%20 10).pdf Singapore district cooling system - The future of Singapore's renewable energy Asian Power Electric vehicle charging stations Renewable energy generation and integration: As indicated in Endesa' Smart city plan for Barcelona, the city will adopt solar based power to introduce solar -powered building, efficient lighting, monitoring and linking renewable energies to the grid, micro grids, etc. In 2000 the city began requiring that 60% of hot water heating in all new and renovated big buildings be derived from solar panels The ordinance applies to both public and private buildings, and in 2006 was extended to smaller buildings. In addition, Barcelona in 2002 adopted an energy plan that among other things led to installations of solar PV panels on public buildings. It required all commercial buildings with a roof surface area over 3,500 square meters must produce 10 percent of their electricity consumption with PV, and office buildings with a minimum surface of 1,500 square meters must produce 12 percent of their electricity consumption with PV. References: i. Power Supply Source: The 527MW contracted power demand will be meet by seven substations, 85 medium-voltage lines, 568 distribution centres. Electric vehicles: Renewable energy generation and integration: a) Due to geographic constraints, like the lack of space and the absence of strong winds, Singapore has very limited potential to deploy any renewable energy resources, apart from solar photovoltaic, biomass, and waste. 3) 5) BARCELONA, SPAIN Barcelona is famous for Gaudí s modernist architecture and its worldclass Picasso museum, Barcelona s solar energy regulations have become a model for other municipalities, with more than 70 Spanish municipalities following the city s example. a) Since 2011, the authorities have been studying the feasibility of electric vehicles on Singapore roads, with the data from the first phase of a test-bed currently under review. Singapore authority has asked consultants to study the gaps in technology, implementation issues of installing charging infrastructure as well as an assessment of the energy savings and carbon emissions levels with the adoption of green vehicles.currently,singapore has 71 charging stations for electric vehicles. b. Singapore s target was to deploy 4500 smart meters in phase-1 by c ) Smart meters: a) The city is planning to install over one million new, cutting-edge smart meters throughout the city providing customers with greater knowledge about their consumption and allowing them to optimise their energy use. These systems will help customers adapt and plan their consumption, leading to greater savings as well as helping reduce emissions of greenhouse gases such as CO2 or NOx. b) In the first phase these upgrades will directly benefit 50,000 customers in Barcelona as well as the overall development of the city indirectly. 4) Smart external lighting system: a) Barcelona is planning to introduce LEDs for better efficiency, safety and lower intrusive lighting. (As indicated in Endesa s Smart city plan for Barcelona). And to further reduce the City s electric bill, Barcelona is retrofitting its streetlights with LED bulbs that run on motion sensors, with a goal of having 3,360 efficient street lamps on 160 streets by These wireless street lamps are expected to decrease the city s municipal power bill by a third. 4-37
88 5) 6) Barcelona energy demand is reduced by 30% and greenhouse gas emissions by 31% (equivalant to around 1,400 tons of CO2 till 2004) by considering district cooling system. New Songdo City has abundant green areas and high-technology waste management systems and designed as a low-carbon, eco-friendly city. Smart street lighting system, sensors to monitor temperature, energy efficient pumps, motors and approx. 80 percent LEED certified buildings are considered to save energy in Songdo.The total energy use in Songdo is on average 40% lower than any existing city of comparable scale. Electric-vehicles: a) The city has a fleet of vehicles operating on natural gas and hybrid fuel. However, it is testing pure electric vehicles presently and have created the country s first electric vehicle fast recharge point in the 22@ Innovation District. 7) References: i. ii ) incipalesproyectos/barcelona_smartcity Barcelona: Spain's city of the sun : Renew Economyreneweconomy.com.au/2014/barcelona-spains-city-ofthe-sun ) 3) Smart energy management with smart meters: Songdo targeted to accommodate 15,000 smart homes, 65,000 residents by ) Smart External lighting: Energy efficient LED traffic lights are planned for installation throughout Songdo. Street lights can be switched off in deserted streets to save energy or brightened in busy ones. 5) Electric-vehicles: a) Electric charging stations have been provided. 4) Energy storage: a) Cannes is following the European Commission Goal setting for 2030 on Energy issues including reducing emissions by 20%, Increase use of renewable energy, improving the energy efficiencies, and smarten the energy uses among others. 5) References: i. - The 2030 energy targets: What challenges for innovation. Renewable energy generation and integration: Songdo IBD is designed as per the latest design standards and technologies and sustainable design practices to reduce energy consumption, increase energy efficiency, utilize recycled and natural materials and generate clean or renewable electricity. 3) Smart lighting: a) Energy efficient lightings such as compact flourescent or LED are used in houses to reduce energy. Reliable and quality power source: A central, city-wide cogeneration facility fueled by natural gas will provide clean power and hot water to the project. The I-Tower of Songdo city is an eco-friendly building.the building is equipped with renewable energy facilities such as photovoltaic panels, solar water heaters, and geothermal heating systems.led lightings are installed throughout the building and the building has achieved the highest grade in domestic energy efficiency standards. CANNES, FRANCE Smart energy management with smart meters: Intelligent energy metering and micro grids, giving access to local forms of power solar, geothermal or combined heat and power and giving consumers real control over their energy use, Smart urban networks linking power generation. SONGDO, SOUTH KOREA iv. v. vi. 1) Cannes is today one of the global capitals of tourism and business trips. The various developments have been done in this city: 1) iii. District heating and cooling system 6) Electric-vehicles: Electrical vehicle charging stations will be integrated into parking garage designs to facilitate the transition to low emissions transportation. 5 % of the parking spots will be reserved for low-emissions vehicles with an additional 5 % for carpool vehicles in offices and commercial buildings. District heating and cooling system: Water cooled central air conditioning units were developed by Carrier and LG specifically for Songdo IBD, the first time such systems used in Korea. These custom-engineered units will provide a 20% energy savings over industry standard air cooled units CANARY WHARF, LONDON This area is having tallest building of United Kingdom which is having 50 floors and having height of 235M, the name of Building is One Canada Square.Its mainly a banking hub and all major banks of the world are having office there. All buildings provided with double glazed glass fazed which gives good thermal insulation and decrease power requirement for power. 1) Reliable and quality power source: In 2012 they started to purchase 100% renewable electricity. Canary wharf supplies are now composed exclusively from renewable sources including wind, hydro and biomass. 2) Renewable energy generation and integration: Some of the electrical generators are powered by micro-hydro water turbines. All buildings are with water storage on top of buildings and water flowing down from there to plumbing lines is connected to micro turbines which generate power during water flow. 3) Smart external lighting: Intelligent lighting controls systems for external lighting has been implemented in this building and replcaed HPSV (High pressure sodium vapour) lamps by compact flourescent lamps. 4) Energy storage: Each building basement is provided with a provision for thermal storage which can provide optimized chilled water and hot water. 5) Electric vehicles: Four free charging stations at KPMG s Canary Wharf are provided. 6) References: i. 7) References: i. ii. street lighting system Energy use Incheon Investment > New Songdo City nckerhoff_takes_leed_with_koreas_first_neighborhood_d evelopment_project.aspx-songdo built up area Songdo population ii. Canary wharf energy management -Free charging stations 4-38
89 Top Ten International Cities parameter wise comparison: Top ten international cities have been considered for comparison of various parameters Parameters IIT, Dadri Sino-Singapore Tianjin Eco city Mazdar city Songdo Barcelona Site area 3 sqkm (72 million sqft. BUA excluding roads ) 30 sqkm including 9 sqkm open space 700 Ha (7 sqkm) 6 sqkm including 2.4 sqkm green area (100 million sqft. BUA) Data not available Total Population 0.30Lacs residents, 1.06 Lacs working staff 1 Lac sustainable homes for 3.5Lacs residents, 0.4Lacs residents, 0.5 Lacs community 0.67Lacs residents, 3 Lacs working staff Data not available 50.74% industry (Hi-Tech, Bio-Tech, R&D, IT, 5.75% commercial & 9.31% residential, 2.15% Utilities. 80 % residential & 20% commercial and industrial business parks Residential and Commercial Residential and Commercial Pharma, textiles, electronic,logistics, IT industry MW (10293 kwh/capita) 170MW (10950kWh/Capita) They have a long term plan to install 6 x 500MW of which only 2 x 500MW installed 527 MW Grid supply for 4 nos. 110kV S/S and 2 nos. 220kV S/S. 100% Solar power Central city wide co-generation by natural gas 07substations supplied by grid for contracted capacity of 527 MW Land use classification 182MVA (Considering water cooled centralised Power Demand heating and cooling system)_ Per capita is applicable only for residential area. For Industrial it can be calculated on goods production basis kwh/capita for residential area, 196 kwh/sqm/year for commercial area. Power Source Technology used 2 separate grid supply through double circuit lines for 220kV S/S. All building should meet green building standards (Green Township / Green Factory Norms). Smart street lighting Roof top Solar PV and Solar Thermal Smart energy management and Smart power grid Smart meters Consider centralised heating and cooling system to decrease power by 25%. Green building standards. 700 nos.solar powered street lamps Solar heaters Target to meet minimum 20% of the energy demand by renewable sources by Provide district heating and cooling system to decrease power by 30%. Encourage residents to use bicycles and electric cars. Green building standards. It will be completely powered by renewable energy 20% of which will be generated on site. City is car-free, use light rail and metro lines. All buildings will only be built up to 5 stories & provide fountains, solar on street, 45 mtr. High colossal wind tower for natural cooling. 80 % buildings registered for LEED Certification. (Reduce 40 % energy) Vegetated green roofs on buildings to decrease heat. Solar PV, solar water heaters and geothermal heating systems in I-Tower of Songdo city. Water -cooled central air conditioning units will provide a 20% energy savings over industry standard air cooled units. Smart lighting, LED, dimmers, sensors, Building management, Smart meters Smart energy management and Smart power grid District cooling system to reduce 30% energy consumption Geo thermal wells are used for district cooling system. 4-39
90 Top Ten International Cities parameter wise comparison: Top ten international cities have been considered for comparison of various parameters (contd.) Parameters Site area Total Population Land use classification Canary wharf Copenhagen,Denmark Singapore Cannes Seoul 11.1 Ha BUA sqkm sqkm sqkm Data not available 1.05 Lacs working staff 5.69 Lacs Lacs 0.72 Lacs up to 2008 Data not available Mainly Commercial Residential Commercial industrial Residential Residential and Commercial Mixed land use Commercial Power Demand Data not available 6620 kwh/capita 8404 kwh/capita Data not available Data not available Power Source Purchase 100% renewable electricity Data not available 30% excess fuel as a back up for fossil fired generation Data not available Depend heavily on nuclear and coal power plants. Used micro turbines which generate power during water flow. Target to install 1 % solar PV of the total energy demand by Target to generate renewable energy about 7.3 percent of Singapore's current peak power demand by Smart energy management with smart Decreased 10% energy Smart external lighting Smart energy management and Smart power grid Zero emission transport from electric Thermal storage in basement for each building for chilled water and hot water. District heating and cooling system. Passive heating and cooling. Technology used All buildings are provided with double glazed glass which gives good thermal insulation and decrease power requirement. District heating and cooling system Enable the integration of new initiatives Electric Vehicles. Smart meters Integration of new Outage Management System (OMS) to enhance management of power outage such as 24 x 7 monitor & control, Outage detection and supply restoration. meters by installing 1000 smart meters till Low energy housing and energy efficient workplaces. Target to meet 20% energy by roof top solar PV and decentralised system by vehicles, fuels cells, or bicycle pedals. Take initiative towards smart grid 8 million lights replaced by LED Around 1000 e-vehicles and plan to increase the nos. And as well as charging stations. 4-40
91 National & International codes and standards for power supply system International Best Practice Parameter Following codes and standards referrred for IIT: Benchmarks/ Standards National and International codes / standards referred in IIT International Reference International codes / standards IEEE standards British Standards International Electro-technical Commission (IEC) ECBC-2009 POWER Energy Management & Smart Meters. Smart Cities are adopting Smart meters to: Help Manage demand & consumption with real time data. Better Outage management. Smart external Lighting Smart Cities are introducing LEDs for: Better efficiency, Improving safety Lower Consumption Centralised water cooled heating and cooling system Smart Cities are adopting district heating and cooling system to reduce energy consumption, to reduce greenhouse gas emissions and carbon foot print, International Building Code (IBC) ASHRAE ASHRAE Reduction in Carbon Smart metering envisaged for 100% requirement including Receiving Station, Distribution network and Consumer points. Local Bye laws MOEF (INDIA) Concept Note on Smart City IEEE standards ISO 37120: International best practices adopted for IIT International Best Practice Parameter International Reference Adoption in IIT (Integrated Industrial Township) Sustainability Factor Renewable energy generation Most Smart Cities including Barcelona, London, Mazdar etc., have or are planning to, adopt solar based power to introduce Solar -powered buildings & Community lighting; Monitoring and Linking of solar based power to the grid. Solar based Transportation. European has set a target of 20% consumption from renewal sources by Only Solar based power can be generated. The generation will of the total power demand based on the revised FAR norms. Utilise un-usable areas like Canal top & roof top of common infra, industrial & residential structures to generate renewable energy. Integrate renewable energy generated at IIT with Grid and switch as per demand with the help of Smart meters. Reduce Grid consumption; Reduce emission and Carbon foot print ; Estimated saving 5400Tons of coal per annum. Reliable and Quality Power Source & Reliable Distribution Network All Smart cities have continuous, reliable & quality power integrated with Smart Grid Solutions; The power is either Sourced from in-house generating plants or as per the availability in the region. Sustainability Factor system from Supplier to consumer through a Smart Grid. Integration with Renewable Sources. Indian Standards International Electro-technical Commission (IEC) Adoption in IIT (Integrated Industrial Township) LED lights envisaged at public places viz., streets & common community places with remote control. Foot Print by managing demand and consumption and reduction in Theft. Reduction in down time & improve Reliability. Improve Quality of Life with Better Visibility and Improved Safety. Reduce Consumption & Carbon Foot Print with better control. Approximately 60% load is HVAC Load, Total power demand can be reduced by approximately 25% considering centralized and efficient heating and cooling system. Reduce energy consumption, Reduce greenhouse gas emissions, Double circuit line from two separate sources to meet 100% power demand are adequate for reliable power for IIT. GIS Substations with double bus scheme; Provision of redundancy at equipment level; Integration of the entire power Improved Power Reliability; Reduction of land use; Better Management of demand and consumption. 4-41
92 4.6.5 ICT A smart city has been defined as a knowledge, digital, and cyber or eco city; representing a concept open to a variety of interpretations, depending on the goals set out by a smart city s planners. We might refer to a smart city as an improvement on today s city both functionally and structurally, using information and communication technology (ICT) as an infrastructure. A city that monitors and integrates conditions of all of its critical infrastructures including roads, bridges, tunnels, rails, subways, airports, sea-ports, communications, water, power, even major buildings, can better optimize its resources, plan its preventive maintenance activities, and monitor security aspects while maximizing services to its citizens. ICT is the basic infrastructure of a smart city, used not only in cyber space, but also as communicating elements of physical infrastructure, transmitting real-time data on a city s status by way of sensors and processors applied within real-world infrastructure. A diverse range of city functions and services rely on this ICT infrastructure, and this brings about a convergence of processes that enables a smart city to function as a giant, independent intelligence unit. The three pillars of Smart City Cities set out their own unique priorities when planning a smart city, but all smart cities must display three essential traits: ICT Infrastructure: Securing next-generation ICT infrastructure is critical to the success of emerging smart-city services. Efforts to develop ICT infrastructure must anticipate future service demands, rather than respond only to those most apparent. Integrated City-management Framework: A well-defined integrated city-management framework is essential. The many integrated subsystems, meta-systems and individual, building-block systems of a smart city will work in harmony only through the strictest adherence to common standards. Smart Users: ICTs are the tools to enable a smart city, but are of no use without smart-tech users able to interact with smart services. Increasing access to smart devices and education on their use, across income levels and age groups, must remain one of a smart city s highest priorities First phase, or the individual service level, applies ICT to improve individual city operations such as transportation, safety, environment and culture. The majority of smart city projects lie in this phase, an example being the addition of real-time bus schedule information to public transportation services, or using closed-circuit television (CCTV) to a greater extent in maintaining public safety. The Second Phase, or the vertical service level, integrates related processes and services by smart technology within major sectors of a city, enabling the provision of more advanced services. Taking the transportation sector as an example, citizens are offered information on the public transportation system s real-time activity as well as emergencies, road conditions, road repairs and subsequent detours. Smart city services are not yet integrated across sectors, but people will experience leaps forward in the quality of service provided by each sector. The Third Phase, or the horizontal service level, is the point of smart city development at which there is no longer a distinction between different services area, with all parts now seamlessly integrated within an efficient smart city ecosystem. Looking at the world s various smart city projects one might be surprised to discover more differences than similarities among them: Dubai s application of the concept focuses on enhancing urban development, and it leads a Smart-City project which aims to build a smart city network with Malta and Kochi. New cities added to this network are immediately associated with the Smart-City brand, attracting knowledge-intensive businesses to cities known to offer cutting-edge urban and ICT infrastructure. Amsterdam s approach is to achieve greater environmental sustainability through smarter operations, employing numerous state-ofthe-art technologies in efforts to reduce its emissions and use energy more efficiently. The Smart Seoul in this case study follows a balanced approach, focusing initially on a number of well balanced smart factors, and ultimately on much smarter city management and a better quality of life for Seoul s citizens. Smart Seoul 2015 was announced to uphold Seoul s reputation as a global ICT leader by boosting its sustainability and competitiveness through smart technologies Seoul U-Seoul Net: Establishing a communication network dedicated to smart services has been a priority to Smart Seoul. An administrative optical network called e-seoul Net was established in 2003, embedding fibre-optic cable along Seoul s subway tunnels to connect the city s main public buildings, its affiliated offices and municipalities. u-seoul Net providing citizens with free Wi-Fi service and full access to public web sites and enabling metropolitan government to handle huge amount of data generated from variety of smart devices. With u-seoul Net citizens have access to administrative services anytime, anywhere. U-Seoul Net is divided into three communications sub-networks: Wi-Fi network used to serve administrative functions; CCTV network enabling the exchange of video data generated by Seoul s 30,000 CCTV installations; The u-service network, which connects the websites of all the public offices under the Seoul Metropolitan Government, allowing citizens to bypass internet service-provider networks, and instead access u-seoul Net for free information on city services. Smart Work Center Seoul Seoul Metropolitan Government is piloting a Smart Work Center project, allowing the government s employees to work from 10 offices Smart Work Centers located much closer to their homes As employees checkin to a Smart Work Center for their shifts they are permitted access to sophisticated groupware and teleconferencing systems, ensuring their absence from City Hall in no way impedes their job performance. The project has attracted the interest of the international community, and Seoul plans to offer Smart Work to 30 per cent of its government employees by The first Smart Work Centers opened in August 2011, and by the end of that year, 2,792 employees had made use of Smart Work (available to all government employees on request). Moreover, a Metropolitan Government survey found that 79 per cent of its employees believed this service was valuable, and 91 per cent expressed interest in working from a Smart Work Center in the future. Smart Devices for All A smart city relies on an inclusive network of smart device users, with the city s inhabitants demanding or creating the services they most value. The inclusive network in Seoul encompasses high-speed broadband optical wire and wireless networks (including Wi-Fi, NFC technology, etc.). All citizens voices should be heard in this effort, and a key pillar of Smart Seoul 2015 is to increase access to smart devices and to educate new users on their operation. Seoul has undertaken following measures to increase the use of Smart Devices; a) Smart Device Donation: Seoul began distributing second-hand smart devices to low-income families and other needy people. The ICT market moves rapidly and typical smart device users buy new products well within the useful lives of the devices they are replacing. Citizens are encouraged to donate their old devices when buying new ones, and after these donated devices have been inspected and repaired by manufacturers they are distributed free of charge to the poor & needy population. Smart devices donators are incentivized by tax deduction in the range of USD 50 to USD 100 per device donated. b) Smart Capability for All through Dial 120: Smart devices have the potential to give voice to vulnerable groups, whether impaired financially, physically, or by the effects of ageing. Dialing 120 reaches 120 Dasan Call Center which consolidates the call centers of 25 district offices. Those with hearing impairments are able to call the call center through a video-call system which is today available as a mobile device application. Seoul has been providing education courses on smart ICTs, offering both city-run lectures and city-funded smart ICT classes through private education institutions. Aimed at immigrants, low-income individuals and elderly people using smart devices for the first time. Although still addressing the basics of smart technology s use, these classes will in the future teach more advanced skills, giving more citizens the tools to improve Smart Seoul s services. 4-42
93 Community Mapping Using ICTs such as geographical-information systems, the m-seoul platform and social networks, citizens will be able to raise the issues of greatest concern to their neighborhood or community. Community Mapping relies on P2P (peer-to-peer) communication among citizens and is a big step up from the one-way communication of road-repair requests on the city website s FixMyStreet board. It was very successful in its initial application, where physically disabled people marked streets or shopping malls without wheelchair access on a map shared by a community of smart device users. Seoul sees great potential in the system and is focusing on applying Community Mapping to a wider range of citizens concerns, empowering citizens to develop solutions to these concerns in collaboration with their peers. Smart Metering Project Seoul s Smart Metering Project aims to reduce the city s total energy use by 10 per cent. Smart meters provide home, office and factory owners with real-time reports of their electricity, water and gas consumption. This information is presented in monetary units, and is accompanied by detailed information on a household s energy-consumption patterns and means of adjusting those patterns to reduce energy costs. u-seoul Safety Services u-seoul Safety Service has using state-of-the-art Location Based Services and CCTV technologies to notify authorities and family members of emergencies involving children, the disabled, the elderly, and those suffering from Alzheimer s disease. Seoul has developed a smart device dedicated to this purpose and when its holder leaves a designated safe zone or pushes its emergency button, an emergency alert is sent to guardians, police, fire departments and CCTV Control Centers. search updates, and notifications of free cultural events. Apps also enable citizens to suggest actions to improve the city, participate in yes/no votes, and freely exchange city information over social networks; and another service, Staying Safe in Seoul, alerts citizens of emergency situations brought on by heavy rain, snow, typhoons or Fires. 2. CMS-based Homepage Content Management System (CMS) based Homepage more openly sharing public information and strengthening the city citizen relationship. The new website consolidates over 70 specialized websites previously maintained by government branches, offering a single platform through which citizens can access information on all possible public services information easily scrapbooked to users websites or social networks. Citizen interaction with the CMS website provides detailed data on individuals search patterns, and the metropolitan government is developing an intelligent service able to provide citizens with important personalized information even before it is requested 3. Promoting Open Governance 2.0 Recognizing the socioeconomic value of public information, Seoul aims to make all administrative information available to its citizens. In line with similar Government 2.0 strategies of Europe or the USA, Seoul s open governance 2.0 strategy encourages transparent city governance and open communication between the city s government and its citizens. Information Open Square, added to Seoul s website, is a mechanism through which Seoul discloses administrative documents, including work still in progress. Citizens and the private sector are consequently encouraged to make use of the city s administrative information to uncover new job and business opportunities. 4. Developing Public Applications and Its Current Status To make use of the u-seoul Safety Service, citizens are required to register with mobile carriers specifically designed for this purpose. Supporting low-income households and especially vulnerable groups, Seoul often provides emergency-alert devices free of charge or at significant discounts, aiming to reach maximum users. Government/Municipal-developed Services 1. Mobile Seoul (m.seoul) Mobile Seoul (m.seoul) makes use of Mobile Web technology and mobile applications to provide Seoul s citizens with 62 unique services over 11 types of mobile device. A wide range of public information is available over the Mobile Web, but the inconvenience of navigating is averted by mobile apps concentrating on the provision of the most commonlydemanded information. m.seoul apps support location-based services pinpointing nearby public offices, restrooms, hospitals, supermarkets or bus stations. Other services include live real-estate listings, daily job Seoul Metropolitan Government discloses all its administrative information and rewards the best private sector or citizen use of this information in a Public Application Contest. Seoul City offers 37 public applications developed by Seoul or in partnership with the private sector, and Seoul s Public Application Management System monitors the number of people using each app, identifies overlaps in app functionality and ensures app content remain up-to-date. The popular Seoul Bus app provides precise bus schedules updated in real-time and is an excellent example of an app developed by the private sector using public information. Another is itour, an app turning one s smart-device into Seoul s most knowledgeable tour guide. 5. Online Reservation System for Public Services reservation system lists over 150 services under categories such as education, infrastructure, cultural tourism, commodities and medical treatment. Seoul Metropolitan Government and its affiliates offer over 30,000 public services, from education courses to reserving public sporting or cultural facilities, using gymnasiums or registering at day-care centers. Of these 30,000-plus services, 17,000 offer online reservation. However, around 1,500 core services are linked to the integrated reservation system. 6. Eun-pyeong u-city Eun-pyeong is a district of Seoul, and Eun-pyeong u-city, a project completed in March 2011 and now houses 45,000 people on land covering 3.49 million m2 (862.3 acres). Eun-pyeong s residents do not require private Internet access or smart devices to make use of city services, and instead receive practical information via smart devices on their living room walls. In the interests of residents safety, intelligent CCTV cameras installed on every street corner automatically detect people trespassing on private premises. If a disabled or elderly person carrying a Location Detecting Device leaves Eun-pyeong or pushes an emergency bell on the device, their location is automatically sent to their guardians via text message. The city s high-tech Complex Street Lamps reduce energy use, and also broadcast audio and provide residents with wireless internet access. The Media Board, which is set up in the New Town, is a digital newsletter providing news, the bus schedule and other practical information to residents and visitors. Finally, the city s u-green service represents a network of sensors assessing factors such as water and air quality, transmitting this information directly to the Media Board and the devices in citizen s living rooms. The Seoul Metropolitan Government runs a ucity Consolidated Operation Center which oversees the web of ICTs composing Eun-pyeong u-city; managing its ubiquitous ICT networks, and collecting and archiving vital city information Dimensional Spatial Information Seoul Metropolitan Government has been increasing the capabilities of its 3-dimensional (3D) spatial information system: a mapping application providing 3D street information and enabling the provision of new smart services. The system supports three new services: 1) Geographical Information, which allows users to view streets as if standing upon them; 2) Tour with a Theme Information, which highlights tourist attractions, offering its users a virtual tour of Seoul; and 3) Urban Planning, an application allowing city planners to simulate infrastructure development or renovation. Next-generation online reservation system allows citizens to search for, book and pay for public services instantly. The one-stop, integrated 4-43
94 Improved further by high-quality photographs and video clips, 3D spatial information will be very useful in monitoring the environment, preventing disasters and constructing disaster-resilient infrastructure. For example, flood simulations developed in 2012 aid in predicting which areas will be worst affected by floods, thereby enabling the development of preemptive flood-response mechanisms. 8. u-shelter: State-of-the-art Bus Stops Seoul s u-shelter bus stops incorporate state-of-the-art ICTs to offer citizens a variety of smart services such as Bus schedule, Route, Fare Information, Check Traffic Card balance, etc. Each u-shelter interacted with an average of 2,518 people each day with Bus Route Guide the most-frequently used service at 1,427 times per day, followed by Digital Map (764), Destination Search (135), Traffic Broadcasting Station (65) and Weather Forecast (59). Citizen-developed Services 1. NFC-based Mobile Payment The NFC (near field communication)-based Mobile Payment system is a product of public-private collaboration, and is a service accessible to anyone with a smart device or mobile card. People making a purchase at a store select credit-card payment or mobile-card payment, and pay for their purchase simply by touching their smart phones to a specialized reader capturing information essential to the transaction. Seoul s citizens today possess roughly 7 million smart phones with builtin NFC chips, and Mobile Payment services are currently available in over 22,000 stores including super markets, convenience stores, gas stations, coffee shops and department stores. An illustration of the system s application: Download mobile coupons, and receive discounts on movie tickets booked through NFC-based Mobile Payment. Touching a smart phone to a poster advertising an upcoming film provides movie trailers, cast information and plot summaries; and purchasing tickets to that film is completed by the touch of a button. Touching a smart phone to a reader opens the movie-theatre s door; and smart phone is automatically set to vibrate mode as its' user enters the movie theatre. A coffee shop stages a promotion encouraging customers to download coupons when in range of the shop s Wi-Fi: downloaded coupons are used to order and purchase by touching a smart device to items on the menu. An NFC-based P2P payment system enables money transfers from one smart device user to another. Users touch the smart devices to one another, and once the transferring party has entered their PIN number, the transaction is complete. 2. Virtual Store Virtual Store is an example of B2B and B2C utilization of smart devices and social networks. Virtual Stores are found on street billboards, with each item possessing a unique barcode or Quick Response (QR) code. A smart phone s barcode or QR code reader allows consumers to purchase goods while on the move, receiving delivery at their homes later that day. The HomePlus Application facilitates transactions at HomePlus Virtual Stores. The application combines traditional and virtual shopping experiences, allowing customers to purchase goods using a smart-phone app able to read product barcodes or QR codes. With purchased items delivered to customers homes, citizens can shop for groceries and other goods without the inconvenience of carrying shopping bags. 3. School Newsletter Application The citizen-developed School Newsletter Application connects schools with pupil s parents, instantly notifying parents of changes in academic schedules or the items students are required to bring to school for the following day s lessons. This is achieved by way of an online school board alerting parents of changes to its content whenever it is updated. 100 elementary schools currently make use of this service, and more are encouraged to do so via I am school Chicago Chicago has been active in the smart city space since Despite this relatively short period, strong political leadership and well aligned governance structures have allowed the City to take significant steps in achieving their goals. Investment in open superfast broadband infrastructure, community engagement, inclusion project and projects specifically aimed at fostering technology innovations, are all part of the City s aspiration to create the City-as-a-Platform where products and services can be built on city owned resources. The core drivers for the focus on smart city projects in Chicago include: Governance Transparency Accountability for the expenditure of public money Infrastructure investment Economic development Community engagement Infrastructure investment: Broadband project The City is investing in a new open fibre optic ring to get gigabit speed over an open network. By investing in an open infrastructure the City hopes to facilitate a more dynamic and competitive marketplace. The City hopes the high-speed broadband combined with a competitive price point will be an incentive for digital technology companies to locate or re-locate in Chicago. Pilots with the Federal Communications Commission on Spectrum Chicago City has run out of unlicensed radio spectrum. It is currently working with the Federal Communications Commission on Spectrum on dynamically sharing spectrum that has been allocated for public safety, so that when it s not in use it can be used for small cells or cell phones etc. Sustainable Broadband Adoption The Smart Chicago Sustainable Broadband Adoption programme intends to spur economic development in five disadvantaged neighborhoods in Chicago. The broadband awareness and adoption programme provides computers and training opportunities to more than 11,000 residents and 500 small businesses and not-for-profits. Economic development Chicago sees an economic development rationale for opening up data, owing to the fact that businesses and applications get built on their open data platforms. Facilitating a market of interested parties and aligning industry, community and public sector needs is a key priority in Chicago. To this end, the Mayor convened a Technology Diversity Council of experts to develop policy recommendations to support the diversity of the technology industry workforce in Chicago. Some recommendations may require collaboration with other departments. For example, one solution might involve the education pipeline through the promotion of studying engineering, as well as collaborating with the private sector on investment priorities. Other investments in facilitating this marketplace include: Analytics of collected data Economic development of business and Services Smart city projects in Chicago: The three main application areas for smart city and open data projects in Chicago are: Chicago Health Atlas: A website for displaying aggregate health-related information of the city on a map. Smart Data Platform / Windy Grid: A real-time open data infrastructure & analysis system that works alongside a series of separate tools to boost Chicago's analytics capabilities. This Website provides the data of city on energy usage, sensor data, water level statistics on hourly basis, employee s data, path holes data, public grievances, census data, towed vehicle information, Traffic information with historical trends and so on. 4-44


95 User engagement has helped the City to understand the requirements, marketing and delivery of information and services. Illinois Open Technology Challenge: A collaboration with the Illinois Science and Technology Challenge to bring Government, developers and communities together to use public data and create digital tools that will serve today's civic needs and promote economic development. Open data platform to organizations or developers so that they can develop applications of public use. Hosted Web Space: Supports people/organizations that want to create services on the government open data by hosting web space for them. Community Engagement Much of the community engagement work in Chicago is carried out by the Smart Chicago Collaborative. Initiatives include: Rio De Janeiro Smart city investment in Rio was accelerated by Olympics and World Cup and also natural disasters, specifically landslides due to flooding, which killed tens of people a year. Mayor Paes believed that a more coordinated response was required by the city, and that a control room would be instrumental in facilitating this. As such, the city partnered with IBM and Oracle to create a state of the art situation room. This has been the city s primary investment in smart technology, and is being used as a basis for their continued investment 1. Centre of Operations (COR) The Centre of Operations was created to respond to natural disasters. In 2010, the second year of the current administration, a big landslide killed fifty people. The centre of operations was originally in the Olympic plan for 2016, but the Mayor decided that it was required immediately. It was built from scratch in eight months in partnership with IBM and Oracle, and is used by decision makers in the city to operate general city services, but especially to coordinate emergency response. The City that Networks: A key positioning report on what the Smart Chicago Collaborative would do around digital inclusion. The city of Rio de Janeiro collects information from 30 different city departments about transportation, water, energy, weather and other conditions. Then it communicates those conditions to powerful computers, which crunch the data and present it in a unified control center of the city. Not only does the city gain full situational awareness, it can even predict some conditions in advance, such as where floods will occur during severe storms. It can also develop actionable tasks based on modeled patterns, creating a competitive advantage for smart cities. Rio has state-of-art Command and Control Centre or Communicating data: Once you ve collected the data, you need to send it along. Smart cities typically mix and match a variety of wired and wireless communications pathways, from fiber-optic to cellular to cable. The ultimate goal is to have connectivity everywhere, to every person and every device. Crunching data: After collecting and communicating the data, you analyze it for one of three purposes: 1) presenting, 2) perfecting or 3) predicting. Digital Skills Initiative: A central hub for coordinating technology training across the departments and delegate agencies that have received federal funding. Connect Chicago: A loose network of more than 250 places in the city where internet and computer access, digital skills training, and online learning resources are available for free to the Citizens. Smart Health Centers: A places that have trained health information specialists in low-income clinics to assist patients in connecting to their own medical records and find reliable information about their own conditions. Future plans: Gigabit Broadband: The broadband work in the city is seen as a transformative project. The speeds and the price points that they are aiming to hit are intended to be disruptive. They believe that will be key in fostering innovative and creative responses to the city s challenges. City as a Platform: Chicago has many networked devices (e.g. trash cans, bike sharing schemes). There is an opportunity to get these better connected in a similar way to the open data portal. Dispersed Digital Literacy: Digital literacy and digital access in 2013 is much more dispersed than it has ever been, and we are moving away from the era of the PC. Although there are public computer centers in Chicago, the next challenge will be bringing these resources out into the street. 2. Open Data One of the core principles of the centre of operations was that it was to be transparent. If you want to manage a city, one of the best ways to do it is to circulate information - to facilitate the flow of information. For example, all of the media companies, TV and radio stations have a seat inside the Centre of Operations. There is a press room and they have access to the information. This helps ensure that the information is spread out to society through the traditional mechanisms of media, and also through the internet. Rio has made a significant amount of their data freely available to the public. Largely these datasets fall into two categories: 1) The data portal data which provides in-depth city information, such as crime rates, mortality rates etc. 2) Centre of Operations data which holds information for everyday management - e.g. congestion, weather etc. If you ve read about analytics or Big Data, then you may already know about the astonishing things that become possible by crunching large amounts of data. Importantly, crunching data turns information into intelligence that helps people and machines to act and make better decisions. This begins a virtuous cycle wherein data is made useful; people make use of that data to improve decisions and behavior, which in turn means more and better data is collected, thereby further improving decisions and behaviour. Presenting information: tells us what s going on right now. In the aerospace and defense industries, they call this situational awareness. Software monitors the huge flow of incoming data, then summarizes and visualizes it in a way that makes it easy for human operators to understand. For instance, a smart operations center can monitor all aspects of an emergency situation, including the actions and locations of police, fire, ambulances, traffic, downed power lines, closed streets and much more. 4-45


96 Perfecting: Operations uses the power of computers to optimize complex systems. For instance, balancing the supply and demand on an electricity network; or synchronizing traffic signals to minimize congestion; or selecting the ideal routes for a delivery fleet to minimize time and fuel costs; or optimizing the energy usage of an entire high-rise to achieve maximum comfort at minimum cost. Predicting: What s next is perhaps the most exciting part of analytics. Cities such as Singapore already crunch data to predict traffic jams while there is still time to minimize their effects. Cities such as Rio de Janeiro already predict just where flooding will occur from a particular storm, so emergency crews and evacuation teams know just where to go. 3. Video wall of about 20 X 4 Screen and 80 Person seating arrangement with local Display group for each official. 4. Local Weather prediction System. 5. City wide Video Surveillance, GPS Based Vehicle Tracking System for Public Transport 6. GIS Based Passenger Information System, Emergency Response System, Traffic Management System, City wide sensors for monitoring the utility services 7. Information Sharing from City Staff to departments such as Transportation, Trash collection, Hospitals, Emergency Response Team Stockholm Stockholm s approach to smart city investment is citizen centric, and emerged from their work creating e-government services. The city has funded a large fibre-optic broadband network through Stokab, a cityowned company, and sees itself as a test-bed for new technology. Kista Science City in Stockholm acts as a focal point for technology innovation and economic development around smart city technologies. Stockholm s focus on research and innovation is supported by one of the world s largest ICT clusters. Cities can derive benefit by collecting, communicating and crunching information from a single department. But the greatest benefits come when data is connected with multiple departments and third parties. Many cities combine historic traffic data with information about population growth and business expansion to know when and where to add or subtract bus and train routes. Other cities correlate multiple data sources to predict crime the way we predict weather. Or predict which expensive transformers are about to fail on the power grid and which will still be good for years to come. As we ll see in more detail, a smart city is a system of systems water, power, transportation, emergency-response, environment, etc. with each one affecting all the others. In the last few years, we ve refined our ability to merge multiple data streams and mine them for amazing insights. It is those insights presenting, perfecting and predicting that enhance the livability, workability and sustainability of a smart city Some of the key points about Rio CCC, which consists of with following system monitoring: 1. Journalist s Room at the top of CCC 2. CCC (COR) has staff from 30 Department of Municipal Corporation and Private Suppliers infrastructure, and leasing connections to the network. Their purpose is not only to provide access to fibre-optic telecoms, but to create an environment that favors IT development, and by extension positive development for the Stockholm region. The telecoms industry has been a strong presence in Stockholm for the last hundred years, particularly driven by Ericsson, communications technology is part of the city s legacy. The beginning of the smart journey in Stockholm started in the 90s when Stokab was created, which laid down a vast fibre network in the city. The aim was to provide local businesses with access to great communication at competitive prices. Currently there are about 50 service providers using this fibre, which is accessible to about 80% of households. Stockholm sees itself as a good test-market for new technology, and was the first city in the world to roll out 4G, the new standard for mobile telecoms. In 2006/7, the city began investing in e-governance. They set aside 70 million to set up e-governance services and make them appropriate, customizable and accessible to all citizens. Smart City Projects in Stockholm 1. E-government A huge part of the smart agenda in Stockholm has been to invest in high quality, accessible e-government services. With an investment of 70 million since 2007 they have created over 50 digital services, which have cut management costs. 2. Stokab Fibre Network Stokab is a publicly owned company that was established in 1994 to create a competition-neutral (fibre-optic) infrastructure able to meet future communications needs, stimulate competition, promote diversity, offer freedom of choice and minimize the need for excavating. The company is now also responsible for managing the use of that 3. Kista Science City Another aspect of smart city investment in Stockholm is the Kista Science City, which is: A creative melting pot in Stockholm where companies, researchers and students collaborate in order to develop and grow. The foremost sector in Kista is ICT. Ericsson, Microsoft and IBM are just some of the major ICT companies to have established a presence in Kista Science City. There are also over a thousand other ICT companies of all sizes. 6,800 students are currently studying ICT courses at Stockholm University and the Royal Institute of Technology in Kista Science City. 4. Royal Seaport The Royal Seaport is a vast new development area in Stockholm. On completion Stockholm Royal Seaport will house 12,000 new dwellings and 35,000 new office spaces from the port and its associated trade to media and finance companies. The ambition is to offer one of Europe s most modern and attractive living environments. The goal is to be CO2 neutral by One the mechanisms to achieve that are to use ICT and smart grid to make it possible for different houses to provide electricity at different times of day, and to be very energy efficient. 5. Transport and Energy Efficiency The city is working in cooperation with various private entities investigating the use of data in the layer between the connected devices and with the big data scheme to optimize procedures (such as traffic monitoring). The city also operates a congestion charge zone which supports data collection through the processing of vehicles. The system currently helps the city to monitor traffic, and they are investigating how this can be better exploited. 4-46
97 6. Green ICT Green IT a strategy for the City of Stockholm applies to the city s administration and Stockholm s Stadshus AB (the parent company for the activities that Stockholm City has chosen to operate as a limited company). The strategy has been adopted by the City Council and is administered by the Executive Office. The Green IT Strategy for the city of Stockholm explains: Barcelona Barcelona is an extremely compact city, which offers an advantage for sustainability. However, it leads to serious challenges of noise, traffic congestion and pollution.27 Tourism is one of the core industries in Barcelona, alongside knowledge-based and information services, media and fashion. Education is one of the key pillars of Mayor Xavier Trias vision for Barcelona. Green IT is a collective name for the measures designed to reduce our environmental impact with the aid of IT. It involves both using information technology to reduce our environmental impact, and reducing the energy consumption and environmental impact of the IT sector as a whole. Another key change is that the smart city movement is a mechanism to use ICT strategically as an enabler for cities to achieve their goals. For Barcelona, the smart city is a means rather than an end in itself. Ms Lopez Ventura explains that s the main change from the previous movements, that technology is an enabler for projects. This philosophy is clearly reflected in their strategy, where technology is seen as an enabler for: Green IT is a strategic and management issue, which is why it is important that environmental issues are considered from an operational viewpoint. Doing so clarifies the ways in which the municipality can reduce its environmental impact across the board. 7. Open Data Stockholm sees open data as a fundamental principle for the future, and they are keen to make access to data more pervasive and straightforward. It is seen as huge opportunity for the city, especially for creating new innovative products and services and delivering economic development in the city. Therefore in Stockholm, there are two key drivers around big data. The first driver is in getting the data out to the public and empowering them to make better, more educated choices. The second is about spending public money in creating the back end system, to really drive change and efficiency within the City as an organization. Competition In order to promote and facilitate the use of open data in the city, they launched a competition, the Open Stockholm Award. This competition encouraged companies and individuals to use data innovatively to create new products or services. As part of this, the City published environment data, demographic statistics, etc. - datasets that were feasible both legally and practically. The competition received approximately 200 different ideas for new e-services, and created about 60 developed solutions. It was hailed as a huge success in terms of participation and output. Future Plans Potential areas for investigation in the future include working with traffic management and smart grid with Sweden as a whole. The city sees the internet of things and connected devices as an interesting way forward for the city in terms of economic and physical development. Working with people who do not have access to the internet is also a priority for the future. Currently 90% of communication with the City is via or the internet. At the same time there are people who are not included, are not comfortable with technology, which is a socio-economic dimension. The City is keen to understand this challenge and make it possible for all citizens to be a part of the digital society. Efficient and sustainable urban mobility Environmental sustainability Business-friendliness and attracting capital Integration and social cohesion Communication and proximity with people Knowledge, creativity and innovation Transparency and democratic culture Universal access to culture, education and health. In Barcelona, the smart city movement started in energy, but now is spreading across all sectors. The city believes that this investment will create a sustainable city, and also work towards fostering citizen participation, mobility, and other fields. The city describes this as a transversal approach. Smart City Projects in Barcelona Transversal Projects: New Telecommunications Network Integration of different fibre optic networks, boosting Wi-Fi network, reduced operating and maintenance costs, new business models. Urban Platform Barcelona sensor platform, city operating system, and apps and services. Intelligent data Open data, measurement of city indicators, and a central situation room for decision making and control. Electric Vehicles Development of electro-mobility in the coming years, short-term (two years) and medium term (five years) in Barcelona. Tele-management of Irrigation Remote management system for centralized control of the automated irrigation infrastructure in order to control the duration and frequency of irrigation in each area. Orthogonal Bus Network or Directorate Mobility Plan Orthogonal design of the bus network in Barcelona to improve urban mobility. Urban Transformation Within the frame of the remodeling of the main streets of Barcelona will develop a series of smart cities and telecommunications projects. Citizen compromise to sustainability a roadmap for achieving a more equitable, prosperous and self-sufficient Barcelona. O-Government Implementation of Open Government, strategy and a roadmap, to develop tools and web sites in specific areas of transparency, open data and civic participation. Smart parking Network of sensors and displays of parking availability across the city. Barcelona in your pocket Barcelona contactless and mobile apps. Open Data Barcelona has an open data portal, OpenData BCN, which opens up city data to the public and has three clear aims: To increase the transparency of the City Council To universalize data access To promote innovation and the economic fabric The city has been investing in 22@Barcelona, an urban regeneration project offering modern spaces for the strategic concentration of intensive knowledge-based activities. This initiative is a new model for city development, providing a response to the challenges posed by the knowledge-based society. Some technologies and projects being implemented at 22@ Barcelona include: System of underground service galleries: Interconnecting the blocks and enabling service networks to be repaired or improved without the need for excavation in the streets. New fibre-optic telecommunications networks, with a dark fibre network: Allows companies to contract any service providers and create direct links between different parts of the district. New System of centralized public climate control: Involves savings at both the economic level and in the emission of CO2 Selective pneumatic waste-collection network: Differentiates between organic and inorganic waste and paper. Vertical Projects: Lighting Directorate Plan A strategic plan for lighting in Barcelona. Self-sufficient islands Creating energy self-sufficient island, to improve practices related to consumption and production of energy. 4-47
98 New electricity network: Guarantees a quality of electrical supply, more efficient gas and water-service supplies. 22@ Urban Lab: The goals of the Urban Lab are to use the city as a laboratory to test new solutions and services, facilitating market access and promoting competitiveness. The OGCIO (Office of the Government Chief Information Officer ) has identified that ICT is driving change not only in how the government communicates ith citizens, but in its fundamental role in contributing to debate about the city. ICT industry players can make use of this new wireless platform to develop and provide more Wi-Fi applications, products and supporting services to their clients, and open up more new business opportunities. Open Data Smart City Projects in Hong Kong The pilot projects on behalf of the project 22@Urban Lab: Improve resource management and efficiency and the urban quality of the neighborhood. Barcelona also created the Smart City Campus, located in the 22@ innovation district. In order to further strengthen the strategy of the city and urban innovation, Barcelona wants to offer the city a test-bed and storefront for companies to develop and test pilots. The Smart City Campus will develop a cluster of smart city companies, and the Council hopes this will foster connections between diverse sectors like ICT, energy and mobility, for the creation of an ecosystem that integrates not only companies (multinationals and SMEs), but also to institutions, research centers, technology transfer centers, and universities. Future Plans Barcelona City recently published their smart city strategy, which recognizes and incorporates existing successful projects, as well as setting an agenda for the future. This will help Barcelona to build upon their existing investment and success, whilst aligning action across the city to a common purpose. In the coming years, the city believes that effective dialogue with the private sector, research institutes and other cities will be core to their success. As such, they see the City Protocol, participation in international events and sharing their learning openly as key next steps. They believe that this will help them to raise their profile as a global smart city, secure investment, and support other cities in achieving their goals Hong Kong Hong Kong has made significant organizational and strategic investment in ICT, and has a clear strategy for ICT investment, as articulated in their Digital 21 strategy. They have a specific function for ICT strategy, housed in the Office of the Government Chief Information Officer, which employs over 700 staff. They have a particular focus on economic development through facilitating the digital economy, and aim to create world-class e-governance services as well as prioritizing digital inclusion. Electronic Information Management Electronic Information Management (EIM), was central to the 2008 Digital 21 Strategy, and covers three central themes: a) Content Management b) Records Management c) Knowledge Management. EIM aims to take a strategic approach to achieving effective information management through wider use of information technology (IT) and associated culture change so that information can be created, stored, used, disseminated, retrieved and archived in a well-managed manner and be readily available for day-to-day operational use, proper record keeping, knowledge sharing and decision support. E-government The OGCIO is responsible for running the city s main website. They aim to meet 80% of citizen needs for dealing with the government on that website, through e-government services. The vision is that our clients should find the government service as convenient, as efficient, as pleasurable to use as the best services they get from the private sector. Mr. Godfrey, OGCIO As of December 2012, there are 49 government mobile applications and 38 government mobile websites. OGCIO facilitates the implementation of mobile e-government services through providing support to Government departments and developing mobile applications commonly used by them for public services. In order to combat this, the government launched a data portal entitled Data One (Data.One.gov.hk). This 18 month pilot scheme made georeferenced public facilities data and real-time traffic data available for free. They held a competition for the best applications of this data, for which they received 41 entries. The winner was an app that located the nearest doctor, and tracked appointments. Following the success of this trial, and support from citizens and industry, the government plans to continue with the portal, and gradually add more datasets. The OGCIO claims: The vision is that with more types of PSI being made available, there will be more creative and value-added applications re-using PSI (public sector information). This will not only add convenience to citizens' daily lives, but also create new business opportunities, encourage entrepreneurship and promote innovation in a knowledge-based society. Future Plans Hong Kong will continue to work towards the vision articulated in the Digital 21 strategy, and will update it as new challenges and opportunities are identified. Shifting to cloud-based ICT operations in the city will be a core upcoming challenge. GovWiFi Government Wi-Fi Programme (GovWiFi) aims to transition Hong Kong into a wireless city, providing free wireless internet services to all citizens. The programme places Wi-Fi facilities at designated government premises, and aims to ensure that: ICT for Public Engagement New communications technology is fundamentally changing how citizens expect to interact with the government. They expect communication to be two-way, efficient and social. Citizens can surf the web freely for business, study, leisure or accessing government services whenever they visit the designated Government premises. Business organizations can extend their services to a wireless platform to reach and connect with their clients. The Government holds a significant amount of data that could be of significant value to the public. These datasets include, for example demographic, economic, geographical and meteorological data, historical documents and archives. However this information has not historically been in a format to facilitate value-added re-use by third parties. 4-48
99 4.6.6 Design Consideration for Smart City w.r.t. International Benchmarking considered for IIT Greater Noida Infrastructure Utilities i. Water Supply System International Benchmarking and Best Practices Adopted Impact which will be created based on the Design Considerations Reliable Water supply on 24X7 basis Availability of potable water is ensured throughout the day 100% recycle of reclaimed water The reclaimed water will be used for entire non potable use such as flushing, green areas, industrial requirement etc. By this, the fresh water requirement will be reduced to 35-40%. Dual piping system (Potable and non potable) Dual piping system is proposed separately for potable and non potable water supply Making available of adequate quantity of water as per standard norms based landuse. Reduction of Non Revenue Water (NRW). This can be monitored by dividing the Distribution zones into number of isolated area i.e. DMA (District Metering Areas) with one inlet and one outlet. Equitable water distribution Minimized NRW/UFW Energy efficient pumps and motors Optimized design of pumping main Energy efficient pump and motors shall be used which will help in conserving energy. Optimized design distribution system Pumping main will be optimized considering capital cost and Life Cycle cost for 30 years 100% meter connection Smart metering Distribution system will be optimized using Water GEMS software. An extended period simulation (EPS) of distribution system will be carried out to assess the real time scenario. Material of pipe will be selected based on techno economic analysis. Complete automation using SCADA system 100% consumer meter connection is proposed. This will help in realization of revenue water. Quality of water meeting WHO/IS10500 standards Smart metering will help in : 1. Automatic meter reading and bill generation 2. Online information on bill amount, reminder for pending bill amount. ii. Quality of potable water will be provided as per CPHEEO /WHO / IS standards. 100% connection to sewer network This will ensure 100% collection of waste water by sewerage system and no waste being disposed to open drains Optimized design of sewer network Network system will be optimized using Sewer GEMS software. Minimum self cleansing velocity and other hydraulic requirements will be maintained. Material of pipe selected based on techno economic analysis. Advance Treatment process (Sequential Batch Reactor) Less land footprint area, less energy requirement and treatment of wastewater up to desired standards. 100% Recycle of reclaimed water Energy efficient pump and motors shall be used which will help in conserving energy Energy efficient pumps and motors Complete automation using SCADA system Quality of water meeting WHO/IS10500 standards for non potable usages. Waste water System 4-49
100 Infrastructure Utilities iii. iv. v. Storm Water drainage System Solid Waste Management ICT International Benchmarking and Best Practices Adopted Sustainable Urban Drainage System(SUDS) Impact which will be created based on the Design Considerations Rainwater Harvesting o Infiltration Groundwater Recharge o Swales & Pond Flood control Safe disposal of rainwater Intelligent flood levels monitoring systems Generation of Waste Lower inert waste and thus low land foot-print required Automated Collection System Substantial reduction of Greenhouse gas (GHG) emission by focusing on 4Rs, also there would be no requirement of heavy waste trucks which may have adverse impact on aesthetic/ health of inhabitants. Segregation at source The AWC based system is capable for partial waste segregation at source by having dedicated sensor based Chutes for Organic and Inorganic waste. Final waste segregation would be done using Mechanical conveyor belt so as to reduce overload of unwanted waste being disposed/ landfill Since, AWC is automated and integrated collection and transportation system, would help in reduction on Greenhouse gases (GhG emissions) and thus would reduce Carbon Footprint Treatment and Storage Disposal E-Waste, Construction Waste and Bio-Medical Waste Provision of Trunk infrastructure for 100% Broadband Internet penetration throughout City ICT provides e-governance, collaborative digital environment, knowledge networks, integrated e-services, policy innovation, electronic services, online services, Europe, democratic activities, decision making. Provision of trunk Infrastructure for 100% Telephone penetration and city wide network coverage Complete City-wide ICT backbone Fiber optic cabling infrastructure on duplicated 10Gbps links will provide 100% network security, redundancy, resiliency, and scalability with city construction phasing and while keeping a focus on limiting the initial cost. Provision of trunk infrastructure for telephone penetration in the city CCTV Surveillance will result in enhancement of safety and security Traffic Management Centre will improvise congestion related issues in dynamic way Integration of I&C related SCADA systems at various city-wide facilities such as STP, pumping stations, SWM system etc. with ICT backbone infrastructure so as to control and monitoring from main control centre building (CCC). 100% Landline Provision for State of Art Command and Control Centre at CBD for Monitoring, communicating, Presenting and predicting Information regarding Utilities, Safety, egovernance, Security and Life support system for Residents of the City. 4.7 Summary The case study undertaken for the various disciplines under this chapter has opened up more avenues for conceptualizing and strategising the sustainable solutions to be proposed and achieved for IIT, Greater Noida. As regards to master planning, many feature have been incorporated like sustainable and low carbon features, promoting walk ability, providing a choice of transportation modes, adopting zoning in such a way which promotes optimization of land, assigning higher FAR to zones that consciously promotes easy accessibility to larger share of people and understanding land use distribution of areas with industrial concentration are some of the features that is to be incorporated while designing for Integrated Industrial Township, Greater Noida. This chapter describes national and international best practices for land use, master planning and transport planning components. The key aspects extracted from the entire review process were used as guiding concepts and principles whilst proposing the similar components for IIT. The amalgamation of all the concepts has been formed the basis for suggesting adopted principles for the IIT which are discussed in the subsequent chapter. 4-50

101 5. Planning Approach and Principles This chapter focuses on the planning approach and principles adopted for the formulation of Final Site Layout Plan Options for the subject project. These principles had been applied in both the options. The base studies on the site, analysis from the primary and secondary data amalgamated with the concept s philosophy and the design principles has been instrumental in achieving the desired project output. 5.1 Planning Approach The Consultant s approach to the project is based on three key parameters Sustainable, Integrated and Inclusive development. Sustainable It is the umbrella approach to the entire planning process. The concept includes all the three pillars of sustainability Environmental, Social and Economic in the planning approach. The prime emphasis is on achieving the Clients vision of building world-class township whilst aiming at reducing carbon footprint of the entire development. Integrated The concept carefully integrates the Clients Vision and objectives with the site challenges and opportunities. An equally ample consideration has been applied for integrating the surrounding settlements and the village Abadi area falling within the site whilst designing the Site Layout Plans. Integration is also ensured by designing work places and residences in a close-knit manner to encourage work-live-play environment. Inclusive Throughout the planning process, the consultant has been actively engaged with all the stakeholders (DMICDC, GNIDA, NTPC and the other consultants who are involved into various development projects in the vicinity of the site) to seek their suggestion and feedback. Apart from these, several constructive brainstorming sessions have been conducted with multidisciplinary teams to maximise the site potential and arriving at the most optimum land use options for the project site. 5.2 Design Basis Basis for Land use Distribution Basis for Industry Mix As advised by the Client, the basis for land use distribution has been adopted from GNIDA Master Plan 2021 (Section 10.12). The distribution is depicted in the following Table The industry Mix for the subject development is adopted from Pre-feasibility Report as well as the Market Analysis and Business Plan Report (submitted separately). The Pre-Feasibility Report suggested the industry mix as Hi-Tech, Bio-Tech and R&D industries. However, the Market Analysis Report identified strong potential for IT industries and thus recommended to be a part of the proposed Industry mix for the project. Therefore the final industry-mix alongwith their sub-sectors are as under: The graphical representation of the same is exhibited in the Figure 5-1. Table 5-1: Recommended Land use Distribution for IIT (GNIDA Master Plan) Sr. Hi-Tech Bio-Tech R&D IT Industries Fabrication Nano Technology Opto Electronics Bio-Pharma Bio-Services Bio-Agri Bio-Industrial Bio-Informatics IT, Electronics Automobile Food Pharma Healthcare IT ITeS Land use Percentage Distribution (%) 1. Industries Commercial Residential Utilities Green and Water Bodies Roads Existing structures 1.3 Total 100 Source: GNIDA Master Plan 2021 (Section 10.12) Source: Pre-Feasibility Study Report for Integrated Industrial Township at Greater Noida, July 2013 and Business Plan Report for IIT Greater Noida by CBRE, 2014 Figure 5-1: Recommended Land use Distribution for IIT as per GNIDA 5-1
, Green & Water bodies (13.4%) and Utilities (1.5%). However, it has been notified under section 10.")


102 It is reflected from both the exhibits that approximately 50.8% of the total land is allocated for Industrial use, 11% for Residential, 6.3% for commercial and approximately 32 percent combined for Roads (15.6%), Green & Water bodies (13.4%) and Utilities (1.5%). However, it has been notified under section of GNIDA Master Plan 2021 that the aforementioned land use distribution is subject to a variation of 10 15%. Keeping in view above requirements the Site Layout Plan options attempt to meet the prescribed land use budget within the permitted and acceptable tolerances. However, in the scenario, when it is deviated from the mentioned figures, the corresponding factors are noted and explained in the relevant section of this report Basis for Dense Vertical Development The Business Plan Report for IIT Greater Noida by CBRE, 2014 strongly recommended that there is a need for high rise development / buildings for the envisioned project. This is owing to the scarcity of land available for development, the dynamics of market demand and capital expenditure involved. It is further supported by latest development such as governments formal approval for implementation / constriction of Metro upto Boraki and Eastern Peripheral Express way, which will bypasses Delhi. Progressive cities such as Singapore, Bangkok, Kuala Lampur, Manhattan, etc. have FAR which varies between 5 and 50. Clustering of buildings in the form of tall buildings in densely built up areas is also recognized as efficient in terms of transportation and will help reduce carbon footprint. Thus to accommodate the requirements and finally achieve the vision of the project, higher FAR for the development of IIT is recommended. 5.3 Clients Vision The Client had formulated the vision for the Integrated Township as: To Develop a World Class, Globally Competitive Integrated Industrial Township at Dadri-Noida-Ghaziabad Investment Region of DMIC In accordance with the Client s Vision, the Consultant has articulated the Vision for Shaping up the Site Layout Plan as: Sustainable Sustainability is achieved through applying Sustainable Land use and Transportation Planning Principles with due respect to environmental and climatic considerations. It is also vastly governed by the sustainable solutions for all types of infrastructure such as water, waste water, solid waste management (RRR principles) and energy efficient power supply system to ensure reduction in carbon footprints of the entire development. Smart To Design and Plan A Sustainable, Smart and Safer World Class Integrated Industrial Township All the above basis and the vision for the project has laid the foundation for the Site Layout Plan formulation for IIT, which is discussed in the current and subsequent chapters of this report. A Smart City concept essentially means efficiency. But efficiency based on the intelligent management and integrated ICTs, and active citizen participation. Then implies a new kind of governance, genuine citizen involvement in public policy -Gildo Seisdedos Domínguez) Thus in order to create smart integrated township, there will be major emphasis on innovative technological solutions for ICT to manage governance, management and functioning of township activities. This would play a catalytic role to ensure high quality of life for its citizens and users. Safe Safety of the city does not indicate to only physical and social but also includes environmental and climate aspects. The integrated township is envisioned to provide safety through designing future proofed resilient communities, designing safer roads and streets, effective surveillance system and proficient urban management system. 5-2

; Transit Oriented Development by Institute for")
103 5.4 Planning Principles and the Concept d. Conducive to Linkages and External Connectivity of the Site Regional Context The consultant s vision for shaping the integrated industrial township has further set the path for configuring planning principles and the concept formulation for the master planning tasks. The overarching principles are enlisted as following: e. Sector/ Neighbourhood Concept Planning with Grid Iron Pattern Roads a. Sustainable Planning Principles adopted from various Guidelines Documents (Urban Development guidelines by Ministry of Urban Development (MOUD); Transit Oriented Development by Institute for Transportation and Development Policy (ITDP); Eco-Low Carbon Urban Planning Methodology by FCO Prosperity Fund, China s Ministry of Housing and Urban Rural Development (MOHURD) and Atkins; Sustainable Region Initiative, Vancouver; Charter for Sustainable Urbanism, Freiburg; Sustainability Principles of Spanish Urban Planning; Sustainable parameters for Low Carbon cities, Malaysia ) and benchmarking studies (detailed in previous chapter 4) f. g. Close-Knit Mix of land uses with sufficient Density and Diversity for Compact City Planning Resilient Planning, reducing Carbon footprints h. Promoting Walkability/ cycling through well designed, high quality landscaped spaces and public realm i. b. Complying to GNIDA Master Plan and its principles (elaborated in the forthcoming subsection) j. c. Due Consideration to Prevailing Wind Direction (NW to SE) to achieve Urban Ventilation through alignment of roads and streets. Each sector land parcel designed as self sustainable unit interlinked with other sectors through green connectors Modular Plot design for flexible planning and development approach through division/ amalgamation of plots as per investor requirement. Ensuring Safe Roads, Streets and Greenways through careful integration of land use & transport network with high quality urban design framework These principles are further represented in the Site Layout Plan options through: a. Designing Central spine as boulevard road b. Assigning Industrial zoning along Sector Roads and along Eastern Peripheral Expressway for High Visibility, Accessibility and Aesthetics Attractiveness c. Proposing Residential Zoning spread along sector roads conducive to adjoining land use, integrating with the urban fabric d. Proposing Commercial/Mixed Use Zoning along Central Boulevard with linear distribution GNIDA Master Plan influence on the Proposed Final Site Layout Plan The proposed Site Layout Plan options for the integrated industrial township overbear a strong inspiration from GNIDA Master Plan and its principles. The consultants Master Planning team has undertaken various studies of the reports, data, benchmarking best practices including site appraisal and inputs from field data. The resulting analyses has aided in preparing the Layout Plan options. These proposed Site Layout Plan options for the Integrated Industrial Township resembles a strong inspiration and commonalities from GNIDA Master Plan and its principles. These are explained as: 1. The Linear Shape The shape of GNIDA s administrative area is linear. The approximate ratio of linearity is 1:5. Similarly the site for IIT is linear shaped with the ratio as 1:4.5. Having noted these, the Master Planning team has followed the design philosophy of the parent region. Figure 5-3: Open Spaces in Site Layout Plan Figure 5-4: Linear Shape of the Project Site Figure 5-2: Predominant Wind-Direction NW to SE 5-3


104 2. Wind Direction, Road Alignment and Sector Planning GNIDA Master Plan 2021 is based on Sector Planning. The entire area is planned into various sectors pertaining to different land use categories. These sectors are connected through Sector Roads that are aligned in the prevailing wind direction, i.e. North-West to South-East. This arrangement enhances the flow of wind in the region and ensures urban ventilation in the built areas. In similar fashion, the Final Site Layout Plan Options are also designed with major roads aligned to the prevailing wind direction in the region. The roads are arranged in the grid-iron pattern which leads to the creation of sub-sectors within the project area. continuous green linear park planned along the central spine or the boulevard road. The green promenade along the canal and the interconnected sector level green open areas further strengthen this approach. Apart from these, there is a provision of Greenways designed as high-quality landscape areas and public realm for the comfort and safety of pedestrians and cyclists. The average sector size is 69 Hectare and the broad sector ranges from Hectare. 5.5 Cluster Conceptualization Each cluster is designed pertaining to the respective land use in a self-sustained sector manner. Each cluster is provisioned to cater to its sector user in terms of commercial uses, sector level recreational green all these to be accessed through greenways. The greenways are planned as Pedestrian and Cyclist walkways with high quality landscaping works. These add to the public realm of the overall development and at the same time create conducive environment for the cyclist and pedestrians to perform their activities. The suggested Cluster planning strongly reflects the design philosophy of compact city planning where mixed land use are planning in close-knit fashion. It creates and promotes balanced distribution of varied functions in a walking/ cycling radius. This in turn reduces motorized trips, reducing carbon footprints and achieving environmental and economic benefits. Figure 5-6: Land use Zoning Figure 5-5: Wind Direction and Sector Planning 3. Broad Land Use Zoning A careful look at GNIDA Master Plan infers that a. Industrial Zoning: is widely dispersed along the Delhi-Howrah existing railway line in North-South direction and in the southern areas along the proposed Eastern Peripheral Expressway in East-west alignment. The proposed Final Site Layout Plan replicates the same industrial zoning principles for the project area. b. Residential Zoning: The residential zoning is designated in the western land tracts and the central land parcels within the Greater Noida Area. In case of Final Site Layout Plan Options, the residential zoning is allocated on the western periphery along 60m wide Sector Road and to an extent in the central location of the site. c. Figure 5-7: Green Open Spaces and Linear Parks Green Open Areas/ Parks: In GNIDA Master Plan, there are huge forest areas in the south, green parks and spaces in the westernmost periphery and along the major transport corridors. These areas not only act as buffer from the roads, but also the lungs or breathing space for the planned region. This principle is adopted and replicated in the Final Site Layout Plan Options for the IIT wherein there is a 5-4


105 The typical Industrial and Residential Cluster is schematically represented in the following graphics. The approximate size considered for concept clusters of industries is 30 hectares and for residences is 20 hectares respectively. Residential Cluster Conceptualization Industrial Cluster ConceptualizationAt Sector level - showing interface between primary land use, retail and green open space. Public Park Greenways Commercial Frontage Greenways Collective Plot Green Collective Plot Green Commercial Frontage Public Park Figure 5-10: Residential Cluster - Concept Figure 5-9: Industrial Cluster - Concept 550m Varies from m x Varies from m x 500 Figure 5-8: Industrial Cluster - Sample Layout Figure 5-11: Residential Cluster - Sample Layout 5-5


106 5.6 Neighbourhood/ Sector Level Core Principles Accessibility Place-Marketing The aforementioned principles are further transformed at designing Sector/ Neighbourhood level through three key attributes Self Sufficiency, Integration and Accessibility which are elaborated as: Self Sufficiency a. Urban design accommodates public transport routes b. Street network planning and block size and orientation promote walkability a. Community focus at neighbourhood level through appropriate Land Use Mix and transport activity 5.7 Site Level Core Principles b. Layout of neighbourhoods provides local services and public facilities within walking distance in line with standards Following the hierarchy from Sector/ Neighbourhood level to the site level, the core principles are framed and achieved as elaborated: c. Coherent Open Space Network Mixed use district and neighbourhood centres are included a. Site Layout Plan planned to optimise saleability and aesthetics b. Multiple place making opportunities generated through design oriented land development c. Liaison with developers to encourage take up of sustainable building techniques d. Local employment opportunities are maximised Integration a. Design in adequate opportunities for formal and informal recreation a. Integrated neighbourhood development at all scales b. Provides an interlinked green-blue network maximising opportunities for walking and cycling routes b. Appropriate land use mix, adjacency and inclusion of contextual features c. c. Identifies locations for tree planting Integration with surroundings and existing structures 5-6


107 5.8 Distinct Features All the described planning principles and philosophy has culminated into shaping up the Final Site Layout Plans for the IIT. The distinct features adopted in the planning are depicted as under. Green Networks The Site Layout Plan accomplishes the green network through intricate linking of: Movement Place Markers The connectivity and movement within the township consists of: The place marking within the township is achieved through design and provision of: a. Motorised, non-motorised, Public transport, Emergency a. Public parks, Plazas, Pedestrian alleyways, Informal Sector Zones, Green buffer a. Landmarks, Nodes, Gateways, Junctions, Urban Edge 5-7
108 element is -12% implying that a 100% increase in street and junction densities results in a 12% reduction in VKT. Additionally, a 100% increase in street and junction density results in a 21-23% increase in transit ridership indicating that smaller city blocks also encourage pedestrian traffic and transit connectivity. A study by the Center for Environmental and Planning Technology (CEPT), in Ahmedabad indicates that walk trips constituted only 13 percent of all trips in neighborhoods with an average block size of 4 hectares, compared to 36 percent for similar neighborhoods with average block sizes of 1.2 hectares. 5.9 Transport Planning Principles '5D' Smart Growth Planning Principles Smart Growth is an urban management concept which promotes integration between land use and transport planning to create healthy, sustainable, and walkable urban spaces. Smart growth also emphasizes efficient uses of energy in buildings, transportation and other urban spaces. Design features essential to achieve smart growth have popularly come to be known as the 5Ds Density, Diversity (mixed-land uses), Design, Destination Accessibility and Distance to Transit. Density f. Distance to Public Transport Diversity 5 Ds Destination Accessibility Design Figure 5-12: Smart Growth Planning Principles a. Density Research suggests that all else being equal, denser developments generate fewer vehicle-trips per dwelling unit than less dense developments. Elasticity is a measure which is used in transport planning to measure the sensitivity of travel demand variables. The elasticity of the Density element is -4% implying that every 100% increase in residential density results in a 4% reduction in Vehicle Kilometers Travelled (VKT). Studies have also shown that a 100% increase in population results in a 7% increase in the use of public transport. d. Diversity Diversity refers to a balanced mix of residential land use, employment and retail centers. Placing residences, services and jobs in close proximity rather than several kilometres apart reduces vehicle trips. The elasticity of the Diversity element is -9% implying that every 100% increase in the housing to jobs ratio results in a 9% reduction in VKT. Additionally, a 100% increase in diversity increases public transport ridership by 12%. e. Design Pedestrian and NMV infrastructure improvements to roadways result in higher walking or non-motorized trips. Streets with better infrastructure such as lighting, benches and designed to provide eyes on the road are safer and generate more foot traffic than streets which are not pedestrian friendly. The elasticity of the Design Destination Accessibility Destination Access refers to the ease of reaching a destination of interest and depends on accessibility and mobility. Proximity to a regional center of activity and connectivity by pedestrian/nmv friendly infrastructure or public transport has a strong relation to vehicle kilometers travelled. Elasticity of the Destination element is -20% implying that increasing accessibility by 100% results in a 20% reduction in VKT. g. Distance to Public Transport Distance to Public Transport is a key parameter that influences the mode choice of commuters. Elasticity of this "D" element is -5% implying that reducing the distance to transit by 50% results in a 2.5% reduction in VKT. Additionally, studies have shown that halving the distance to transit results in a 29% increase in use of public transport. The same research revealed that in Washington and California, a decrease in transit ridership from 70% and 30% to less than 40% and 10%, respectively, was observed when the distance to transit was increased from 100 ft to 2500 ft or more. Ensuring smart urban growth requires fulfilling all of the 5D criteria. Together if density, diversity, design, accessibility and proximity to transit are increased by 100%, VKT can be reduced by 50% resulting in significant reduction in congestion, traffic accidents, and improvement in air quality. Although the elasticity for most of the "D" elements has not been estimated specifically for Indian conditions, their evaluation in other developing countries indicates that the principles will be equally applicable in the Indian context Transport Network Planning Principles and international guidance documents such as the Study on Traffic and Transportation Policies and Strategies in Urban Areas in India published by the Ministry of Urban Development, the Code of Practice published by the Institute of Urban Transport (India) and Designing of Walkable Urban Thoroughfares published by the Institute of Transportation Engineers. A brief description of transport network planning principles is provided below: a. Connectivity: This principle involves providing direct routes between origins and destinations while ensuring multi-modal connectivity especially between nonmotorized modes of transport and public transport services. b. Dense Network: This principle involves providing more than one routes, where feasible, between origins and destinations. This strategy helps in dispersing traffic along multiples routes instead of concentrating it on one roadway. c. Access Management: This principle involves minimizing access along major arterials by providing alternate access to sites through strategic use of service lanes and collectors. d. Junction Spacing: This principle involves ensuring optimum junction spacing to ensure directness and shorter routes between origins and destinations for motorized and non-motorized modes of transport. e. Safe Crossing Points: This principle involves providing signalized crossings to enhance safety for pedestrians and cyclists and provide priority to public transport. The above mentioned principles can be quantified using accessibility indices recommended by the ITE. A brief description of these indices is provided below: a. Link-to-Node ratio: This index measures the quality of connectivity of a transport network for all modes of transport. As shown in Figure 5-14, adding an extra (diagonal) link to Network A improves connectivity between Points A and B and increases the Link-to-Node ratio from 1.0 to The ITE recommends that networks should have a minimum Link-to-Node ratio of 1.4. The transport network planning for the proposed IIT was based on a comprehensive multi-modal approach to provide a modern and sustainable transport plan for the proposed IIT. The planning approach was based on recommendations provided in national 5-8


109 are considerably higher in India compared to most western countries. Therefore, commuters in India are likely to tolerate spacing of up to or even more than 500 meters. This assumption is based on household surveys conducted by RITES as part of the Greater Noida Transport Master plan which indicates that residents of Greater NOIDA were willing to walk up to 500 meters to reach the nearest bus stop. d. Directness Index: As shown in Figure 5-16, directness index measures the directness of the route connecting the start and the end location. It is the ratio of the actual distance traveled and the direct distance. The ITE recommends that this ratio should be less than 1.5. Figure 5-13: Link to Node Ratio b. Junction ratio: This index measures the quality of connectivity and directness of a transport network. As shown in Figure 5-15, replacing the cul-de-sacs in Network A with T-junctions improves connectivity between Points A and B and increases the junction ratio from 0.67 to 1.0. The ITE recommends that junction ratio of networks should be more than Figure 5-16 Directness Index Figure 5-15: Directness Index In this chapter, the planning principles and the concept for the proposed Final Site Layout Plan for the IIT are explained in detail. In the sub-sequent chapter, these Final Site Layout Plan Options are elaborated further- in which the application of the framed planning principles are demonstrated. Figure 5-14: Junction Ratio c. Arterial/Sub-Arterial junction spacing: The ITE recommends a maximum intersection spacing of 200 meters. However, it may not always be possible to provide a spacing of 200 meters between junctions. As an alternative, street design should be modified to provide visual breaks in long sections of a roadway. This strategy can help overcome the disbenefits associated the long roadway sections. It should be noted that walk trips 5-9

 is included as Appendix A (Stakeholder s Consultation).")
110 6. Final Site Layout Plan Options This chapter details out the features and provisions for Final Site Layout Plan Options for the subject project. These options are based on the approach and principles illustrated in the previous chapter. 6.1 Background There have been three driving factors for shaping up the Site Layout Plan Options Planning Approach and Principles (including bench marking studies), Stakeholder Consultations, and Internal Team Workshops. The first aspect is already elaborated in the previous chapter. The outcome of the second aspect, i.e., Stakeholder Consultations (primarily SPV GNIDA and DMICDC) is included as Appendix A (Stakeholder s Consultation). The Master Planning team has worked out several options which were discussed with GNIDA and the major feedback is noted and incorporated to arrive at the Site Layout Plans. The consultants team has also carried out internal workshops including all the sector experts to take into account crucial aspects for key decisions at the initial Master Planning stage. This has ensured inclusive planning approach for this project. 6.2 Site Layout Plan Option 1 The conceptual theme for Option 1 is based on geometric forms. The Layout plan is designed whilst taking cognizance from the existing built infrastructure and site features such as built road network, 220 KV and 132KV HT lines, existing settlement, religious and sensitive structures, pond etc. The sectors formed through the proposed road network are detailed further with modular plots. The design theme concentrates around the Central Spine designed as Boulevard Road. It acts as the main artery serving to the entire site and connects the northern land parcels to the remaining development through a proposed bridge over the canal. This central spine is flanked by continuous linear green park on its both sides. This linear park is designed to create a visually appealing effect as well as unique identification to the entrants through distinct landscape design for each cluster block/ sector. It would also impart a visual identity to the respective sector. The linear park widens up in the south-central part prior to terminate at the southern end of the central spine. (Figure 6-1). These green open spaces not only present themselves as breathing spaces but they too impart multi-functional role in the entire development. These spaces a. Enhance the aesthetics of the urban fabric b. Act as buffer between residential and industrial uses and at the same time provide medium for recreational/ leisure activities c. Accommodate existing sensitive structures on the site d. Provide spaces for accommodating sustainable infrastructure components such as recharge wells Figure 6-1: IIT Site Layout Plan - Option 1 6-1
111 The central spine was previously intersected by three sets of access roads (running east-west), which created a grid pattern. The grid patterned road network is still retained in the revised project area plan, with four sets of access roads running east-west. The primary landuses are zoned through this arrangement. The proposed road network for Option 1 is moreover based on the alignment of existing built roads. Almost 45% of built roads are retained in this case (this is further elaborated in the subsequent chapter on Proposed Transportation Network ). This Option provides green buffer of 27m for 132 KV High Tension Line which traverses on a small stretch along the north eastern periphery of the site. Another green buffer of 35 m is reserved for the 220 KV HTL which is present along the eastern edge of the 60m wide GNIDA road in the northern part of the site. This option proposes water utility areas adjoining Ajayabpur Village. This arrangement helps in catering to the water distribution network within the site, where the water supply will be sourced from Upper Ganga Canal. The provision for other utilities STP and Solid Waste transfer site are made at the extreme southern periphery of the site. This is to ensure that odour nuisance generating out of these premises would not impact the users of the development. Another STP is proposed at the eastern corner south of elbow road in order to cater to the linear site. STP location ensures an odour free and nuisance free environment to the user Option 1 Final Site Layout Plan Features a. Grand Main Entrance on both sides from 80 m Sector Road b. Canal Promenade to enhance the Urban Fabric of the place pleasing aesthetics before entering the township c. Central Spine designed as Boulevard Road with varied landscape features imparting unique identity to each sector and creating dramatic impact on the users d. Multiple Access Points Separate Entries for Industrial and Residential Activities e. Continuous Linear Park along the Central Spine f. Pedestrian/ Cyclist friendly development through Greenways g. Each Landuse Industries and Residences planned into Separate Clusters/ Sectors. h. Half of the built roads retained i. j. Hi-Tech (Type A-Flatted) Industries Low-rise Buildings along the sector roads and at the junction (Refer Figure 6-1) Hi-tech (Type B-IT/ITES) Industries High-rise Signature Buildings at the entrance and along the Central Spine (Refer Figure 6-1) k. Bio-tech Industries - Mid to high rise buildings along the sector road and the proposed expressway (Refer Figure 6-1) l. R&D Industries Mid-rise landmark structures distributed in linear fashion along the railways and also along the central spine road. (Refer Figure 6-1) n. Tall Residential Towers designed around the central green spaces and the sector roads. These are primarily concentrated on the western periphery of the site, away from the high noise zone of the railways. The residential parcels in the northern part are also situated along the western periphery conducive to adjoining residential zoning in GNIDA. o. Carefully designed green spaces to offer leisure, relaxation and informal interactive spaces for employees as well as the residents. The plan ensures easy approach to Ajayabpur Railway Station, existing railway crossing, existing and adjacent settlement of Rithori. This option strongly demonstrates compact city planning and resilient city planning principles the key to accomplish sustainable plan. The mix of various land uses in a self sustained cluster block ensures accessible through pedestrian/ cyclist friendly greenways promoting walkability and reducing carbon footprints. The proposed road network, the corresponding principles and associated details are illustrated separately in the subsequent Chapter Proposed Transportation Network Proposed Land use Distribution Option 1 The percentages are calculated with and without considering the sector roads. The reasoning is already explained in Chapter 2. GNIDA Sector Roads occupies significant area within the project extents. Therefore to achieve the design basis of Landuse distribution (Per Section 10.12), it is quite logical to exclude the Sector Road area whilst calculating the achieved landuse distribution percentages. Moreover, it is clearly mentioned is the GNIDA Lease Plan that no FAR will be permitted on the Sector Roads. Thus in both the calculations of Landuse Distribution and Global FAR, the Sector Roads are excluded. (Note: This aspect was discussed at length with the Client and the same was consented) The proposed land use distribution, the land use distribution for Option-1 is exhibited in Error! Reference source not found. nd graphically represented in Figure 6-2. m. Commercial buildings high-rise modern structures along the central spine road and 60 m E-W road. CBD is proposed in the heart of the township. 2 Table 6-1: Proposed Land use Distribution for Site Layout Plan Option 1 Land Use Category Area (ha) % Distribution excluding Sector Roads Industries Hi-tech (Type AFlatted) Industries Hi-tech (Type BIT/ITES) Industries Bio-Tech Industries R&D Commercial Mixed Use Residential Group Housing Residential EWS Housing Total Residential Utilities Green Open Spaces IIT Internal Roads Sector Roads TOTAL It is observed from the above table, that the proposed land use under Industries is the highest with 46%, followed by green open spaces with 19.18%, Internal roads (17%), Residential 8.81%, Commercial as 6.14 %. Within the Industries, highest share is allocated to R &D (15.63%), with Hi-tech (Type A-flatted) and Bio-Tech Industries having relatively lower share (with and 11.14%); Hi-tech (Type B-IT/ITES) Industries contributes to c. 9% of the total landuse of the site. The following chart demonstrates the Proposed Landuse Distribution for Option 1 vis-à-vis the Landuse Budget as laid out in GNIDA Master Plan.

, whereas the percentage of roads are nearly matching (16% to 16.98%). Moreover the percentage of green open spaces achieved is high (19.")
112 Landuse Distribution - Option Hi Tech (Type A-flatted) Industries Bio-tech Industries R&D Hi Tech (Type B-IT/ITES) Industries Commercial/ Mixed Use Residential - Group Housing Residential - EWS Housing Open Spaces Utilities 0.75 Internal Roads Whilst comparing the above two figures and the statistics, it is broadly observed that in the Proposed Option, the percentage of Industries and Residential distribution achieved is low (i.e 45.96% against 50.8% and 9.55% against 11% respectively), whereas the percentage of roads are nearly matching (16% to 16.98%). Moreover the percentage of green open spaces achieved is high (19.24% against 13%). The rest of the land uses such as commercial, roads, etc. are tallying with those of the prescribed one. The Industrial area percentage in the Proposed Option are compromised in the process of plan formulation, to provide significant green buffer (for HT line, for canal, in between industrial and residential uses) as a mandatory compliance to the respective regulations, norms and standards. As a result, the percentage of green spaces (19.24%) has exceeded the recommended figure of 13%. However the current 45.96% of Industrial land use distribution is within the deviation range (10-15% from the corresponding budgeted figure) mentioned in the GNIDA Master Plan 2021, Section Figure 6-2:.Pie Chart showing Proposed Landuse Distribution for Option 1 Proposed Landuse Distribution vis -a-vis Landuse Budget for Option 1 Master Plan (Internal) Roads Utilities Total Open Space Total Residential Commercial/ Mixed Use Total Industries 0 10 GNIDA Sec Proposed for IIT_Dadri Figure 6-3: Proposed Landuse Distribution for Option 1 vis-à-vis the Landuse Budget 6-3
113 6.2.3 Resident Population Estimation Option 1 The resident population for the project are based on the prevailing FAR values as per GNIDA Building Regulations for the initial phase of the project. The projections for Option 1 are tabulated in the Table However it is envisaged for the project that during the subsequent phase, as the IIT will be operational, it would generate more demand and at that stage, there will be need for articulated FAR Values. Therefore for the next phase, the enhanced FAR values and resident population is projected and depicted in Table 6-3. Note: It is envisaged for this iconic development, the total permissible Global FAR will be 2.5 (per design basis and Client s requirement). In order to meet these development demands, the respective FAR values for the various Landuse categories are articulated and enhanced as depicted in the Table 6-3. Also refer to Final Urban Development Framework Report submitted along with this report for details on development typologies. Table 6-3: Projected Resident Population for Option 1: Future Phase Table 6-2: Projected Resident Population for Option 1: GNIDA FAR Values Sr. No Land use Category Residential Group Housing Residential EWS Housing Total Plot Area (ha) Proposed FAR Total Built-up Area (ha) Population Generation/ Unit 4.5 persons/ dwelling unit 4.5 persons/ dwelling unit ** Proposed Employment Generation and Population Sr. No Land use Category Residential Group Housing Residential EWS Housing Total Plot Area (ha) Proposed FAR Total Built-up Area (ha) Population Generation/ Unit 4.5 persons/ dwelling unit 4.5 persons/ dwelling unit** Proposed Employment Generation and Population 38, ,966 Total 28,962 Total Total Project Area Gross Density 96 persons/ ha *Assuming Average DU area 150 sq m; **Assuming Average DU area 40 sq m Source: Consultant s Calculations based on prevailing FAR Values Total Project Area Gross Density 142 persons/ ha *Assuming Average DU area 150 sq m; **Assuming Average DU area 40 sq m Source: Consultant s Calculations based on articulated FAR Values The table statistics reveal that the total residential population is c (round off) per the prevailing FAR values. However, in future for the subsequent phase, the resident population is expected to be 43,000 (round off). (Note: This is subject to future demand and approval of the articulated FAR values). In both the cases, the gross density of the project varies from 96 pph to 142 pph. In the future phase, the gross density of the development achieved will be close to the density recommended by MOUD (175 pph). Figure 6-5: Proposed FAR for Option 1 Figure 6-5 and Figure 6-4 give a visual idea of the arrangement of FAR zones for future phase (subsequently leading to high density area) in the proposed Final Site Layout plan. It is clearly observed that the land use category with higher FAR is zoned along the central spine (transit corridor), and subsequently the lower FAR zones are zones away from the corridor. This gives a scenario where more number of people is forecasted to get easy accessibility. The building height arrangement gives an idea of the massing for the proposed site area. The distribution of the industries is such that Hi-Tech industries which are flatted industries are placed at the northern part and a gradation in terms of increase in FAR is observed in R&D, Bio-Tech and Hi-tech (Type B- as one move from northern to southern part of the site. Doing this helps to accommodate the prevailing wind direction to achieve Urban Ventilation through gradation in FAR. 6-4
114 Figure 6-4: Proposed Building Height for Option 1 Site Layout Plan Figure 6-5: Proposed FAR for Option 1 Site Layout Plan 6-5

. This option provides improvised walk to - work opportunity through master planning.")
115 6.3 Site Layout Plan Option 2 The Site Layout Plan Option 2, adopts the same planning approaches and principles as that of Option 1 with the enhancement that it looks forward to more design responsive approach. The compact city planning approach is adopted here as well, with a motive to develop- sustainable urban communities. The site being very linear in shape, the commercial and the residential uses are proposed at the intermediate levels so as to have wider catchment of facilities and work places through walking distance. (Refer Figure 6-6). This option provides improvised walk to - work opportunity through master planning. Thus in order to achieve the same, the residential is proposed in three different locations within the site, complemented with commercial uses. Similar to Option 1, the design theme concentrates around the Central Spine designed as Boulevard Road. This is owing to the fact that the site is currently divided into two uneven land parcels by the proposed 80m sector road which has to be integrated together through appropriate planning and design measures. The functions and features of this central spine remain the same as that in the first option. On similar lines linear park flanking the central spine is designed to create a visually appealing effect as well as unique identification to the entrants through distinct landscape design for each cluster block/ sector. There are two main township level green spaces designed as curvilinear shapes in order to break the monotony of the geometric shapes of the zones. One of these public green spaces is proposed at the entrance adjoining the 80m wide GNIDA road which would offer a pleasant visual appeal and also create an entrance plaza for the township. The complementary public green space at the western side of the central spine at the entrance serves well as a public park for the proposed adjoining residential and commercial development. The other set of public green spaces are designed at the southern end of the township which are semi-circular in shape and achieves balances and symmetry in the Layout plan design. The continuous linear park along the central boulevard road ensures green connectivity within the township. The four industries are distributed into distinguished clusters along the linear site. Hi-Tech industries in the northernmost or upper part; IT Industries along both sides of the 80m entrance road; R&D industries occupy the central part and Bio-Tech industries are laid out in the southern or lower part of the site. The residential areas are proposed in similar fashion, accessible from all 4 types of industries. CBD core is designed strategically in the heart of the township. Similar to Option 1, this option proposes water utility areas along the central spine road near Ajayabpur Village with the assumption that the water demand for the development would be sourced from Upper Ganga Canal. This location also acts as a central location within the site and thus facilitates in water distribution to various plots, thereby achieving cost efficiency. The Solid Waste transfer site is proposed at the north-western corner of the IIT owing to its secluded location near the railway tracks and away from settlement which will avoid all sorts of odour nuisance. This option does not provide STP within the site. However, as suggested by the Client), the sewerage generated within the IIT will be taken to the central STP of GNIDA Authority (the details are elaborated in Chapter 8). Figure 6-6: Proposed Site Layout Plan Option 2 for Integrated Industrial Township 6-6

116 6.3.1 Option 2 Site Layout Plan Features a. Grand Main Entrance on both sides from 80 m Sector Road b. Central Spine designed as Boulevard Road with varied landscape features imparting unique identity to each sector and creating dramatic impact on the users c. Canal Promenade to enhance the Urban Fabric of the place pleasing aesthetics before entering the township d. Multiple Access Points with only 50 % of built roads retained e. Continuous Linear Park along the Central Spine and Vibrant Central Park f. Pedestrian/ Cyclist friendly development through Greenways g. Residential Clusters are planned distantly (at three locations, viz at the junction of main entrance and 60 m sector road; whilst the other along western side of central spine road, adjoining the central park within the site, and at the north-western corner of the site) to tap the location potential. The proposal ensures high pedestrian connectivity from Home to Work. Hi-Tech (Type A-Flatted) Industries Signature Buildings at the Entrance, along the Sector Roads and Central 60 m elbow road located in northern/upper land parcels (Refer h. Figure 6-6) Hitech (Type B-IT/ITES) Industries High-rise Signature buildings at the entrance imparting impressive aesthetics right at the strategic location (Refer i. Figure 6-6) Bio-tech Industries - Mid to high rise buildings along the sector road and the Expressway almost occupying southern land parcels located in southern/lower land parcels. (Refer j. Figure 6-6) R&D Industries Mid rise landmark structures occupy the central areas on the eastern side of the central spine road located in central land parcels. (Refer The plan ensures easy approach to Ajayabpur Railway Station, existing railway crossing, existing and adjacent settlement of Rithori. This option strongly demonstrates compact city planning and resilient city planning principles the key to accomplish sustainable plan. The mix of various land uses in a self sustained cluster block ensures accessible through pedestrian/ cyclist friendly greenways promoting walkability and reducing carbon footprints. The walkability distance at the sector level is 500m while at the neighbourhood level is 250m. The proposed road network, the corresponding principles and associated details are illustrated separately in the subsequent Chapter Proposed Transportation Network. Land Use Category Area (ha) % Distribution excluding Sector Roads Total Industries Hi-tech (Type A-flatted) Industries Hi-tech (Type B-IT/ITES) Industries Total Area Total Area (Excluding Sector Roads) % Figure 6-7:.Pie Chart showing Proposed Landuse Distribution for Option 2 Landuse Distribution - Option 2 Hi Tech (Type Aflatted) Industries Bio-tech Industries R&D Hi Tech (Type BIT/ITES) Industries Commercial/ Mixed Use Residential Group Housing Residential - EWS Housing Open Spaces Utilities Internal Roads Commercial Mixed Use Residential Group Housing n. Carefully designed green spaces to offer leisure, relaxation and informal interactive spaces for employees as well as the residents Residential EWS Housing o. The plan offers multiple access to the entire development Total Residential Utilities Green Open Spaces Sector Roads p. A CBD strategically located in the heart of the township caters primarily for industrial set-up housing Business Pavilion, Convection Centre, Exhibition Pavilion, star rated Hotels and Offices, including ample retail shops. The CBD core is designed to impart distinct character to the entire township, flanked by signature buildings demonstrating world-class architectural marvel m. Tall Residential Towers designed around the green spaces at the entrance and along the western periphery of the site R&D Commercial buildings high-rise modern structures along the central spine road and 60m E-W road along the high speed transit corridor Site Layout Plan Roads Table 6-3: Proposed Landuse Distribution for Site Layout Plan Option l. % Distribution excluding Sector Roads Based on the proposed land use arrangement, the land use distribution is depicted in the following Table 6-4 and graphically represented in Figure Figure 6-6) Area (ha) Proposed Land use Distribution Option 2 Bio-Tech Industries k. Land Use Category 6-7 It is observed from the above table, that the proposed land use under Industries is the highest with 50.77%, followed by green open spaces with 15.4%, Residential 10.43%, Commercial as 5.83%. Within the Industries, highest share is allocated to R &D (15.57%), with Hi-tech (Type A Flatted) and Bio-Tech Industries having relatively lower share (with and 11.46%); Hi-Tech (Type B IT/ ITES) Industries contributes to c. 10% of the total landuse of the site. The total saleable land area amounts to approximately 67% of the total site area (excluding sector roads). The following chart demonstrates the Proposed Landuse Distribution for Option 2 vis-à-vis the Landuse Budget as laid out in GNIDA Master Plan.
117 Table 6-4: Projected Resident Population for Option 2: GNIDA FAR Values Proposed Landuse Distribution vis -a-vis Landuse Budget for Option 2 Sr. No Master Plan (Internal) Roads Utilities 4. Residential Group Housing Residential EWS Housing Total Plot Area (ha) Proposed FAR Commercial/ Mixed Use Total Project Area Gross Density 113 persons/ ha *Assuming Average DU area 150 sq m; **Assuming Average DU area 40 sq m Total Industries 4.5 persons/ dwelling unit 4.5 persons/ dwelling unit ** Total Total Residential Population Generation/ Unit rate Proposed Employment Generation and Population 34, Total Open Space 20 GNIDA Sec Source: Consultant s Calculations based on prevailing FAR Values Table 6-5: Projected Resident Population for Option 2: Future Phase 60 Proposed for IIT_Dadri Sr. No. Figure 6-8: Proposed Landuse Distribution for Option 2 vis-à-vis the Landuse Budget 1. Referring to Table 6-4, and the respective statistics of Budgeted vis-à-vis Proposed, it is broadly observed that in the Proposal Option, the percentage of Industries is achieved (50.77% and 50.82%). All the percentage distribution lies within the variation range of 10-15% as stated in Section of GNIDA Master Plan. Thus, this Option ensures compliance to the Landuse Requirements as per GNIDA Master Plan 2021, Section for the IIT Land use Category Total Built-up Area (ha) 2. Note: It is envisaged for this iconic development, the total permissible Global FAR will be 2.5 (per design basis and Client s requirement). In order to meet these development demands, the respective FAR values for the various Landuse categories are articulated and enhanced as depicted in the Table 6-4. Also refer to Final Urban Development Framework Report submitted along with this report for details on development typologies. Residential Group Housing Residential EWS Housing Total Plot Area (ha) Proposed FAR Population Generation/ Unit 4.5 persons/ dwelling unit 4.5 persons/ dwelling unit ** Proposed Employment Generation and Population 38, ,126 Total Resident Population Estimation Option 2 The resident population for the project are based on the prevailing FAR values as per GNIDA Building Regulations for the initial phase of the project. The projections for Option 2 are tabulated in the Table 6-4. However it is envisaged for the project that during the subsequent phase, as the IIT will be operational, it would generate more demand and at that stage, there will be need for articulated FAR Values. Therefore for the next phase, the enhanced FAR values and resident population is projected and depicted in Table 6-5. Land use Category Total Built-up Area (ha) Total Project Area Gross Density 159 persons/ ha *Assuming Average DU area 150 sq m; **Assuming Average DU area 40 sq m Source: Consultant s Calculations based on articulated FAR Values The table statistics reveal that the total residential population is c (round off) per the prevailing FAR values. However, in future for the subsequent phase, the resident population is expected to be 48,000 (round off). (Note: This is subject to future demand and approval of the articulated FAR values). In both the cases, the gross density of the project varies from 113 pph to 159 pph. In the future phase, the gross density of the development achieved will be close to the density recommended by MOUD (175 pph). Figure 6-9Figure 6-5: Proposed FAR for Option 1 and Figure 6-10 give a visual idea of the arrangement of FAR zones for future phase (subsequently leading to high density area) in the proposed Final Site Layout plan. It is clearly observed that the land use category with higher FAR is zoned along the central spine (transit corridor), and subsequently the lower FAR zones are zones away from the corridor. This gives a scenario where more number of 6-8
118 people is forecasted to get easy accessibility. The building height arrangement gives an idea of the massing for the proposed site area. The distribution of the industries is such that Hi-Tech (Type A) industries which are flatted industries are placed at the northern part and a gradation in terms of increase in FAR is observed in R&D and Bio-Tech as one move from northern to southern part of the site. Doing this helps to accommodate the prevailing wind direction to achieve Urban Ventilation through gradation in FAR. Figure 6-10: Proposed Building Height for Option 2 Site Layout Plan Figure 6-9:Proposed FAR for Option 2 Site Layout Plan 6-9
 Industries would be typically flatted single storey industries to G+ 1 storey Structures with building height upto 10m.")
 Industries In both the options, some of the Hi-Tech Industries are proposed on the northern land parcels and some along the 80m and 60m Sector")
 b.")
 and to the proposed linkages with DNGIR in the east d.")
119 6.4 Proposed Urban Fabric This section illustrates the proposed urban fabric for various land use typologies that are envisaged for the proposed flagship development. Hi-Tech (Type A) Industries would be typically flatted single storey industries to G+ 1 storey Structures with building height upto 10m. The adjoining images demonstrate the precedents urban fabric envisaged for Hi-Tech (Type A) industrial building Hi- Tech (Type A-flatted) Industries In both the options, some of the Hi-Tech Industries are proposed on the northern land parcels and some along the 80m and 60m Sector roads. The suggested land parcels possess the strong potential advantages. (Refer Figure 6-12 and Figure 6-13):a. The first type of industries to be approached from the direction of growth (Delhi and other sectors of Noida) b. Visual attractiveness along the proposed 80m Sector Road and Existing 60m Sector Road c. The best connectivity to the existing developed area (west) and to the proposed linkages with DNGIR in the east d. Merges with the surrounding urban fabric Ansals Hi-Tech City in the vicinity to the east of railway line Figure 6-12: Proposed Hi-tech (Type A) Industry in Option - 2 Final Layout Plan Figure 6-13: Illustrative view showing the Hi-Tech (Type A) industries cluster Figure 6-11: Proposed Hi-tech (Type A) Industry in Option 1 Final Layout Plan 6-10

 a.")


120 6.4.2 The adjoining images demonstrate the precedents urban fabric envisaged for Bio-Tech industrial building. Bio- Tech Industries The Bio-Tech Industries occupy the similar land parcels in both the options. These Industries are located mostly on the southern periphery along the proposed Eastern Peripheral Expressway. The suggested land parcels possess the strong potential advantages. (Refer Figure 6-15 and Figure 6-16) a. Visual attractiveness along the proposed expressway b. Separate entrance from the 60 m sector road providing direct connectivity to the industries c. Offers connectivity to the proposed linkages with DNGIR in the east Bio-Tech Industries are envisaged to be mid to high rise buildings with height varying from G+8 to G+10 storeys of approx 36m high. Figure 6-15: Proposed Bio-tech Industry in Option - 2 Final Site Layout Plan Figure 6-16: Illustrative view showing the Bio-Tech industries cluster Figure 6-14: Proposed Bio-tech Industry in Option - 1 Final Site Layout Plan 6-11


121 6.4.3 The adjoining images demonstrate the precedents urban fabric envisaged for Bio-Tech industrial building. R & D Industries The R & D accommodates eastern peripheral land parcel in Option-1 whilst they are proposed in the central land parcels in Option-2. These industries are planned close to the Bio-Tech Industries simply due to the symbiotic nature of these two types of industries. It is recommended in the Pre-Feasibility Study Report that the output of one industry will form the input for other type of industry. The interdependent nature of these typologies will eventually lead in generating minimum industrial waste of the entire development. The R&D Industries are located on the eastern periphery along the existing railway line as well as on the prime locations abutting the Central Spine. R&D Industries are envisaged to be mid to high rise buildings with height varying from G+10 to G+12 storeys with height reaching upto 52m. This is typically due to the proposed stacking or vertical functioning of these industries. (Refer Figure 6-18 and Figure 6-19) Figure 6-18: Proposed R&D industries in Option 2 Final Site Layout Plan Figure 6-19: Illustrative view showing the Bio-Tech industries cluster Figure 6-17: Proposed R&D industries in Option 1 Final Site Layout Plan 6-12


 f.")

 industrial")
 and to the proposed linkages with DNGIR in the")
122 6.4.4 Hi-tech (Type B-IT/ITES) Industries In the first Option, the IT industries are planned at the approach of proposed 80m sector road and along the initial stretch of vibrant Central Spine road. Whilst in Option 2, they are zoned right at the approach of either sides of 80m Sector road. They enjoy the strategic location and are designed at the canal water front merged with the entry level central park. The suggested land parcels possess the strong potential advantages. Refer Figure 6-21 and Figure 6-22 e. The first type of industries to be approached from the direction of growth (Delhi and other sectors of Noida) f. Hi-tech (Type B IT/ ITES) Industries would be the highest structures amongst the industrial category. The Signature towers will be designed for the height varying achieved as G+14 storeys with approx 55m tall buildings. The adjoining images demonstrate the precedents urban fabric envisaged for Hi-tech (Type B) industrial buildings. Visual attractiveness along the proposed 80m Sector Road and along the Vibrant Central Spine road g. The best connectivity to the existing developed area (west) and to the proposed linkages with DNGIR in the east h. Canal waterfront offering the high quality public realm for the users Figure 6-21: Proposed Hi-tech (Type B) Industries in Option 2 Final Site Layout Plan Figure 6-20: Proposed Hi-tech (Type B) Industries in Option 1 Final Site Layout Plan Figure 6-22: Illustrative view showing the Hi-tech (Type B) industries cluster 6-13
 and the proposed expressway in the south.")


 Figure 6-24: Proposed Residential use in Option 2 Final Site Layout Plan Figure 6-25: Illustrative view showing the Residential Cluster Figure 6-23: Proposed")
123 6.4.5 Residential Clusters The Residential Clusters are planned along the western periphery of the project site in both the options. This is the strategic location for residential use away from the high noise zone of the railways (in the east) and the proposed expressway in the south. In case of first option, the residential clusters are located closer separated by central elbow shaped 60m road, though imparting a visual identity to those land parcels. This road acts as a separate entry to the residents and thus segregating the industrial and residential traffic. In case of second option, one of the residential clusters is moved towards the entrance along the 80m sector road. This location offers a good potential along the canal promenade as well as it merges will with the existing urban fabric of the Greater Noida Sector. In the second option, residential land parcels are located in 3 distant location, which effectively distributes the pedestrianized trips to work, thus strengthening walk-to-work concept. (Refer Figure 6-24 and Figure 6-25) Figure 6-24: Proposed Residential use in Option 2 Final Site Layout Plan Figure 6-25: Illustrative view showing the Residential Cluster Figure 6-23: Proposed Residential use in Option 1 Final Site Layout Plan The adjoining images demonstrate the precedents urban fabric envisaged for Residential buildings. The proposed FAR values are 5.5, however taking the cognizance of the current real estate sector in the vicinity, the proposed height for these developments are envisaged as G+ 20 tall structures (80m high). These are the highest building typologies in the entire development. 6-14


.")
 in which the buildings would be located.")

124 6.4.6 Commercial Buildings The concentration of commercial land use is widely in a linear fashion along the proposed central spine of the IIT. The central spine being the high speed corridor is the ideal avenue for proposing high-density zones and uses. Some of the commercial zones are proposed on 60m central elbow shaped road and also other internal roads of 45m width. The proposed FAR for this zone is 5.25 which further justify the assigned locations. The proposed height for these developments is envisaged as G+16 to G+20 tall structures. These are the second highest building typologies in the entire development (60 80m high). The adjoining images demonstrate the precedents urban fabric envisaged for Commercial buildings. Within the commercial zones, there would be sub-categories depending on the sector (residential/ industrial) in which the buildings would be located. This means, if the commercial zone is falling in residential sector, the permitted uses would be retail, Food courts/ dining, supermarkets, small commercial developments/ offices, health clinic, hospital etc. If such land parcels are located in the industrial sector, they would cater to hotels, convention centres, business centres, offices, institutions, retail, food court etc. to support the primary land use. (Refer Figure 6-27 and Figure 6-28). Figure 6-26: Proposed Commercial Use in Option 1 Final Site Layout Plan Figure 6-27: Proposed Commercial Use in Option 2 Final Site Layout Plan 6-15


125 6.4.7 Green Open Spaces As explained in the previous sections of this report, there are ample green open spaces provided in the entire development. The typologies and hierarchy of green spaces could be termed as entrance canal promenade, linear green park along the central spine, central green spaces, green buffer areas etc. which are broad site level green open spaces. At sector level, each plot or collective plots will have the green spaces for the respective functions. The function and landscape design of each of these typologies will be varied and distinct. The general development guidelines for these spaces are dealt separately in Development Guidelines for the entire Site Layout Plan. The proposed plan offers carefully designed green spaces to offer leisure, relaxation and informal interactive spaces for employees as well as the resident. The central spine is flanked by continuous linear green park on its both sides. This linear park is designed to create a visually appealing effect as well as unique identification to the entrants through distinct landscape design for each cluster block/ sector. It would also impart a visual identity to the respective sector. The linear park widens up in the south-central part prior to terminate at the southern end of the central spine) Figure 6-28: Proposed Green Spaces in Option-1 Final Site Layout Plan Figure 6-29: Proposed Green Spaces in Option-2 Final Site Layout Plan 6-16


126 Figure 6-30: Illustrative view showing Core Figure 6-31: Illustrative view showing Entrance Cluster Figure 6-32: Illustrative view showing Central Park cluster 6-17
127 This chapter has detailed out two Site Layout Plan taking into consideration various concepts as discussed in the previous chapter and various smart city standards derived from benchmarking. Based on the Layout plan the further transport and infrastructure proposal has been presented in the next chapter and cumulative assessment for both the Site Layout Plan options are presented in the final chapter. 6-18
128 7 Transportation 7.1 Introduction separated junction over the 45m ROW North-South Road and will continue across the railway line as an elevated road. This arrangement will allow the road to function as an internal road for the IIT as well as serve regional traffic destined to locations east of the railway line. Transport planning concepts described in Section 5.9 were used as guiding principles to plan the transport network for IIT Layout Plan options 1 and 2 within the following constraints. This section provides details of the proposed transport network and provides a comparative summary for Options 1 and Roadway Classification As stated previously, this road will provide regional connectivity between Greater NOIDA and the proposed IIT and DNGIR. In addition, the road will also connect DNGIR with NOIDA, Agra and New Delhi via the Yamuna Expressway. As shown in Figure 7-1 (Option 1) and Figure 7-2 (Option 2), roads in the vicinity of the IIT have been classified into categories such as arterials, sub-arterials, primary collectors, secondary collector, and NMT routes in accordance with the definitions provided in GNIDA's 2021 Master Plan. A detailed discussion on roadway classification follows: a. Arterials - According to the GNIDA 2021 Master Plan, roads classified as Arterials provide regional linkages to Greater Noida expansion with Delhi and other neighboring towns. These roads also form the arterial network for Greater Noida as they pass through the city. Arterials form major spine of the mobility network. Based on this definition, the following roadways have been classified as Arterials. i. ii. iii. 80m ROW East - West Road: The 80m ROW road is one of the GNIDA Master Plan roads. This road should be constructed as a six-lane divided arterial with service lanes, footpath and cycle track on either side. This road will provide a grade-separated rail crossing over the existing Delhi Aligarh railway line north of the Ajaibpur railway station. The 80m ROW road will be at-grade for approximately 250m east of the 60m ROW North-South Road. The road will then transition to an elevated section (with atgrade service roads) to form a grade separated junction over the 60m ROW Spine Road and will continue across the railway line as an elevated road. This arrangement will allow the road to function as the main entrance to the IIT as well as serve regional traffic destined to locations east of the railway line. As stated previously, this road will provide regional connectivity between Greater NOIDA, the IIT and the proposed DNGIR. In addition, the road will also connect DNGIR with NOIDA, Agra and New Delhi via the Yamuna Expressway. 60m ROW North-South Road: The 60m ROW road is one of the GNIDA Master Plan roads and has been partly constructed. This road should be constructed as a six-lane divided arterial with service lanes, footpath and cycle track on either side. As stated previously, this road will provide connectivity between the proposed Eastern Peripheral Expressway, IIT and the Boraki Metro station and hence serve as a major regional roadway for the IIT. The road will also connect the IIT with the proposed MultiModal Freight hub. 60m ROW East-West Road: The 60m ROW road is one of the GNIDA Master Plan roads. This road should be constructed as a six-lane divided arterial with service lanes, footpath and cycle track on either side. This road will provide a grade-separated rail crossing over the existing Delhi Aligarh railway line north of the Ajaibpur railway station. The 60m ROW road will be at-grade between the 60m ROW North-South Road and the 60m Spine Road. East of the Spine Road, this road will transition to an elevated section (with at-grade service roads) to form a grade b. Sub-Arterials - According to the GNIDA 2021 Master Plan, sub-arterials are major internal roads of the township, which are planned to cater to the bulk of the intra-city movement. Based on this definition, the 60m spine road has been classified as a Sub-Arterial. i. c. 60m ROW Spine Road: A Central north-south road has been proposed as part of this project to provide direct access to parcels within the IIT. The 60m spine road is proposed along the approximate longitudinal centre of the IIT and will form junctions with the eastwest 80m ROW and 60m ROW regional roads. These secondary exits to the north and south will help reduce traffic congestion on IIT's internal roads as well as GNIDA s regional roads. Major Collectors - According to the GNIDA 2021 Master Plan, major or primary collectors connect major arterial/ sub-arterial roads and intra residential secondary collectors. Major Collectors will reduce the burden on the Central Spine and the 60m ROW East-West roads by serving as secondary entrances and exits to the site while also providing access to the Rithori, Ajaibpur and the existing railway station. Based on this definition, the following roadways have been classified as Arterials: i. 45m ROW East-West Roads: Two segments of 45m ROW east-west roads have been proposed north and south of the 60m ROW East-West road. The roads were planned strategically with the objective of retaining existing roads built by GNIDA and are recommended to be constructed as six-lane divided arterials with footpath and cycle track on either side. 7-1 It should be noted that service roads are not being proposed along the 45m ROW roads in accordance with GNIDA standards provided to the Consultants. These roads will increase junction density along the Central Spine and the 60m North-South road and hence enhance connectivity and directness within the site. ii. 45m ROW North-South Roads: A 45m ROW northsouth road has been proposed east of the Central Spine. These roads were planned strategically with the objective of retaining existing roads built by GNIDA and are recommended to be constructed as six-lane divided arterials with footpath and cycle track on either side. d. Minor Collectors - According to the GNIDA 2021 Master Plan, Secondary Collectors collect traffic from local streets within one residential pocket/ sector. These are internal roads providing access to various sectors from the proposed work centers. Based on this definition, all 24m and 30m ROW roads have been classified as Minor Collectors. e. Non-Motorized Travel (NMT) Routes - According to the GNIDA 2021 Master Plan, exclusive lanes have been provided along all roads for non-motirised modes of travel. As per the vision of the IIT Layout Plan, special emphasis has been provided to NMT routes during the planning process. The planning process incorporates the 5D planning principles and also takes into account the practical challenges of executing a walk-to-work concept. Merely providing footpaths and cycle tracks along six-lane arterials and sub-arterials may not be enough to encourage car users to shift to active modes of transport. Therefore, a network of Greenways has also been proposed to overcome the inhibitions typically harbored by car users. These Greenways will provide a comfortable alternative for commuters who are not comfortable walking along major roadways.

129 Figure 7-1: Roadway Classification Map Option 1 Figure 7-2: Roadway Classification Map Option 2 7-2
130 7.3 Roadway Cross-Sections All the 60m ROW roads proposed as part of Layout Plan Options 1 and 2 will consist of six-lane divided sections in addition to service lanes and BRT lanes. Similarly, all 45m ROW roads will also consist of six-lane divided sections. According to recent studies published by the Institute of Urban Transport (India), the capacity of six-lane roads is approximately 2,230 PCU per lane per hour, or approximately 6,700 PCUs per direction per hour. Capacity indicates the maximum traffic volumes that can be served by a road and represents congested conditions. Therefore, roads are designed for desirable service volumes (design hour volume). IRC 106:1990 recommends that six-lane divided arterials can comfortably accommodate approximately 5,400 PCUs per hour. However, IRC 106:1990 also recommends that the design hour volumes should be approximately 70% of the road's capacity. Therefore, a range of 5,400 PCUs/hour to 9,400 PCUs/hour was used to determine roadway cross-sections for the proposed roads. Graphical illustrations of roadway cross-sections are shown in Figure 7-3 through Figure 7-7. Based on preliminary analysis, the proposed roads will be able to accommodate the expected traffic demand. A detailed technical analysis which includes demand forecasts and capacity analysis will be provided in the Basis of Design report. 7.4 Freight Circulation Strategy Freight circulation plan for the IIT should align with strategies adopted in industrial parks around the world and strategies recommended by premier agencies like the US Federal Highway Administration. This requires strong robust communication channels between industries within and near the IIT, freight companies serving the area, and the logistics centre at the proposed inter-modal hub at Boraki. The logistics centre s integration with the IIT will help to minimise the number of freight trips, duration of truck parking and reduce truck operating costs. Strategies that can minimise truck trips are listed below: a. Freight tracking systems such as real-time freight and vehicle location using GPS. These systems should be integrated with the logistics centre at the proposed Boraki inter-modal hub to assist industries to schedule their shipments. b. Idling and frequent braking leads to increased fuel consumption, emissions, wear and tear. Therefore, freight service providers should be encouraged to operate their vehicles during non-peak periods (5:00 a.m. to 7:00 a.m., and 10:00 a.m. to 3:00 p.m.). This strategy will be beneficial for both the freight companies as it will help them cut transportation costs, and for passenger vehicles by preventing interaction between personal vehicles and heavy vehicles. This strategy is currently being used in several industrial parks and cities across the world such as Boston, New York and Los Angeles, USA. No on-street truck parking is being proposed as part of this plan to avoid disturbing the aesthetics of the proposed IIT and prevent idle parking within the proposed IIT. It is recommended that all truck parking should be accommodated at the proposed Boraki inter-modal hub. It is assumed that the proposed inter-modal hub at Boraki will consist of a modern logistics centre to monitor arrival, departure and dispatch of trucks from the hub. Certain policy interventions will also be required to achieve the desired objective of minimising the impact of truck traffic on the lives of the residents of the proposed IIT. These policy interventions should include providing incentives to industries to schedule off-peak pick-ups/deliveries and penalties for truck parking on public streets. Figure 7-8 and Figure 7-9 show the proposed truck routes along with roads where trucks should be prohibited. 1. Consolidation of freight trips between various industries. This is a commonly adopted practice that helps reduce the number of trips made by trucks by combining pick-ups from multiple destinations during the same trip. 2. Increasing the permissible loads carried by freight vehicles. The maximum permissible single axel load in India is 10 tons while it is significantly higher in other countries. It is recommended that special exemption on load be provided along the 60m North-South road connecting the proposed IIT and Boraki's inter-modal hub. 3. Freight service providers operating in the area should be encouraged to deploy larger vehicles which will help increase the load carried per trip. Additionally, strategies listed below can help reduce truck operating costs and should be implemented for the benefit of both freight and passenger traffic: 7-3


131 Figure 7-3: 30m ROW Roadway Cross-Section Figure 7-4: 30m ROW Roadway Cross-Section (SCR-1 between sector road and central spine) Figure 7-5 : 45m ROW Roadway Cross-Section 7-4


132 Figure 7-6: 60m ROW Roadway Cross-Section Figure 7-7 : 80m ROW Roadway Cross-Section 7-5


133 Figure 7-8: Truck Circulation Plan for Option 1 Figure 7-9: Truck Circulation Plan for Option 2 7-6
134 7.4.1 Off-Street Parking Estimates 3. Podium Parking Off-street parking estimates for the IIT are arrived on the basis of Parking Norms of GNIDA Building Regulations. These regulations set out the types of Parking Provisions which can be accommodated in the development along with the requirement of parking spaces per square m of area (depending on the building usage typologies). This is briefed in the following sub-section Parking Guidelines Following is the extract from GNIDA Building Regulations (Chapter IX, pg63) For adequate parking space, podium parking up to one floor may be permitted beyond the building envelope. The minimum plot area for podium parking to be permitted is about sq m. The minimum setbacks suggested for building typologies to be followed. The height of one level of podium will be a maximum 2.1 metres from floor to the bottom of the beam. Podium levels should be enclosed with LED media screens /green walls on sides fronting the roads for visually responsive urban realm. On all other sides podium levels will not be enclosed by any material on the outer periphery except with one metre perforated metal sheets for safety The Regulations states for the various means of Parking Provision such as: 1. Multi-Level Mechanised Parking Multi-level parking should be developed in the designated parking spaces/plots. Multi-level facilities shall be allowed in all type plots along with mechanised parking. 2. Basement Parking In plots larger than sq m, the basement shall be allowed upto minimum setback of 6m. There will be no restriction on the number of levels of basements subject to mechanical ventilation as per provision in National building Code 2005, water proofing and structural safety. Evergreen trees shall have to be planted in setback as per landscaping norms of the regulation. Height of first basement above ground will be 1.5mts below the roof slab. Where stilt or podium parking is permitted, the first basement roof will be levelled with the ground and the roof slab of the extended basement up to envelop line shall be designed for the fire tender load. The height of the basements from floor to ceiling shall be maximum up to 4.5 metres. The ramp within setbacks shall be permissible subject to free and convenient movement of fire tenders. Adequate fire safety, light, ventilation and air change through mechanical means shall be provided as per provisions in NBC The basements may be used only for parking, services like fire rooms and storage of non hazardous materials. Adequate sprinklers, exits, ramps and fire-fighting provisions to be provided as per NBC Structural safety measures as per BIS codes will be ensured. The following Table shows the norms adopted for the Parking as per the GNIDA Building Regulations. Land use function / Building typology Parking Space Requirements (per sq m) (GNIDA Norms) Commercial -3 star One parking for every hotel 2 guest Parks and Open Spaces Miscellaneous activities : i) Loading/Unloading ii)multiplex/cinema n/a parking space per 15 seats iii)utilities 100 iv)recreational 50 Table 7-1: Parking Norms GNIDA Building Regulations Land use function / Building typology Parking Space Requirements (per sq m) (GNIDA Norms) Industrial ( Hi-tech, 100 Bio-tech, R&D) Industrial ( IT) 50 Residential - Group Housing 80 Residential Housing EWS 80 Commercial (all incl 5 star hotels, Retails+ Business offices, Mall + Recreation + convention centre) Type of Parking permitted Type of Parking permitted Same as lodges, guesthouses and hotel room Surface Parking As per individual industrial plot typology As per individual commercial plot typology As per Infrastructure guidelines As per individual commercial plot typology Source: GNIDA Building Regulations; Chapter IX, pg-63 Development Notes for Parking: Basement (with extended basement)and Surface Parking Basement (with extended basement), Podium and Surface Parking Basement (with extended basement), Podium and Surface Parking Basement (with extended basement) and Surface Parking Basement (with extended basement) and Podium Parking Respective plot setbacks to be adhered for all basement parking. Industrial One car park is considered for every 100 sq m of permissible built-up area in accordance with the GNIDA Building Regulations document. The basement is allowed to extend by 20m beyond the longer side of the building line, from one of the buildings only Residential - Group Housing Two car parks are considered for a single housing unit. (One individual unit measuring 200 sq m). The basement is allowed to extend by 20 metres beyond the longer side of the building line, clubbed between two building blocks. The podium is allowed to accommodate entire plot coverage (including green areas) minus the setbacks. Residential - EWS Housing As suggested by the client, EWS housing will follow the same requirements as the residential group housing. One car park is provided for two housing units. (One individual EWS housing unit measuring 40 sq m).the basement should be clubbed between two to three building blocks minus the setbacks.
, minus the setbacks. (Minimum 15 m on the front edge). The podium is allowed to follow the same coverage as the basement.")
 is calculated by dividing the BUA (C) by the car scape requirements norms w.r.t different land use as mentioned in Table 7-1.")
 is calculated by multiplying 40 sq m and total number of car space requirement (D).")


135 Commercial - Mall + Recreational, Hotel One car park is considered for every 40 sq m of permissible built-up area (50 sq m for Hotel) in accordance with the GNIDA Building Regulations document. The basement accommodate entire plot coverage (including green areas), minus the setbacks. (Minimum 15 m on the front edge). The podium is allowed to follow the same coverage as the basement. For the parking area calculation firstly the Built Up Area (BUA) is calculated by multiplying A and B. Then total number of car space requirement (D) is calculated by dividing the BUA (C) by the car scape requirements norms w.r.t different land use as mentioned in Table 7-1. One car park is considered for every 30 sq m* of permissible built-up area. And hence the total parking space area requirement (E) is calculated by multiplying 40 sq m and total number of car space requirement (D). (Note: *Source: Uttar Pradesh Shasan Audhyogik Vikas Anubhag, Chapter 3, pg-26.) Parking Provision Residential Group Housing Commercial - Recreational, Retail + Business One car park is considered for every 50 sq m of permissible built-up area in accordance with the GNIDA Building Regulations document. The basement accommodate entire plot coverage (including green areas), minus the setbacks. (Minimum 15 m on the front edge). Requirement nos Provision nos The below figures depicts Basement lines indicating the extent of Basement Parking based on which area calculation for the parking is done. The basement will be allowed to extend within the plot only for parking purpose from the longer side of the building line. The extent upto which it extends is specific to each building typology. The basement is not allowed to extend into the plot setbacks Parking Requirements Industrial (Hi-tech, Bio-tech, R&D) The parking requirements are calculated based on the GNIDA Norms as mentioned in the previous section (Refer: Table 7-1) and the detailed calculations for these can be referred in the Annexure of the UDF Report. Table 7-2: Parking Requirement for IIT, Greater Noida Surroundin g Uses Area (Ha) Proposed FAR Proposed Built Up Area (sq m) Total Require ment (No.) Total Requireme nt (Area) A B C D E Commercial Residential (Group Housing) Residential (EWS) Hi Tech IT Bio Tech R&D Figure 7-11: Residential Group Housing Parking Provision Total Note: Mechanized Stacked Parking accommodating two levels in One Basement Floor. Surface Parking 15 % of total number of car parks Commercial Commercial Requirement nos Provision nos Note: Mechanized Stacked Parking accommodating two level in One Basement Residential Note: These Parking requirements are calculated considering the futuristic view where maximum population is envisaged to work and live within the township so that the design proposal are sustainable for the population, in the event, where there will be more demand. (this is already elaborated in Chapter 6). Thus these parking demand are based on articulated FAR which are purely subject to the necessary approval by the authority. Figure 7-10: Commercial Parking Provision Floor. *The first two levels of Podium Parking should occupy not more than 7-8


136 70% of floor area. A minimum of 30% floor area to provide for street fronting convenience retail purposes. Residential EWS Industrial R&D, Hi-tech & Bio-tech Requirement nos Provision nos Requirement nos Provision nos Note: Surface Parking 15 % of total number of car parks. The podium level parking should not be occupied more than 50% of floor area. Figure 7-12: Residential EWS Parking Provision Industrial IT Requirement nos Provision nos Figure 7-14: Industrial R&D, Hi Tech & Bio Tech Parking Provision Note: Mechanized Stacked Parking accommodating two level in One Basement Floor. Surface Parking 30 % of total number of car parks The success of parking strategy proposed in this report depends heavily on the provision of a high quality public transport system and makes it extremely important to ensure provision of services like circulator shuttles and BRTS. Figure 7-13: Industrial IT Parking Provision Note: Mechanized Stacked Parking accommodating two level in One Basement Floor. Surface Parking 25 % of total number of car parks 7-9
137 7.5 Comparative Analysis Network Statistics Table 7-3 provides a comparative summary of the proposed roadway network. Comparative analysis of the two roadway networks is provided below: a. Overall, Option 2 provides 2.7 additional lane-kilometres compared to Option 1. b. Lengths of roads retained or demolished is the same under both Options 1 and 2. c. Option 1 provides 28.7 km of footpaths and cycle tracks, and 5.01 Km of Greenways while Option 2 provides 31 km of footpaths and cycle tracks, and 5.3 Km of Greenways. Overall, the length of pedestrian and cycle routes within the proposed IIT under Options 1 and 2 exceeds the length of roads, emphasising the importance given to space-efficient modes of transport like walking and cycling. Table 7-3: Network Statistics Performance Measure Option 1 Option 2 b. Junction Ratio The ITE recommends that junction ratio of networks should be more than 0.75 to encourage walk trips. The junction ratio for both Option 1 and Option 2 is 1 indicating that both the options provide good connectivity throughout the IIT for all modes of transport. c. It should be noted that although Option 2 generates 6.6% more aggregate trips (VKT), it results in a higher reduction in VKT and CO2 emissions. Junction Spacing - The average junction spacing for Option 1 and Option 2 are 429 m and 478 m, respectively.the average trunk level junction spacing of approximately 500m is an acceptable spacing based on the findings of a travel survey conducted by RITES. d. Destination Accessibility Although no specific recommendations for destination accessibility have been provided in any of the guidance documents, the general rule is that larger the share of destinations within a 15 minute public transport trip, the more conducive is the network for walking, cycling and public transport. The 60m SpineRoad is the longest road within the IIT with a total length of approximately 4.5 kilometres. Buses travelling at an average speed of 30 km/h can cover this distance in approximately 7 minutes. Since most transit stops are located at a distance of 5 to 10 minutes from any point, almost 100% of the destinations are within a 15 minute bus ride under both Option 1 and Option 2. Difference Sustainability Statistics Km % Total Lane-Kilometres* % Total Road Length % Lane-Kilometres Retained % Lane-Kilometres Demolished % Length of Cycle Track % Length of Footpath % Length of Greenways % * Excluding service lane Figure 7-15 and Figure 7-16 show the utilisation of existing roads under Options 1 and 2. Under both options, existing village roads withing the IIT s boundaries will be demolished. Further, the proximity of the existing 45m ROW road immediately south of the proposed 80m ROW road violates IRC s junction spacing criteria. Therefore, this road is proposed to be demolished under both Options 1 and Transportation Indices a. Link to Node Ratio The ITE recommends that networks should have a minimum Link-to-Node ratio of 1.4 to encourage walk trips. The Link-to-Node ratios for Option 1 and Option 2 are 1.50 and 1.58, respectively. Therefore, transport network for both the options will provide good connectivity throughout the IIT for all modes of transport with Option 2 being marginally better than Option 1. The MXD model developed by the US EPA and Fehr & Peers was used to generate preliminary estimates of reduction in vehicle kilometres travelled (VKT) which were subsequently used to estimate carbon emissions for Options 1 and 2 based on the US EPA s guidance on Carbon Emissions. Figure 7-17, Figure 7-18, Figure 7-19 and Figure 7-20 present the comparison of Options 1 and 2 with their respective Baseline scenarios using two key sustainability parameteres, vehicles kilometres travelled and Reduction in CO2 emissions. The Baseline scenario in each case represents a township which has the same land uses as those proposed in Options 1 and 2, respectively, but does not have the other sustainable elements proposed as part of this Layout Plan. As shown in Figure 7-17, Figure 7-18, Figure 7-19 and Figure 7-20, Option 2 results in a greater reduction in both Vehicle Kilometres Travelled as well as CO2 emissions. Option 1 is expected to generate approximately 950,000 vehicle kilometres per day which is approximately 213,000 less than the Option 1 Baseline scenario. Option 2 on the other hand is expected to generate approximately 1,012,000 vehicle kilometres per day which is approximately 217,000 less than the Option 2 Baseline scenario. 7-10

138 Figure 7-15: Utilisation of Existing Roads Option 1 Figure 7-16: Utilisation of Existing Roads Option
139 1,162, Metric Tonnes / VKT Vehicle Kilometre travelled (VKT) 1,200, ,585 1,000, , , ,000 a. Traffic Calming The following traffic calming measures are recommended to be installed along minor collectors and residential streets within in the IIT : Baseline IIT IIT Total Daily VKT Avoided Figure 7-17: Reduction in Vehicle Kilometres Travelled Option Metric Tonnes / VKT 1,011,943 1,000, , , , , ,000 0 Baseline Baseline IIT IIT Total Daily VKT Avoided Figure 7-18: Reduction in Vehicle Kilometres Travelled Option 2 Horizontal deflections including chicanes and pedestrian refuges. iii. Roadway narrowing techniques like curb extensions. b. Greenways - Greenways form a key element of the proposed IIT and are expected to provide long term sustainable transportation solution for the residents of the IIT. In addition, Greenways will help connect open spaces within the IIT and hence will also provide recreational and health benefits to commuters and residents. It is recommended that Greenways should be integrated with bicycle share stations, cycle parking areas and public transport stops to provide seamless multi-modal transport system. In addition to Greenways, all roads provide exclusive footpaths and cycle tracks. The cycle and pedestrian networks for Options 1 and 2 are shown in Figure 7-21 and Figure ,229,271 1,200,000 ii. Figure 7-20: Reduction in CO2 Emission Option 2 These measures should be used along service roads in the vicinity of residential and retail areas, and along low speed roads. Reduction in CO2 Emissions Figure 7-19: Reduction in CO2 Emission Option 1 1,400,000 Vertical deflections such as speed humps, speed tables, raised intersection and crosswalks ,000 Baseline i ,208 0 Vehicle Kilometre travelled (VKT) 7.6 Key Recommendations 600 1,400,000 Reduction in CO2 Emissions c. Bicycle Share Setting up bicycle storage and bicycle sharing facilities along destinations of interest such as the Metro station and bus stations, residential areas, employment centres and along the Greenway will be essential for development of a car-free neighborhoods in the proposed IIT. Bicycle sharing will provide the first and last mile connectivity to and from public transit stations. Pick-up and drop off facilities at bike rental stations and segregated lanes for cycles will encourage users to rent bicycles and achieve seamless multi-modal integration. The proposed location of bicycle share stations are shown Figure 7-21 and Figure d. Car share Carshare could be particularly useful in the proposed IIT area especially if implemented in conjunction with the complete streets design, a high capacity public transport system and a greenway network. As stated previously, Carshare will provide greater flexibility to commuters and help them make the transition from car to public transport. Carshare will also enhance parking capacity within the IIT since shared cars are parked for short periods of time and increase the average turnover rate. As stated previously, carshare users are more likely to shift to public transport, cycling and walking over time and therefore will help make the IIT a sustainable development. The proposed location of car share stations are shown Figure 7-21 and Figure
140 e. Multi-Modal Integration - The planning process adopted for this project lays emphasison providing a seamless multi-modal network for users of NMT and public transport to comply with the vision of the project. As shown in Figure 7-21, Figure 7-22, Figure 7-23 and Figure 7-24 the NMT routes are connected with the public transport network through use of footpaths and cycle tracks, greenways, and bicycle and car share schemes. The following measures are recommended to provide seamless intermodal connectivity between sustainable modes of transport in addition to providing a modern public transport system: a. Strategic network of Greenways, footpaths and cycle tracks connecting origins and destinations with public transport stops. b. Bicycle share stations, bicycle parking, and car share lots adjacent to public transport stops and traffic generators. c. Bicycle racks at the front of buses to allow cyclists to use their own cycles. d. Strategically placed signalised pedestrians and cyclists. mid-block crossings for e. Off-board ticket vending machines at BRT stops to reduce BRT dwell times. f. Common prepaid cards for bicycle share, car share and public transport to enhance seamless intermodal transfers. g. All door boarding to increase passenger boarding and alighting capacity and reduce dwell time. h. Real time passenger information system at bus stops along with smart phone applications to increase reliability. f. i. Low floor buses with level boarding at bus stops to allow easy and faster boarding and alighting for the elderly and disabled. j. Multiples lines of circulator buses and BRT with stops at a spacing of approximately 500 metres. BRT - Based on information provided by DMICDC, the MRTS line from Boraki is not expected to pass through the vicinity of the proposed IIT. In lieu of a MRTS stop near the IIT, the current MRTS proposal recommends a feeder service to connect the IIT with the proposed Boraki Metro station. A four-step travel demand model developed for this project suggests that the proposed IIT is expected to generate up to 20,000 public transport users during the AM and PM peak periods. Further, the floating population of the township exceeds the resident population and the floating population is anticipated to consist of people residing in other sectors of Greater NOIDA, DNGIR or even NOIDA. This makes it important to provide a high capacity public transport system for the IIT. Since up to 20,000 peak hour trips are expected to be made using public transport, a metro or light rail system is not expected to be a viable alternative. These conditions make BRT the most suitable public transport system to connect residential areas of Greater NOIDA, DNGIR and NOIDA with the proposed IIT. It is recommended that the 60m spine road of the proposed IIT be developed as the township's BRT corridor with one line connecting the IIT with the proposed Boraki Metro station and one line connecting Greater NOIDA and DNGIR with the proposed IIT. It is recommended that the BRT be designed to meet the ITDP's Silver standards. Recommended alignments for BRT line under Options 1 and 2 are shown in Figure 7-23 and Figure g. Circulator - Although highly efficient, high capacity public transport systems like Metro, LRT and BRT cannot be provided along every street of the IIT. This makes it imperative to provide comfortable and high frequency feeder services. The Circulator lines proposed under Options 1 and 2 will act as feeder services for the BRT and augment the BRT s ability to attract long distance trips originating or destined to location outside the township. In addition, Circulator systems can also function as the primary public transport mode for trips within the IIT although its efficiency could be limited for long distance commutes such as those to Greater NOIDA and the proposed Boraki Metro station. Circulator system will be an inexpensive alternative for short but frequent trips between the residential areas and employment centres in the layout plan area. For Circulators to have high ridership, they will need to operate in a loop at high frequency. Frequently served destinations connected by a loop will make short distance commute simpler for residents, minimize the need to change buses, provide a consistent high quality short distance service to all residents alike making the service attractive to nonpublic transport users. For the system to have its own identity and to popularize its usage, modern, low floor vehicles will need to be provided. Buses/vehicles with bicycle racks and seamless integration with the greenway system are recommended for developing a low carbon local transportation system in the layout plan area. h. Complete Streets The streets in the layout plan area should be designed as per complete street design principles to enhance safety, sustainability, and equity to all road users. Successful implementation of complete streets in Chennai and in other developing countries such as Mexico has proved that providing welldesigned, maintained, segregated pedestrian, cycling and public transit facilities is effective in alleviating congestion and encouraging car users to shift to other modes). measures such as the Urban Compact Roundabout at suitable junctions. i. Traffic Control Devices The Comprehensive Transport Master Plan for Greater NOIDA provides guidelines to select junction types. The guidelines are based on IRC , which states that: i. Rotaries are most apt where volumes entering form different intersection legs are approximately equal. ii. A total volume of 3000 vehicles per hour entering from all the intersection legs is the maximum practical capacity of a rotary junction. iii. A rotary is more justified than traffic-signal control if the right turning traffic exceeds about 30% of all approaching traffic. Most of the major junctions within the IIT are expected to serve more than 3000 vehicles per hour and hence meet the criteria stated in IRC Since driver behaviour in India is significantly different from that in western countries, roundabouts pose serious safety hazards especially for vulnerable groups such as pedestrians and cyclists. It is therefore recommended that all major junctions with traffic exceeding 3000 vph be designed as compact signalised junctions. It is recommended that adaptive traffic signal control system should implemented to ensure optimal performance of the transportation network. In addition, it is recommended that the regulatory authority for the proposed IIT organise promotional events to popularise NMT and Public Transport within the IIT. Special schemes such as providing free passes for public transport and bicycle share could be organised on a monthly basis. Additionally, special weekend events such as Rahgiri day should be organised to address local residents inhibitions associated with use of bicycles and public transport. Streets in the proposed IIT are recommended to be designed with footpaths, bike lanes, special bus lanes, well designed bus stations for circulator and BRT buses, parking bays for auto rickshaws, cars and cycle rickshaws, spaces for street vendors where foot traffic is high for example at bus/circulator stops where people change modes. The street should also have safe at grade crossings for pedestrian, proper signage and correctly placed street furniture. The quality and safety of road travel especially for pedestrians, nonmotorized transport users and the differently abled citizens in the area should also be improved at intersections by innovative design 7-13

141 Figure 7-21: Pedestrian and Cycle Network for Option 1 Figure 7-22: Pedestrian and Cycle Network for Option

142 Figure 7-23: Public Transport Network for Option 1 Figure 7-24: Public Transport Network for Option

143 8. Infrastructure Plan Infrastructure is the backbone of any successful place for living and working. Proper functioning township is a direct consequence of meticulously planned and arduously maintained infrastructural system. The chapter outlines the concept plan for various infrastructure components, viz. Water supply, Sewerage system, Storm water drainage, Solid waste management, Power, Information and communication technology, and Gas utility for the township. 8.1 Water Supply Adopted Norms for IIT As per best practises for a model Industrial Integrated Township, following norms have been recommended/ adopted for deriving the water demand for the proposed township: The unit demand norms adopted are: a) 150 lpcd for Residential population Piped water supplies for Integrated Industrial Township (IIT) Greater Noida Ltd will be provided for various needs such as drinking, cooking, bathing, washing, flushing of toilets and gardening including commercial and industrial usages. To reduce the load on the fresh water requirements and to achieve Zero discharge, Recycled water usages for non potable uses are suggested Population for water supply assessment For demand assessment, residential population has been considered as 48,126 (as per Table 9.6). Considering major emphasis on industrial use, norms followed in various reports of GNIDA for infrastructure demand assessment are considered for commercial and industrial demand assessment Prevalent Water Supply Norms There are various water supply norms, based on type of land use; e.g. CPHEEO, GNIDA, Civil Engineers Handbook, these are summarized in Table 8-1 below: c) 20,000 L/Ha/d for Industrial non-domestic purpose d) L/ha/day for landscaping irrigation Water Demand Assessment For sustainable water use and to reduce the load on fresh water demand, recycled water usage for various non potable purposes is planned. Calculation of wastewater generation has been carried out considering sewerage 80% of potable water use and 100% of non potable water use. Envisaged demand of potable, non potable water is provided in IV. Table 8-2 below. Detailed calculation for water demand is presented in Annexure- IV. Table 8-2: Water Demand-Potable, Non-Potable S.No Category Table 8-1: Prevalent Water Supply Norms/Standards Use Water Supply Rate (LPCD) However as Ganga water scheme will be closed for annual b) 45,000 L/Ha/d for Industrial domestic purpose General S. N. boundary. Further GNIDA has also sought approval from irrigation department for additional quantity of 7 MLD water from upper ganga canal which will be supplied to IIT Greater Noida project. Residential/Planned Colony Reference/ Sources CPHEEO 1993/GNIDA DPR/IS: MoM GNIDA Dt A B 2 Industrial DevelopmentDomestic L/Ha/day GNIDA DPR/ MoM GNIDA Dt Industrial DevelopmentDomestic L/Ha/day DMICDC Project 4 Landscape Irrigation L/Ha/day DSIDC 5 Water Supply with PSP 40 CPHEEO/ARWSP/ IS: Fire Demand Q=100(P1000)1/2 CPHEEO Above prevalent norms shall be compared for deriving domestic per capita water demands according to proposed land use. C Total Water Demand (MLD) Potable Water Demand (MLD) Flushing Water Demand (MLD) Waste Water Generation (MLD) 1 Residential Commercial Industrial Provision for villages Landscaping irrigation Fire fighting requirement Net Water Demand Gross Total at project level including 5% Losses Gross Total at source including 5% additional demand Source of Water Four options have been explored by the consultant as potential source of water for proposed Industrial Township, the location of sources is provided in Fig 8-1 above. After discussions with GNIDA it was decided that 210 MLD WTP, at Palla Village proposed under 85cusec Ganga water scheme shall be used as the main source of water and also decided that GNIDA will provide water up to the project 8-1 Figure 8-1: Potential Sources of Water for IIT Potential Source explored by consultants: 1. WTP near Palla Village 2. Tapping from Mat branch of Upper Ganga Canal 3. Ranney well to be proposed along Yamuna, near Murshadpur 4. Bore well on site maintenance and repair, water from mat branch and 85 cusec Ganga water project may not be made available for one month. During this maintenance period option of using rain water by providing storage in pond was discussed. As the duration of rainfall is very less and cost of underground reservoir for storing the rain water is very huge, option of using underground water by drilling suitable number of bore well in the project area was agreed Water Treatment Options As treated water will be made available under 85 cusec Ganga Water project scheme, no additional treatment for water is suggested. Only arrangement for disinfection will be provided. Final Detailed Site Master Plan Report
144 As bore well water will be supplied for one month duration only, no treatment for this water has been suggested Water Quality Standards after Treatment The quality of treated water shall meet the standard set out in (Table 2.2 of) manual on Water Supply and Treatment, Central Public Health and Environmental Engineering Organisation Water Supply System- Features 24 x 7 distribution system Pumping hours -22 hours, Peak Factor- 2.5 The proposed water supply system consists of one common Clear Water Reservoir (CWR) where water will be collected from the allocated source near the site boundary or from the WTP inside the project area. From CWR water will be pumped to the Elevated Service Reservoir (ESRs) and from there water will be supplied to each land parcel level through the distribution network of HDPE (Black colour pipes- PE-100, PN6) under gravity. A schematic presentation of proposed water supply scheme for IIT has been shown in Drawing No. TCE.7504A-150-WS-6001 given in Annexure-V. Capacity of each ESR will be 1/3rd of the total water demand of that zone. The details of land requirements along with water supply scheme are provided in Drawing No. TCE.7504A-150-WS-6001 given in Annexure-V. Pipe materials- HDPE (PE-100, PN6) pipe for distribution network and DI-K9 for pumping main Best Practises adopted Various best practices adopted in this project are : Un-interrupted water supply system on 24 x 7 basis Recycling of reclaimed water Dual piping system (Potable and Non potable) Complete automation using SCADA system(supervisory Control & Data Acquisition) Efficient water distribution network management Pipe network of quality pipes and fittings Pressure & Flow monitoring Active leakage control and detection 100% meter connection Energy efficient pumps and motors Controlled)(Variable Frequency Drive) Optimized design of pumping main B C Selection of ESR site Location of proposed WTP / ESR has been selected based on following criteria: Location: Centrally located for equitable distribution of water in adequate quantity and pressure for entire township. Land-value: Use of low saleable land Contours: ESRs have been proposed at higher elevation to get the topographical advantage for distribution of water. 8.2 Waste Water Management General The main objective of wastewater system is to ensure that the waste water generated from various land parcels within project area is collected, conveyed, treated and disposed off in safe Environmental friendly manner. The wastewater system would be designed for the expected wastewater flow based on the water demands for various land parcels. The design flow would be based on the saturated population of the project town Waste Water Generation Wastewater flow has been computed based on potable water supply to consumer (@ 80%) and non-potable for flushing purpose (@ 100%). Infiltration will be considered as per CPHEEO manual i.e l/km/d. Peak factors will be considered based on contributory population to arrive at peak flow. Summary of Waste Water generated in the township is provided as Table 8-3. D S.no Category Residential Commercial Industrial Provision for villages Total Waste water 8-2 Waste water Generation (MLD) L/km/day for approx.20 km of sewer line Waste Water Generation Treated 95% recovery Waste Water Collection System The criteria as stipulated in CPHEEO manual on Sewerage and Sewage Treatment and other relevant standards has been used for the Sewerage System design. Sewage collection system comprising of HDPE pipe & RCC NP3 pipes of spigot socket type with rubber ring joint and suitable bedding arrangement, manholes at every 30m interval and at any change of alignment shall be provided. Manholes shall be of brick masonry with cement mortar plaster on both sides and heavy duty SFRC frame and covers. While planning for providing a comprehensive sewerage system to the project township, entire Township has been divided into three wastewater collection & treatment zones in previously submitted master plan. However during discussion with GNIDA, it was advised to integrate the sewerage system with exiting sewerage system and discharging the sewage to the STP-1 of 72 MLD capacity proposed under peripheral sewerage system of 14 sectors of Greater Noida and thus eliminating the construction of additional STP inside the project premises. Though the proposed site is partially covered with sewerage network only the sewerage network laid along the 60m North South Road can be used and remaining networks could not be used, due to following: Many of the manholes / pipelines are damaged or filled with stones / silt etc and hence needs to be renovated. Top level of no. of manholes is m above the existing ground level. In order to retain these manholes, the finished road level (FRL) of the site should be such that it flushes with the top level (TL) of manhole. Otherwise these manholes need to be dismantled and reconstructed again. Present alignment of the sewer network is in the proposed road layout falling almost in the centre of the road. Complete details of existing sewerage system in terms of invert levels of the manholes is not available with the consultants. Table 8-3 Summary of Waste Water Generation A (VFD Final Detailed Site Master Plan Report


145 Maintenance of the system has not been carried as per the requirements. Hence the system has been deteriorated with the passage of time. Above aspects needs to be considered while integrating the proposed and existing sewerage network within project site. Now under the proposed scheme the entire sewage will be collected by providing sewer network and system will be interconnected with already laid sewer line along the 60m wide North-South road, which is already connected to the STP-1 proposed under peripheral sewerage scheme. alternative processes have been considered which appear to be suitable for this magnitude of STP: a. Moving Bed Bio-reactor (MBBR) b. Sequential Batch reactor (SBR) c. Membrane Bio Reactor (MBR) d. Activated Sludge plant (ASP) Factors influencing the selection of a process of STP are generally: Performance efficiency in removal of BOD, COD, Suspended solid and coliform Land requirement vis-à-vis availability Capital cost Odour nuisance Quality of effluent with respect to its disposal and demand from source and making the water supply scheme more sustainable. For this purposed Tertiary Treatment will be provided to the secondary treated wastewater to achieve required quality of reclaimed water to be recycled Recycling of Wastewater Distribution of recycled water is planned through direct pumping from Ground Level reservoir. The reclaimed water will be collected in the ground level reservoir by providing pumping main from the STP. From there the reclaimed water will be pumped to each parcel level. For recycled water distribution HDPE pipes of PE-100-PN6 class as per IS 4984 (blue colour pipes) will be used. Recycled water will be delivered at the boundary of each parcel.. The network of recycled water system is provided in Drawing No. TCE.7504A-150-WS-6002 given in Annexure-V. utilization Operation & Maintenance (O & M) cost Considering the factors as discussed above, SBR appears to be most suitable technology and hence recommended for the treatment of wastewater at IIT Greater Noida. However as the proposed STP under Peripheral sewerage scheme in Greater NOIDA is based on SBR technology, hence no additional treatment is required inside the project area. For using recycled water, a pumping main will be provided from the STP to the proposed Ground level reservoir inside the project area Zero Discharge Concept The concept of Zero Discharge is: Figure 8-2: Existing Sewerage Network Wastewater/Sewage Treatment Plant Proposed township is to be developed mainly as industrial hub (non-polluting) followed by commercial and residential land use and hence the sewage generation will be of domestic municipal nature. Municipal sewage generally contains high BOD, suspended solids, COD, faecal coli-forms and pathogens with respect to disposal norms of receiving water body or to ground. The following By reusing treated waste water for non-potable water demand, justified utilization of natural water resources is ensured; Reuse of treated waste water enhances the capacity of the industry to efficiently utilize available water as well as control its quality to the required level. With an increase in demand of natural resources it is essential to target Zero Discharge system for any upcoming infrastructure development. In view of above, the proposed township has been suggested to meet its non-potable water demand (e.g. Landscaping, Horticulture, Flushing and makeup water for HVAC etc.) by recycling the treated waste water, hence reducing the raw water 8-3 Final Detailed Site Master Plan Report


146 8.3 Storm Water Drainage Introduction The Delhi Howrah railway line passes parallel to north east boundary of the project area, where as the Kalda distributory canal abuts south western side of the project area. Kot escape canal passes through the north western boundary of project site. Proposed Eastern Peripheral Expressway is abutting southern boundary of the project site. The GNIDA has constructed peripheral storm water drains inside the project site. As per master plan of GNIDA there are two outfall locations at Kot escape canal, namely KE1 located near the intersection of 80m proposed master Plan road and 60 m ROW north-south road and KE2 near OMICRON 1A, which is located 3 km from IIT. The total length of storm water drains is around 16 km Intensity of Rainfall The entire storm water drainage system has been designed for a return period of 2 years with 5 minutes minimum time of concentration restricting to a maximum velocity of 3m/s as specified in CPHEEO. For generation of IDF curves, Past 30 years rainfall data collected from IMD, Delhi has been used Design Parameters for Storm Water Drains The topography of the project site is more or less flat in nature. The northern half of the project area generally gravitates towards the Kot Escape canal, while the rest of the project area gravitates towards the Kalda Distributory canal. The ground elevation varies from 207 m to 202 m. The Surrounding drainage features of the project area is provided in Figure 8-3. The storm water design parameters are studied and following design parameters are considered for the proposed storm water drainage system: a. Design Parameters Using CPHEEO Manual b. Estimation of storm runoff c. Data procured from Indian Meteorological Department d. Rainfall-runoff intensity relationship as per CPHEEO manual e. Storm frequency of 2 years return period f. Coefficient of runoff as per CPHEEO manual Design Criteria for Storm Water Drain Rectangular Brick drain constructed along the 60 m north south road a. Surface drains are considered as far as possible. Hume pipes/ Box culverts will be considered at some locations like road crossing / adverse slope etc. b. Surface drains will be covered. Boundary catchment drains may be uncovered. c. Rectangular section shall be provided for surface drains. d. Minimum size of internal drains will be 300 mm X 300 mm. Minimum size of RCC pipes provided will be 300 mm. e. Mannings formula is used for design of drains Proposed Storm Water Drainage System Figure 8-3 Surrounding drainage Features of project area Covered RCC Drain along the 60 m elbow road near Kalda Distributory Canal Management of storm water within the site is planned as far as possible along the natural topography pattern. Only essential changes to the existing drainage are proposed. Figure 8-4 Existing Drains at Site 8-4 Final Detailed Site Master Plan Report
147 The trunk mains are planned along the central spine road which is designed to cater the storm runoff from the catchment area up to the railway track. This also includes the adjacent villages, i.e., Ajayabpur and Rithori. The trunk main will be integrated with the existing (newly constructed) storm water drains along the North South road. Only essential changes to the existing drainage are proposed such that number of culverts across the arterial road is minimized and depths of outfalls are feasible for gravity flow. The major trunk drains are routed to discharge into the two zones, having their outfall in Kot Escape canal at various locations. The project area is divided in to 2 catchments. The details are provided in Table 8-4 below. The catchment area is provided in Drawing No. TCE.7504A-152-SD-6000 given in Annexure-V. Table 8-4: Catchment details Zone I Zone II Catchment Area 100 ha 256 ha Outfall Location KE1 at north south road KE2 near OMICRON 1A The road side drains are proposed as rectangular covered drains constructed in RCC which would be designed to outfall the storm water runoff into the proposed trunk drain network on the main roads dividing the sectors eventually leading to natural drains. A minimum section of 0.3 m X 0.3 m drain is proposed for internal drains Disposal Scheme The HFL of the trunk drain in which proposed drainage system (drains along the internal roads) is discharging should be lower than the IL of the incoming drain. The proposed layout of the storm water drainage scheme is planned along the sides of the main arterial roads and peripheral boundary. Individual plot developer is expected to connect their internal drains to these main drains planned for the project area Rain Water Harvesting Rainwater harvesting is a technology used to collect, convey and store rain for later use from relatively clean surfaces such as a roof, land surface or rock catchment. Rainwater harvesting creates artificial detention storage and also enhances natural recharge of rainwater into the ground. This reduces as well as delays the peak load on the storm water drainage system. The secondary goal is to alleviate stress on the natural water balance by rainwater conservation either in the form of artificial storage or natural ground water resources. Rain water harvesting is essential for the project area because:a. Ground water will be explored as a source for water supply presently and in future. b. Due to rapid urbanization, infiltration of rain water into the sub-soil is likely to decrease drastically and recharging of ground water would be diminished. c. To enhance availability of groundwater at specific place and time. d. To raise the water levels in wells & bore wells. The engineering design of rain water harvesting system would be based on total run-off volume available within the area, nature of formation & depth of existing ground water level. The schematic storm water drainage network along with outfall is provided in Drawing No. TCE.7504A-152-SD-6001 given in Annexure-V. 8.4 Solid Waste Management General The objective of solid waste management system for the township is to manage waste generation, storage, collection, transportation, treatment and disposal of solid waste in a manner that is in accordance with the applicable statutory norms and the best principles of public health, economics, engineering, aesthetics, and other environmental considerations. Solid waste is generated from a number of sources which include households (kitchen and yards), commercial areas (shops, hotels, and restaurants), non polluting industries (raw material, packaging and e-waste), institutions (schools, hospitals, and offices), parks (fallen branches, leaves from trees) and streets (sand, silt, clay, concrete, bricks, asphalt, residues from air deposition and dust). The Ministry of Environment and Forests (MoEF), Government of India, published Municipal Solid Waste (Management and Handling) Rules 2000 (MSW Rules 2000) and E - waste (Management and Handling) Rules 2011, issued on May Tentative Quantity & Area Required: IIT-Greater Noida would be an integrated township, which would have non processing industries, commercial activities, institutional and residential product mix. The assessment of waste from these proposed product mix for IIT-GN would be based on metro cities, integration plan approach and current practices of Class -I towns of U.P. State. The facilities would be independent to the extent possible and adopt the philosophy of minimum discharge. The approach for selection of unit rate of solid waste assessment from various sources at IIT-GN has been referred from similar nature of town in U.P. State, in absence of appropriate information, CPHEEO/ NEERI & GNIDA reports have been referred. Thus, the solid waste generation from IIT-GN has been considered in the range of MT/ Day to MT/ day as per prevailing and applicable norms. Either CPHEEO or RCUE standards/ norms may be approved so as to work out and finalize the waste generation from integrated township. Since, CPHEEO norms are widely applicable throughout the nation, thus it is recommended to adopt the same for IIT-GN. Table 8-5: Type of Waste and Generation as per CPHEEO & Regional Centre for Urban and Environmental Studies, (RCUE) Lucknow for Agra City Quantity S. N. Source CPHEEO RCUE Unit 1 Residential Land use kg/cap/day Commercial Land use* kg/unit/day 2 Commercial Floating Population kg/cap/day 3 Hotel Industrial Workforce Participation kg/cap/day 5 Institutional (school under PSP) kg/cap/day 6 Roads kg/cap/day 7 Street Sweepings* kg/ km/ day Open Space Land use* kg/acre/day 8 Garden/ Open Area kg/sqm/day 9 Biomedical waste/ Hospital kg/bed/day 11 e-waste ** % MT/day Total Waste Generation [Source: GNIDA Master Plan 2031, RCUE, CPHEEO Manual 2000, NEERI and Civil Engineering Handbook * Commercial and Street Sweepings Wastes & Open Space Landuse: Regional Centre for Urban and Environmental Studies (RCUE), Lucknow, referred in absence of Commercial establishment norm in the GNIDA, CPHEEO and NEERI Reports. ** E-waste generation in India: e-wastes are disposed off each year, which accounts for 5% to 7% of all municipal solid waste. {Source: e-waste India, Research Unit (LARRDIS) Rajya Sabha Secretariat New Delhi, June 2011}] 8-5 Final Detailed Site Master Plan Report
 Rules 2011, The Hazardous waste (Management, Handling and Trans-boundary Movement) Rules - 2 2008, Biomedical Waste (Management & Handling) Rules -3, 2000")
148 8.4.3 Proposal for Solid Waste Management within Project Boundary Waste generated in the form of biodegradable and recyclable shall be in the preview of local 1 authority of IIT-GN. However, E-waste (Management & Handling) Rules 2011, The Hazardous waste (Management, Handling and Trans-boundary Movement) Rules , Biomedical Waste (Management & Handling) Rules -3, 2000 shall be abide accordingly. As per the MoEF guidelines, all the biomedical waste and E-Waste shall be collected separately by the polluters/ generators within their premises and shall be separately handled by authorized vendors. Thus there is no proposal of processing/ segregation of E-Waste and Bio-Medical Waste from Industries and Hospital Tentative Proposal for Transfer Station & Site Selection: A waste transfer station is an important component of a waste management system and functions as a link between a community s solid waste collection program and a final waste management system. There may be significant differences in the facility size, ownership and services offered but the basic purpose is to consolidate waste from multiple collection vehicles into larger long-haul vehicles for more economical shipment to a final waste management system. The basic type of transfer station has a designated receiving area where waste is unloaded, often compacted and reloaded into larger high volume vehicles, usually in a matter of hours. The environmental impact of a waste transfer station are expected to be minimal due to the fact that waste is not disposed off at the site, there is no long term storage of waste and all waste shall be contained while on site. Transfer stations may also function as centres to separate or sort waste into portions that may be reused or recycled further reducing the final volume of waste that is transported for disposal. The planning for segregation, transportation and processing has been considered only for Municipal Solid Waste (MSW) of MT/ day to MT/ Day. In the layout plan, the area considered for Transfer Station is 1.0 Ha for MSW waste, kept on higher side so as to have maximum buffer and green area Site Selection for Transfer Station (TS) The consultant has studied various locations feasible for Solid Waste and comes out with proposed location as shown in layout plan due to the following benefits: Out of two alternate locations (one in southern side and another in extreme north of project); location of alternate -2 (on Extreme North-East) has been finalized as directed by SPV. Alternate -2 have been selected after discussion and considering the future social implications. Considering wind direction and flow from NW to SE, location fits well, as there is no habitation nearby. The site is connected with Solid Waste Landfill-cum-Processing unit proposed by GNIDA for Greater Noida. The Upcoming Landfill site (as in GNIDA 2031 MP) is about 15 km (near Astoli village) from proposed TS and thus the TS would be a link between IIT-L and Landfill site. The proposed upcoming Landfill site (by GNIDA) would have all processing/ treatment facilities to segregate and treatment of the waste using state-of-art RDF technology (Refuse-Derived Fuel) therefore it would be convenient and economical to have final waste management for residual waste including disposal of inert at Landfill site only. The Location of the transfer station is provided in Figure 8-5. The proposed Transfer Station within the project boundary would have facilities like storage of waste for utmost 03 days, secondary segregation, and composting (bio-methanation) for energy production from organic waste, transfer facility from source to TS and TS to landfill site. The location for solid waste landfill (as proposed in GNIDA Draft Master Plan 2031) site has been retained for the project site to have an integrated approach with GNIDA Master Plan Planning for different types of waste generated from Project area: The solid waste shall be segregated & collected at central waste collection facility (i.e., Transfer Station) using (Automated waste collection system), from where it will be transported by compact Trucks (equipped with GPS) to nearest Engineered Landfill site by hired waste management/ DBOOT contractor for their treatment & disposal. Biodegradable/ Compostable Waste: In general about 43.9% of total MSW are biodegradable in nature. Thus total biodegradable/ compostable waste from IIT-L would be approx TPD out of total TPD (excluding E-Waste & BMW). It is proposed to compost this waste by either Bio-Methanation or cogeneration process so as to plan for sustainable process plant in terms of electricity requirement. It is also planned that composting would be done within area earmarked for Transfer Station on layout plan. The compost can be utilized to maintain internal greeneries as manure and excess of same can be planned to sell out to the vendors. Recyclable Waste: Approx. 21.2% of total waste would be recyclable in nature which comes out to be about TPD. A policy would be formulated to deal with recyclable waste and can be sold out to the vendors through either PPP or any other mode. Non-Biodegradable Waste: Generally, about 34.9% of total MSW wastes are non-biodegradable in nature which comes out to be approx TPD. To cater non biodegradable/ inert waste, it is proposed to transport these waste to the upcoming landfill site (as per GNIDA master plan 2031). At landfill site, these waste can be further segregated and inert/ residual can be disposed off into the landfill. E-Waste: From Indian scenario, approximately 7% of total MSW are E-Waste which comprises of old TV, printers, computers and its accessories, CFL or other lightings, Mobiles etc. As per prevailing norms for EWaste in India, it is mandatory to segregate the E8-6 Waste separately and deal with the same at each premises level. A policy may be framed to support the producers of E-Waste so as to manage the same through external agencies. The planning for engaging external agency would be done at PDR stage of this project. Bio-Medical Waste: As per the prevailing norms for handling & managing BMW waste, it is the utmost responsibility of polluter to deal with these wastes separately. The hospitals are required to get engaged with local NGOs or firms working in the same field so as to manage their biomedical wastes. Approximately about 25% of total wastes generated from hospitals are biomedical wastes in nature. Construction Waste: The construction waste generated during construction/ development of township would be planned to get utilized within the township for filling of roads/ embankments or for construction of pavements. Excess of same would be disposed off in a much secured manner to the nearby low lying area along roadside. The quantity of construction waste cannot be determined at this stage and would be quantified at later stage. Figure 8-5: Location of the Solid Waste Transfer Station Final Detailed Site Master Plan Report
149 catering to the ultimate power demand. 8.5 Power Scope The scope of this section is to draw out broad strategy for developing the power supply system for proposed township. The site for the proposed Integrated Industrial Township is part of the delineated site for Delhi-Noida-Ghaziabad Investment Region (DNGIR). It has a total site area of Ha (747.5 acres). The proposed township is planned adjacent to the already developed sectors of Greater Noida Location of 220kV GIS Sub-Station (Main Receiving Substation-MRSS): There are following reasons to identify location of electrical substation in centre and North- East side of the plot: Power Demand Calculation For planning of external electrical infrastructure estimation of total power demand has been made for each product mix of the project area based on proposed land use, power demand norms & considering FSI s. Based on the power demand norms & FSI s adopted for IIT total ultimate power demand is about 182 MVA. i. Less Cable corridor requirement due to central location. ii. Cable length will be reduced due to central location. iii. Cable sizes will be reduced due to less voltage drop. iv. Space requirement will be less as 33/11kV sub-station is located at same place. v. No extra 33kV switchgears are required if 220/33kV Sub-station and 33/11kV sub-station will be located at same place. vi. 220kV MRSS is located at N-E Side of plot as N-W side is prime land as per urban planner Power Source Identification Immediate Power requirement At present the growth plan for development is not finalized, therefore to meet immediate requirement it is suggested to go for 33kV supply which can meet maximum power requirement of 10 MVA. As per NPCL proposal on proposed Electricity supply to DMIC Project at Greater Noida vide letter dated , 33kV power supply for construction purpose can be sourced from nearest 33/11kV substation at XU-1 or 220kV sub-station at RC Green Permanent Power requirement Integrated Industrial Township (IIT) at DMIC Dadri shall be supplied through double circuit lines from two separate source sub-stations, thus providing redundancy with respect to source in case of outage of any one source at a time. Hence, 220 kv MRSS is chosen at the centre location & N-E Side of plot near Ajaybpur village. HV / MEDIUM VOLTAGE OVERHEAD LINES: Power demand required for existing villages is already considered while estimating total demand for IIT Renewable Energy Potential: Solar based generation requires huge area of land to generate each unit. However, with an increased emphasis on renewable energy, such generation can be pursued in un-usable area of the designated plot, roof top of common infrastructural buildings or on the roof tops of consumer installation. However, such a composition of solar plants may not be able to supply to the requirement of the entire IIT but shall be able to cater to a limited extent which can be used to feed the street lighting and utilities load. The main advantages of canal top solar panel installation are; Table 8-6: Space Requirements for Electrical Infrastructure (1) 400/220 kv UPPTCL Existing Pali Substation (Present capacity of 1415 MVA) (78kM away from IIT Site Selecting voltage levels for transmission & distribution for IIT: According to existing power supply code prescribed by UP Electricity Regulatory Commission following are the norms adopted for the selection of the power supply voltage level. Up to 63 KVA -433V Supply Above 63 KVA and up to 3000 KVA -6.6 / 11 kv power Supply Above 3MVA & upto 10 MVA- 33 kv power supply Above 10 MVA- 132/220 kv power supply 1 220/33kV EHV Substation including 33kV Centralized Switchgear & Intermediate 33/11kV Substation Quantity (Nos.) 1 Proposed area Remarks 120M X 120M (1.44 Ha) Considered GIS Substation (3.55 acre) Source: Consultants Estimate Since the maximum power demand of IIT is 182MVA the ultimate power demand can Observations on Existing Transmission Lines only be fed on 220kV voltage level and hence 220kV voltage level has been adopted for 220kV OVERHEAD LINES: 8-7 EXISTING Space requirements of following Internal Electrical Infrastructure are shown in Table 8-6 below: Description 0.433kV) Some medium voltage existing lines are within the site boundary, which are feeding power supply to existing villages (Ajayabpur & Rithori). NPCL has authorized for development, operation & maintenance of these medium voltages existing lines. Since the existing settlements also need to be taken care while constructing IIT, the overhead lines of the villages are to be revamped to underground systems which is to be adopted for entire IIT. IIT will pay deposit amount to NPCL for dismantling & rebuilding the existing lines Space Planning for Internal Power Distribution Sr. No. (11, Proposed source sub-stations by UPPTCL are: (2) 400/220kV Chholas ( Sikandrabad) Substation which is under construction (1314kM away from IIT Site) 220kV existing overhead line is going through plot in northern west parcels. As discussed with GNIDA, rerouting of this existing transmission line is not possible so 35 metre corridor is required and only landscaping work can be done in this area. (a) Minimum use of Usable Land (b) Conserve water by reducing the evaporation losses of canal water. (c) Generates Green energy Presently, with reference to DMIC Dadri plot plan, the 800m long wide canal through the plot can be utilised to install a Canal-top solar plant with Photovoltaic (PV) technology. Considering an area of sq m; and geographical position of Dadri with respect to the longitude, latitude and elevation, a Final Detailed Site Master Plan Report
150 1.0MWp solar PV installation is possible. About 1752MWh / year generation is possible with an expected capacity utilization factor (CUF) of 18% which shall be fed to the base power supply to feed the street lighting and utilities load. Similarly, DMICDC can encourage the consumers to install solar power on roof tops that can be connected with the network by offering motivating incentives for those who undertake such measures. Such plants can be installed in the un-usable area of the designated plot like Canal top, roof top of common infrastructural buildings like Substation, commercial complex, schools and hospitals etc. The estimated available area for roof top solar panels is around 247 acre area (considering average 45% ground coverage of total plot area 223 Ha including residential, commercial and industrial plots and utilities). Land requirement is approx. 5 acre/mw. Approximately 8MW solar power can be generated by considering 18% capacity utilization factor. a. b. c. d. e. f. This can be achieved by the extensive use of ICT services and Solutions. To intensify the use of Internet and Telephony; As regard wind based generation, Greater Noida is not under recommended wind zone for the Wind Power Plants, hence this option cannot be considered for power generation. 100% coverage with Citywide High level of Cell phone network penetration, 3. Wi-Fi at all public Places and Campus wide Educational Institutes, 4. Public Service kiosks, Solar powered LED street lighting: Approx. 40% solar powered street lighting load shall be considered. 100% standalone solar PV panels on each street lighting pole cannot be recommended due to following reasons; (a) (b) For 60-80M ROW: Solar powered street lighting are not recommended in main carriage way as required lux level shall not achieved due to high road width in 60-80M.Solar powered lights are considered only in secondary carriage way, Cycle track, Pedestrian Pathway Scope of this Report The scope and coverage for this report includes the following systems / sub-systems For 30-45M ROW: Solar powered lights are recommended only in main carriage way, Cycle track & Pedestrian Pathway. Standalone solar street lighting near high rise buildings cannot be proposed due to constraint of less sun. 8.6 Information and Communication Technologies (ICTs) Component General Integrated Industrial Township s performance depends not only on the endowment of hard infrastructure ('physical capital'), but also, and increasingly so, on the availability and quality of knowledge communication and social infrastructure ('intellectual capital and social capital'). The latter form of capital is decisive for industrial and institutional competitiveness. The significance of these two assets - social and environmental capital - itself goes a long way to distinguish integrated townships from their more technology-laden counterparts, drawing a clear line between them and what goes under the name of either digital or intelligent cities. Integrated Industrial Township - Identified (and ranked) along six main axes or dimensions: Primary POP Layout & Configuration o Secondary POP Layout & Configuration o Tertiary POP Layout & Configuration o Ducting Layouts & Configuration o Manholes & Hand-holes configuration Integrated Operation Center (IOC): Each house should have 100Mbps internet backbone connectivity, Solar power can be generated 5 % of total power demand by installing roof top solar panels at each consumer plots and canal top solar panel. o Data Center Sizing Smart Economy Smart Mobility Smart Environment Smart People Smart Living Smart Management The Integrated Operations Center (IOC) is the heart of the ICT backbone where the overall monitoring and control of major functions of the communication network resides. The actual control of the various systems / subsystems will be done through their respective control centers. The proposed floor layout is shown below in Fig 8-7 & 8-8. The required data for monitoring these system / sub-system operations will be sent to the relevant Control Centers in the IOC. The different Control Centers envisaged for various functions are: Command & Control Center (CCC) Physical Security Operations Center (PSOC) Facility Operations Center (FOC) Integrated Operation Center (IOC) o Data Center Operations Center (DCOC) o Main / Primary Point of Presence (POP) o Command & Control Center (CCC) o Network Operations Center (NOC) o Secured Data Center (SDC) o Network Security Operation Center (NSOC) o Data Center Operations Center (DCOC) Emergency Response Center (ERC) o Main / Primary Point of Presence (POP) Multiple Situation Rooms (SR) o Network Operations Center (NOC) City Cockpit (CC) o Network Security Operations Center (NSOC) Contact / Call Center o Physical Security Operations Center (PSOC) Police Control Rooms (PCR) o Facility Operations Center (FOC) Educast / Multimedia Development Center (Educast) o Emergency Response Center (ERC) Smart DNGIR Portal Development Center (Portal) o Multiple Situation Rooms (SR) Cloud Computing & Big Data Services Center (Cloud) o City Cockpit (CC) ERP/CRM Application Services Center (ERP) o Contact / Call Center GIS Mapping & Coordination Center (GIS) o Police Control Rooms (PCR) Secured Data Center (SDC) o Educast / Multimedia Development Center (Educast) o GIS Mapping & Coordination Center (GIS) Outside Plant System 8-8 Final Detailed Site Master Plan Report


151 Figure 8-7: Integrated Operations Centre (IOC) ICT rooms layout (GND. Floor) Figure 8-7: Integrated Operations Centre (IOC) ICT rooms layout (1st FLOOR) 8-9 Final Detailed Site Master Plan Report
152 Table 8-7 : Systems / Sub-systems & Services to be covered as a part of server sizing for Data centre Sr. No. Sr. No. Access Control Boom Barriers, Bollards, Flap Gates, etc. System / Sub-System Connected Help Points 8 1 RFID Asset management for all entities Along Roads Smart Logistics 9 Integrated Traffic Management System 10 Public Grievance Redressal ANPR System at Traffic Junctions Land Record Management Red Light Enforcement Enquiry Management Parking Management System Citizen & Authority Interaction GPS Vehicle Tracking System City HR Management 11 Multipurpose Smart Card SCADA System Utility Billing Alternate Renewable Energy systems - SPV NFC Phone based Smart Services 12 Multimedia Development system Multimedia broadcast for Variable Message Signs / City-wide Video Wall Displays 13 City-Wide Wi-Fi System Water, Sewage, Flushing Water & Storm Water Networks Wireless Smart Metering for power, water, gas Smart Street Lighting City wide hot Spots Wireless Sensor networks Campus-wide wireless Smart Poles Smart Home Systems / Networks Mobile Resource Access 14 Citizen Portal Remote Doctor Integrated Billing System for utilities Smart Travel Station Public Interactive Kiosk GIS Development & Mapping All Networks - Physical (Roads, Buildings, Utilities) & ICT Medical / Health System Inter hospital / Inter Department Interaction City Information Services 6 Smart Citizen Card System Electric Car charging Stations City-wide Smart Power supply network, Smart Grid Monitoring 5 E-Commerce Applications Traffic Signals, Variable Messaging Signs Toll Plaza Vehicle Tracking System 4 Fire Detection & Alarm System City-wide for all Buildings Public Transport Vehicles (MRT/LRT/Bus) 3 Asset Management System City-Wide Video Surveillance System Public Areas 2 System / Sub-System Health Presence 15 Others (subsequently) ERP/CRM Services Cloud Computing & Big Data Services Educast Development & Hosting Virtual Classroom Tele / Video conferencing 7 Safety & Security System Public Transport CCTV Surveillance, GPS Tracking 8-10 Final Detailed Site Master Plan Report
153 Monitoring operations of all mission critical services and devices; S.n No. Servers Required Storage (TB) City-Wide Video Surveillance System Integrated Traffic Management System SCADA System Citizen Portal GIS Development & Mapping Educast Development & Hosting Safety & Security System Asset Management System Fire Detection & Alarm System E-Commerce Applications Smart Citizen Card System Multimedia Development system City-Wide Wi-Fi System Medical / Health System Others (subsequently) TB 2 Total System / Sub-System 42 U Rack Space Band width (Mbps) Work station Ensuring continuous operation of servers and services; Providing quality support for facility wide system users; First line troubleshooting of all mission critical service related problems; Tracking and documenting resolution of problems; and 24 hours a day, 7 days a week supervised operation by highly specialized personnel. Command & Control Center (CCC) The CCC will be the primary work space that service associates and technicians utilize to monitor, manage and troubleshoot problems on DNGIR s mission critical services. The typical layout of the CCC is shown in Figure 2-3 below. The approximate size of the room being considered is 60 X 30. The CCC room is segmented in two parts, one part (40 X 30 ) for operator desks (a workstation with screen, keyboard and mouse), typically 12 nos. and a 3X2 Video Wall Display with associated software and edge blending. The other part (20 X 30 ) separated by a glass wall with a conference room set-up and High Definition Video Conferencing (Tele presence) facility. This consists of Full HD video and 360 audio, link up to different locations, with handheld mobile camera at crisis sites and procedure manuals to deal with any type of crisis situation. The CCC will have in addition IP Phones, Satellite Phone Communication, Mobile Phone communication facility & UHF/VHF Handsets. In the CCC, the staff s primary accountabilities are to monitor the network for faults and performance events then initiate trouble tickets and corrective action as required. They interface with the single point of contact to receive organizational requests for network service changes or troubles The CCC prevents most service disruptions by providing round-the-clock proactive monitoring of DNGIR s critical systems. The CCC provides the capability for effective service-based monitoring by clearly identifying services, their related infrastructure and any impact of service break-down/failure on the business goals of customers m Figure 8-8: Typical Layout of CCC & Tele presence Room Pathway System for OSP Backbone Infrastructure In order to provide the backbone connectivity to ICT services the ducting network for laying the OFC is designed as under: Further during this design phase, the components of pathway system are suitably modified in order to review proposed pathway routing, aesthetic requirements, long range plans that DNGIR has regarding new adjacent plots, paved areas, opens spaces, etc., which could be affected by the design and any unique requirements specific to the project. The pathway system (Manhole, Handhole & ducts) are the foundational component of the outside plant communications distribution system. A pathway system must be designed with provisions that provide for ease of administration, maintenance, future expansion, and replacement of cabling as technology changes. This section describes design considerations for the pathway system that are of particular concern to DNGIR. The pathway system for OSP backbone infrastructure consists of following components: The CCC offers oversight of problems, configuration and change management, facility wide security, performance and policy monitoring, reporting, quality assurance, scheduling, and documentation by utilizing centralized management, monitoring and analysis tools. The CCC provides a structured environment that effectively coordinates operational activities with all participants and vendors. CCC CCC TELEPRESENCE ROOM Table 8-8: Server Sizing for Data Centre m GLASS PANEL Server Area: 10 racks; including Servers, 2 for security and load balancer & 4 for networking switches & router. The CCC technicians typically provide support twenty-four hours a day, seven days a week. Typical daily processes would include: 8952 m Assumptions made for server sizing for Data centre: 8-11 Ducts backbone Manholes-Handholes Final Detailed Site Master Plan Report

154 Ducts Backbone and Design Considerations The Outside Plant Cable is to be placed in duct routes interconnecting the plots within DNGIR Region. Suitable duct sizing has been established within our design to maximize Day-1 and future growth patterns for the infrastructure in coordination with the DSIR backbone considerations. Ducts capacity should be planned such that only 40% of the duct space get filled initially and balance 60% space for future use. an excessively long section, it may be necessary to place pull boxes or specially designed splicing chambers of sufficient size to aid cable pulling and splicing along the span. Detailed duct design is shown in Figure 8-9. Manholes made from light weight Fiber Glass are envisaged. FRP (Fiber Reinforced Polymer) composites consist of an engineered polymer (plastic) and reinforcement (i.e. glass) and can be additionally enhanced with other elements such as additives and core materials. This combination can produce some of the strongest materials. It is envisaged for that all roads in DNGIR shall have at least 30 Nos. of 40 mm dia. HDPE ducts on both the sides housed inside Concrete channel-duct housing units. The categorization of 30 Nos. of ducts can be done as follows: FRP composites provide a host of benefits ideal for structural applications including: 12 Nos. of ducts shall be reserved for approx. 12 Nos. of TELECOS licensed to operate in DNGIR region i.e. UP circle Table 8-9: Telecom Operators providing services in Uttar Pradesh Sr. No. Operator 1 Bharat Sanchar Nigam Ltd. (CMTS License) on 29-Feb Bharti Airtel Limited (UAS License) on 10-Feb Datacom Solutions Pvt. Ltd. (UAS License) on 25-Jan Dishnet Wireless Ltd. (UAS License) on 14-Dec Idea Cellular Ltd. (CMTS License) on 5-Oct Loop Telecom Private Ltd. (UAS License) on 25-Jan Reliance Communications Ltd. (UAS License) on 20-Jul Shyam Telelink Limited (UAS License) on 25-Jan Swan Telecom Pvt. Ltd. (UAS License) on 25-Jan Tata Teleservices Ltd. (UAS License) on 30-Jan Unitech Wireless (East) Pvt. Ltd. (UAS License) on 25-Jan Vodafone Essar Digilink Ltd. (CMTS License) on 12-Dec Nos. of ducts for Cable T.V. operators 3 Nos. of ducts as spares Duct bank configurations inside a concrete channel: The duct banks shall be installed in a tiered configuration maintaining spacing and positioning of the ducts within the bank. Duct banks should be installed with supporting framing or brackets to ensure the duct installation remains straight, levelled and maintains the configuration of the bank. This will help to ensure that excess friction caused by pulling cables through uneven ducts is avoided. Also to provide a secure support of the conduit system, conduit hangers shall be located at specific intervals along the structure. They should be spaced at 2.4 m (8 feet) intervals for 50 mm HDPE. Because of the inherent thermal expansion and contraction of the conduit materials, expansion joints must be provided for each 30 m (100 feet) of conduit run. When conduit crosses a bridge, manholes must be built as termination points should be constructed close to the bridge ends in the approach fill. If, due to bridge length, this results in in the TIA/EIA standards. Communication ducts are to be installed in trenches at a minimum 1200 mm depth and encased in concrete at road crossings. High Strength Light Weight High Strength to Weight Ratio Typically, manholes are installed for main duct banks (i.e. duct banks used for routing large portions of the communications network backbone) and hand holes are installed for subsidiary duct banks (i.e. duct banks serving small clusters of buildings or a single building) by individual plot developers in their premises. Figure 8-9: Way Ducts Housed in Concrete Channel Double Wall Corrugated (DWC) Ducts for Road Crossing: DWC pipes have been recommended for road crossing with 40 mm dia. HDPE ducts envisaged in the above section shall be placed in DWC pipes & then encased in concrete to provide strength and excellent mechanical properties against dynamic traffic loads. DWC pipe/ duct are designed as a technically superior and cost-effective solution for replacement of GI, RCC and PVC pipes in Fibre optic cable networks. Manufactured from rugged and virgin High Density Polyethylene (HDPE), this duct has a double-walled construction. This unique construction, while making it light-weight, gives excellent mechanical properties like high ring stiffness, better impact strength and superior crush resistance. The smooth inner wall facilitates easy insertion of ducts. DWC pipe/ duct have the ability to withstand heavy external loads when properly buried and back filled. (Please refer Figure 8-9 for details) Manholes-Hand holes: Manholes provide accessible space in an outside plant pathway system for pulling, placing, and splicing (Mid Span) of cables. Manholes are also used to segment the pathway system into lengths compatible with standard reel lengths for outside plant cable and to conform to maximum pathway lengths as defined 8-12 When designing duct entry and exit from a manhole, it is desirable to have ducts enter and exit from opposite ends of the manhole. If possible, ducts entering the sidewalls of a manhole should be avoided, given that sidewall entry may reduce overall racking space, may cause minimum cable bend radii to be exceeded, can complicate (or hinder) future cable maintenance and can increase construction costs during cable installation. When changing the direction of the main duct run or subsidiary ducts, the ducts should leave the end wall of the manhole prior to making the direction change. However, on occasions, this may be impracticable and recognition has been given that sidewall duct entry may be necessary or even desirable at times. If sidewall duct entry is necessary, the OSP installer shall ensure that ducts enter and exit at diagonally opposite corners rather than at end wall or sidewall midpoints. Following figure indicates a straight through entry system into the manholes where the fibers are offset and terminated into the splice closures. The splice closures and fiber cable are secured and mounted on preconfigured support brackets this enables field technician s frpee and easy access to work inside the manholes. Final Detailed Site Master Plan Report
155 Figure 8-10: Entry System into Manholes 8.7 Gas Utility Introduction In the neighbouring areas of project site in Greater Noida, Piped Natural Gas (PNG) is already supplied by Indraprastha Gas Limited (IGL), a joint venture of GAIL (India) Ltd, BPCL and Govt. of NCT of Delhi. For the Integrated Industrial Township, an integrated network consisting of PNG and CNG will be proposed. This will cater to the demands of not only domestic and commercial usages, but also the demands by the transportation vehicles. The gas need not be stored on site, as it will be supplied 24x7 through special pipelines only for gas. Supply will be absolutely regular. Normally the pipeline distribution network is based on an on- line supply system that consists of safety valves and regulators that control and monitor the gas supply and pressure, and assist in identifying system leaks. Thus, an un-interrupted supply at a constant pressure is assured. The pipeline system in and around Delhi/NCR is as shown in the following figure Environmental benefits: PNG is pollution free hence, no future threat on account of pollution. Safe & Reliable: PNG is lighter than air, therefore in case of leakage, it will dissipate quickly. Productivity & Profitability: Improves product quality of industries in many cases, because of added convenience and safety. Better Inventory Management: Direct supply through pipe, therefore no additional man power required for inventory management. Hassle Free: Reduces hassles of compliance confirming statutory regulations of Govt. Authorities like Pollution Board, Fire & Safety etc. No spillage and pilferage: unlike other conventional fuels like HSD and LDO, spillage and pilferage is avoided due to use of metering and regulating skids. PNG also finds use in industrial and commercial sectors CNG Compressed Natural Gas is a mixture of hydrocarbons, mainly methane, in the range of 89% to 90%. It is compressed to a pressure of Kg/cm² (g) to enhance the vehicle onboard storage capacity. Selection of any filling station mainly depends on the potential load/traffic flow and consequent demand for gas in a given area and therefore is independent of any minimum/maximum distance criteria. While selecting location for such filling station, it will be ensured that it increases the geographical spread of CNG distribution network with respect to the regional context providing a comfortable refuelling to all customers at the CNG stations. Though actual refuelling time varies from 2 to 3 minutes per vehicle at the dispenser point, waiting time ranges from 5 to 10 minutes depending upon the type of vehicle viz Auto, Car, and Bus etc in non-peak hours/peak hours..commercial PNG This customer segment comprises of Hotels, Restaurants, Hospitals, Dairies, and Bakeries etc. Major applications of PNG in this category are in Kitchen, Ovens, Boilers, and Geysers etc. Some of commercial complexes offices use PNG for electricgenerators and for air-conditioning also. Industrial PNG Industrial customers use variety of fuels for Boilers, Thermo pack, Kiln, Oven, Furnace, and power gen-sets. There is a huge array of customers including manufacturing industries, who can be benefited by use of PNG PNG PNG is the Natural gas supplied through Medium Density Poly Ethylene Pipe Lines at a certain pressure. Chemically PNG consists of Methane up to 98% along with some other constituent. The Piped Natural Gas (PNG) has many advantages over the conventional fuel gases and LPG. Benefits: Cost Saving: PNG is cheaper fuel than most of the existing fuels like LPG, Coal, FO, LDO etc. Convenient: PNG is distributed through pipelines directly at premises. There are no hassles of handling, refilling & changing of cylinders. Economical: Most gas appliances are low on operational cost than electrical ones. Pipeline delivery Figure 8-11: Gas Supply System in and around Delhi/NCR Relatively immunizes against inflation of transportation costs. Source: Final Detailed Site Master Plan Report
156 9. Final Layout Plan This is the chapter on assessment of the two Layout Plan Options which are detailed out in the previous parts of this report. Throughout this report, the Consultants have systematically included the context, process, principles and features of the Final Site Layout Plan Options for the proposed flagship project of IIT. In this section, the Consultants have presented the Final Layout Plan which is an outcome of methodic assessment of the two options through select parameters with intent to achieve a pro Low Carbon Township. Accordingly the Final Layout Plan is recommend to the Client as the most suitable Option for the envisaged development. 9.1 Option Assessment The assessment task is done considering various parameters (category-wise) that are crucial in analysing the different facets. The parameters are further classified and assessed as illustrated in the following table. Option 1 Parameters Option 2 R&D Central Distribution of Residential Parcels The residential clusters located at two distant locations At three different locations, zoned at regular intervals Green Open Spaces Linear structured, with Informal shaped bigger Central Green Parcel Two major Central Parks, with connecting linear greens Mostly Mid-size and bigger plot range. All types of Plot with the entire required plot range. Total Lane-Kilometres Total Road Length Lane-Kilometres Retained Lane-Kilometres Demolished Length of Road-adjacent NMV Routes Length of Greenways ~100% ~100% Modular Plot Size and Range Road Network Table 9-1: Option Assessment of the Final Site Layout Plan Option 1 Parameters Option 2 General Estimated Residential Population 28,962 (considering initial Phase) 34,062 (considering initial Phase) 42,966 (considering future Phase) 48,126 (considering future Phase) 96 (pph) 113 (pph) 142 (pph) 159 (pph) Gross Density (persons/ ha) Landuse Budget and Built-up Area Industrial 50.77% (equalling 50.8 %) Commercial 5.83 % (against 6.3%) Proposed Landuse Distribution Industrial 46% (against 50.8 %) Residential 10.43% (against 11.33%) Commercial 6.14% (equalling 6.3%) Green Spaces 15.4% (exceeding 13.34%) Residential 9.55% (against 11.33%) Green Spaces 19.18% (exceeding 13.34%) Roads 16.99% (equalling 16%) Roads % (equalling 16%) Note: All landuse distribution percentages are within the permissible variation limit of 10-15% (as per Section 10.12) Link to Node Ratio Junction Ratio Junction Spacing (m) Destination Accessibility Utilities Water Urban Planning Distribution of Industries Transport Network Performance Indices Hi-tech in north, east and west, IT Industries along road corridor, Bio-tech in south, R& D in east along railways. R&D and Bio-tech are planned based on the symbiotic nature of their functions. Different clusters for 4 different industries Hi-tech and IT - Upper/Northern Bio-tech Lower/Southern Waste Water Potable (7.85 mld) Non Potable (13.60 MLD) MLD Potable (8.60 mld) Non Potable (13.99 MLD) MLD Source: Consultants Assessment based on the Final Site Layout Plan Options It s noteworthy from aforementioned assessment that the industrial landuse distribution is achieved more in case of second option as compared to the first one (to that of the prescribed landuse budget). The distribution of other landuses in the second case is also balanced. As a result, there is more floor space for industries and commercial use for the second option. This provides a better platform for engaging more people into employment opportunities. 9-1 Final Site Layout Plan Report
157 Cautiously zoned residential parcels (3 locations at regular intervals) encourages residents to walk to work, thus ensuring healthy practices within sustainable planned township. In a nutshell, Option 2 offers more floor space for various uses that are envisioned for this flagship project. It also implies that the second option has advantages from land saleability perspective and would eventually fetch in more revenue from the development. However there are important parameters like roads and utilities to be carefully appraised vis-a-vis the project objectives whilst opting the most appropriate Site Layout Plan Options. Table 9-2: Smart City Pillars for the Integrated Industrial Township Sr.No. Spatial Planning and Transport Planning Benchmark Option 1 Option persons / ha along transit corridors Gross Density:96 P/ha (initial) Gross Density: 113 P/ha (initial) Gross Density:142 P/ha (future) Gross Density:159 P/ha (future) The Gross density is marginally less than that specified by MOUD for City-scale. The Gross density is close to that specified by MOUD for Cityscale. 9.2 Smart City Pillars of the Integrated Industrial Township In the Context of the Government of India deciding on developing 100 smart cities, it has brought out certain parameters for evolving and rating the smart cities. Smart Cities primarily, are those which have smart (intelligent) physical, social, institutional and economic infrastructure. It is expected that such a Smart City will generate options for a common man to pursue his/her livelihood and interests meaningfully. In this context: 2 95% or residences should have daily needs retail, parks, recreational area within 400m walking distance 100% Residences covered under facilities are the 100% Residences covered under facilities 3 95 % residences should have access to employment/ public buildings by public transport, bicycle/ walk 100% Residences are having access to employment by walk and public transport 100% Residences are having access to employment by walk and public transport 4 EWS Housing - 20% of residential units within 800 m from Transit Stations Entire EWS Population is planned with 500m of transit stations of public transport Entire EWS Population is planned with 500m of transit stations of public transport EWS housing is 18% to total residential housing units (below 20%) EWS housing is 38% to total residential housing units (well above 20%) 1. Competitiveness refers to a city s ability to create employment opportunities, attract investments and people. The ease of being able to do business and the quality of life it offers determines its competitiveness. 2. Sustainability includes social sustainability, environmental sustainability and financial sustainability. 3. Quality of Life includes safety and security, inclusiveness, entertainment, ease of seeking and obtaining public services, cost efficient healthcare, quality education, and opportunities for participation in governance. Instruments that will make/build a smart city are use of clean technology, use of ICT, participation of the private sector, citizen participation and smart governance. In light of the above smart city planning concepts, the options are also assessed with the smart city planning principles as tabulated below:- 5 30% residential and 30% commercial/ institutional in every TOD zone within 800m from transit stations Achieved Achieved 6 Continuous footpath of 2 m wide on either side of the roads Provision of Footpath 2 to 2.5m wide Provision of Footpath 2 to 2.5m wide Additional provision of Greenways 6m wide all throughout the project area Additional provision of Greenways 6m wide all throughout the project area Dedicated cycle tracks 2.5m wide on all roads Dedicated cycle tracks 2.5m wide on all roads 7 are the 9-2 Dedicated cycle tracks Final Site Layout Plan Report


158 9.3 Striving towards a Low Carbon and Resource Efficient Future The Master Planning team had made conscious effort to design both the options on the path of achieving low-carbon development through compact city planning, by developing sustainable urban communities that promote pedestrianization and walkability parameters. If weighed against these parameters, Option 2 ranked higher on achieving them at a greater scale. In the bid to promote concepts such as compact planning, certain smart aspects are adopted in terms of variety of transport facilities, promoting commercial and work zones at walking distance, providing green infrastructure, easy accessibility to public facilities etc. All the above factors will contribute to lead the proposed township towards a low carbon and resource efficient future. EWS parcels are complemented with greenways and parks adjoining the area so as to provide open space and recreational facilities to the resident population of this category. Option-1 has the provision of EWS housing only at one location, however considering the linear shape of the site, Option-2 makes the provision at two locations each on northern and southern side of 80m sector road. This ensures more responsive approach in the second option. The EWS population is almost double in second option. Percentage of EWS population to that of group housing is 18% in option1 whilst it is 38%% in option 2. acts as buffer for HTL, but also accommodates walkways and cycle tracks for the adjoining residential area proposed in both the options. A network of green spaces is proposed adjoining the Kot Escape in both the options. Unlike Option 1 where only a linear green buffer is proposed, Option 2, utilizes the advantage of a presence of a water body, and proposes a neighbourhood park adjoining the water body. Thus Option 2 creates an interlinked green-blue network which provides opportunities for walking, cycling tracks, water features, kiosks, public arts etc impacting activities and creating vibrant public spaces for safe, vigilant and high quality public realm. Moreover a network of greenways is provided throughout the township other than the linear greens along the central spine, so as to promote non-motorized modes of transportation, which calls for a low carbon footprint township. The following sub-section entails assessment of both the options as per the significantly important parameters that are required for targeting towards low carbon development. Figure 9-3: Blue-Green Network for the township Responsive Green Infrasructure Deliverability Providing better Accessibility and Health The Township being linear in shape, it is necessary to distribute residential nodes in suitable areas, and not centralize in one location such that the work-communitycommercial places are within walking distance for the community. This is mandatory to creating sustainable urban communities for the township. While in Option 1, there are two residential nodes proposed, one to the north of the 80m GNIDA road and the other to the south of the 80m GNIDA road, in option 2, there are three residential nodes proposed with an interval of 500m, such that the whole township is covered within the neighbourhood level walking distance. All the residential areas are designed with greenways to promote non-motorized accessibility modes. Achieving Low Carbon Accessibility and Health Renewable Energy Community Focus Figure 9-1: Parameters for achieving Low Carbon Development A Responsive township The township is made responsive by taking into consideration the socio-economic and the environmental needs of the township. The social characteristics of the surrounding area are taken into account while zoning for the township. The zoning for both the options ensures that the functions of the landuses are compatible with the activities adjoining the site. This is ensured for internal site zoning and external surrounding landuses of Greater Noida Sectors. Housing facilities for economically weaker section has been provided within the township. The Figure 9-2: Distribution of EWS in different locations Green Infrastructure for the township Provision of green infrastructure is important due to its multifunctionality on the same piece of land. It helps in the land and water management of an area apart from promoting societal well-being and health. Green Infrastructure for the township include Green buffer for the HT line, green buffer between industrial and residential area, green spaces adjoining the Kot Escape (water features).green buffer for HTL is mandatorily proposed as per the Indian Electricity Rules, in both the options. The linear green space not only 9-3 Apart from the provision of exclusive pedestrian pathways and cycle tracks, multiple modes of public transportation are also provided to commute till the township and also within the township. For instance there is provision to accommodate BRTS lanes in future in the proposed 60m wide central spine for commuting outside the township. The other transport proposals for car share, bicycle share, circulating bus services further aims at reduced carbon footprints for this flagship development. A low carbon generating township ensures a healthy environment, which improves the well-being and health of the society. Final Site Layout Plan Report

159 from a neighbourhood centre. This discourages the need to travel long distances which reduces amount of carbon footprint generated. Figure 9-4: Walkability Catchment of Residential Zone Table 9-3: Low Carbon Assessment Matrix Promoting Renewable Energy use in the Township The renewable energy resources of the Township is understood and opportunities and ways to implement and optimize the use are promoted. The urban design framework for the township, includes regulations for using energy efficient materials such as fly ash bricks, danpalon polycarbonate, alcoa-smog eating facade, insulated metal panels, single skin panels, blingcrete, fiberglass, and energy efficient construction techniques such as low emissivity windows, unitised curtain walling system. The regulations make it compulsory for installing solar panels in all non-residential buildings of the township. The use of such techniques in buildings will be promoted by granting extra FAR to developers adopting sustainable building techniques. Innovative local waste collection and separation facility, and integrated water and waste management plans are established for the township which is elaborated in the previous Infrastructure Assessment section. All the above help function the Township in a sustainable manner. Low Carbon Parameters Option 1 Option 2 Responsive 1 2 Green Infrastructure 2 3 Accessibility and Health 1 3 Community Focus 1 3 Ensuring Deliverability quality of the township The last parameter for ensuring a low carbon generating township is to check the deliverable quality of the township. This parameter significantly works from the client s side where the client must ensure all the deliverables from the consultants end is focused towards a low carbon development and also ensure. In order to achieve a long term carbon operating model, the township is developed along with urban design framework which lists down strategies to develop built environment in cognizance with low carbon concepts. Also a community management model must be placed for the township, to enable long term management and maintenance. Renewable Energy 5 5 Deliverability 5 5 Total Score Thus to assess the two options against the low carbon parameters, a scale of 1 to 5 is assumed and each parameter is given a score against the scale as per its degree of integration in both the options on a qualitative basis. Score 1 in assessment scale signifies least compatible to low carbon parameter while score 5 signifies maximum compatibility. The compatibility to the low carbon parameter proportionately increases with greater the number. Each option has been assigned scores after a qualitative assessment. Total scores of both the Options show that Option 1 scores 15 whereas Option 2 scores 21 thus proving to be integrating low carbon parameters at a higher degree. This assessment proves that the option recommended to th the SPV on 20 September meeting is focused towards a low carbon development. Making the Township Community Focused Creating sustainable urban communities is one of the approaches that have been adopted for planning the township. In keeping with the same, the township has been broadly planned into four sectors, each one being self-sufficient in itself. The sectors are planned such that the local employment opportunities are maximized, along with neighbourhood level recreational and commercial facilities. Thus in Option 1 two mixed use neighbourhood centres are proposed while in Option 2, three mixed use neighbourhood centres are proposed. In Option 1, the pressure on transportation and public routes is distributed to two locations while in Option 2; it is distributed to three locations, which gives it the advantage of generating lesser traffic volumes 9-4 Final Site Layout Plan Report
, the panel had approved Option 2 with minor modifications. The suggestions for modification on the Layout Plan included:1.")

160 9.4 The Recommended Option Final Layout Plan The Consultant had revised both the options based on revised boundary (as demonstrated in the report) and th presented to the Client for their decision. During the SPV meeting of (20 September 2014), the panel had approved Option 2 with minor modifications. The suggestions for modification on the Layout Plan included:1. Enhancing and emphasizing CBD Central Business District core within the plan 2. Corresponding the Industrial percentage distribution, to 50% of the Township s land use distribution as per section of GNIDA regulations. 3. Green spaces may be reduced so as to accommodate the increase in the industrial area. After incorporation of the modifications, landuse distribution of industrial use for recommended plan is achieved as per GNIDA Master Plan 2021, Section th The modified Layout Plan was presented in 11 December, 2014, where achieving 50% for Industry category landuse was insisted upon by compromising on the green area of the proposed township. Thus to increase percentage of industry category landuse, further modifications were accommodated in the proposed plan. The modifications were as follows:1. The width of green buffer between non-polluting industries and residential was reduced from 50m to 25m. 2. The width of linear park along both edges of central spine was reduced from 50m to 25m After the above modifications, the percentage of industries increased to % which is as per the permissible variation limit as suggested in the GNIDA master plan sec This version of Layout Plan was th presented to SPV on 30 December, 2014 to which further modifications were suggested in terms of location of th utilities and internal road layout. The modifications suggested on 30 December, 2014 were:1. Shifting of Solid Waste transfer site from the southern end to the north-east corner 2. Removal of proposed Sewerage Treatment Plants from the subject site and utilising operating STP of Greater Noida Authority. 3. Introduction of loop road at the south end of the side thus connecting the 60m wide central spine road to the 45m wide road abutting the eastern edge of the site. Subsequent to this, the Client suggested further modifications through feedback report these were th incorporated and presented to the Client on 13 January The adjoining Layout Plan is the Final Layout Plan submitted for approval. Figure 9-5: Proposed Final Layout Plan_IIT Ddri 9-5 Final Site Layout Plan Report
 Industries The final statistics of the Final Layout Plan such as Landuse Distribution, Population densities and FAR are enclosed in this sub-section. Bio-tech Industries 1.")
 Industries 36.18 Hi-tech(Type B-IT/ITES) Industries 26.")
161 9.4.1 Final Layout Plan Statistics Landuse Distribution - Option Hi Tech (Type A-flatted) Industries The final statistics of the Final Layout Plan such as Landuse Distribution, Population densities and FAR are enclosed in this sub-section. Bio-tech Industries R&D Table 9-4: Landuse Distribution for Final Site Layout Plan Hi Tech (Type B-IT/ITES) Industries Land Use Category Area (ha) % Distribution excluding Sector Roads Total Industries Commercial/ Mixed Use Residential - Group Housing Residential - EWS Housing Hi-tech(Type A-Flatted) Industries Hi-tech(Type B-IT/ITES) Industries Bio-Tech Industries R&D Commercial Mixed Use Resident Population Estimation for IIT Greater Noida Residential Group Housing Residential EWS Housing Total Residential The resident population for the project are based on the prevailing FAR values as per GNIDA Building Regulations for the initial phase of the project. The projections for Final Layout Plan are tabulated in the Table 9-5. However it is envisaged for the project that during the subsequent phase, as the IIT will be operational, it would generate more demand and at that stage, there will be need for articulated FAR Values. Therefore for the next phase, the enhanced FAR values and resident population is projected and depicted in Table 9-6. Utilities Green Open Spaces Site Layout Plan Roads Sector Roads Open Spaces Utilities 8.85 TOTAL AREA TOTAL AREA (excluding Sector Roads) Internal Roads Figure 9-6: Pie Chart showing Landuse Distribution for Final Site Layout Plan Note: It is envisaged for this iconic development, the total permissible Global FAR will be 2.5 (per design basis and Client s requirement). In order to meet these development demands, the respective FAR values for the various Landuse categories are articulated and enhanced as depicted in the Table 9-6. Table 9-5: Projected Resident Population for Final Layout Plan: GNIDA FAR Values Sr. No. 100% Land use Category Residential Group Housing Residential EWS Housing Total Plot Area (ha) Proposed FAR Total Built-up Area (ha) Population Generation/ Unit rate Proposed Employment Generation and Population persons/ dwelling unit* persons/ dwelling unit** 9450 Total 34,062 Total Project Area Gross Density 113 persons/ ha * Assuming average DU area of 150 sq m; ** Assuming DU Area of 40 sq m 9-6 Final Site Layout Plan Report
162 a. Core Zone inclusive of Computer Hardware & Peripheral units, software development units, middleware units, ICT/EDI units Table 9-6: Projected Resident Population for Final Layout Plan: Future Phase Sr. No. Land use Category Residential Group Housing Residential EWS Housing Total Plot Area (ha) Proposed FAR Total Builtup Area (ha) Population Generation/ Unit rate Proposed Employment Generation and 4.5 persons/ dwelling 4.5 persons/ dwelling unit ** b. Non-core zone inclusive of data processing units, Infrastructural support like voice and data communication, water & sewerage management, E-waste management, health care, recreation and allied infrastructure 38, Bio-tech industries will include setting up of industries related to bio-pharma, bio-services, bio-agri, bioindustrial and bio-informatics 9450 Total 48,126 Total Project Area Gross Density 159 persons/ ha * Assuming average DU area of 150 sq m; ** Assuming DU Area of 40 sq m Source: Consultant s Calculations based on articulated FAR Values The following table indicates the Estimated Built-up Area for the IIT, Greater Noida for the future phase based on articulated FAR Values (Note - this is purely subject to future demand and subsequent approval of FAR values by the authority). 4. R&D industry category will include basic/fundamental research, applied research, experimental research in sectors such as aerospace & engineering, pharmaceuticals, manufacturing, IT etc. 5. Commercial/Mixed use category of landuse will include combination of building uses (commercial, cultural, institutional) such as hotels, shopping malls, convenient shopping, retail, exhibition centre, convention centre, offices, banks, leisure/ entertainment centre, community centre etc. Figure 9-7give a visual idea of the arrangement of FAR zones (subsequently leading to high density area) in the proposed Final Site Layout plan. It is clearly observed that the land use category with higher FAR is zoned along the central spine (transit corridor), and subsequently the lower FAR zones are zones away from the corridor. This gives a scenario where more number of people are forecasted to get easy accessibility. The building height arrangement gives an idea of the massing for the proposed site area. Table 9-7: Proposed Built-up Area and Population for IIT Greater Noida Sr. No. Land use Category Proposed Maximum FAR Proposed Maximum Ground Coverage (%) 1. Hi-tech(Type A-Flatted) Industries Hi-tech(Type B-IT/ITES) Industries Bio-tech R&D Commercial Mixed Use Residential Group Housing Residential EWS Housing Utilities 1 50 Proposed Global FAR 2.5 Proposed Global Ground Coverage 25% Note 1: Proposed Maximum Ground Coverage for the township will be limited to 25% Note 2: 1. Hi-tech (Type A-flatted) industries will include manufacturing industries in sectors like food and beverages, television & equipment, chemical and chemical products, textile and apparel 2. Hi-tech (B-IT/ITES) industries, as per UP IT policy, will include two sub category units such as Figure 9-7: Proposed future FAR for Final Site Layout Plan 9-7 Final Site Layout Plan Report
163 9.5 Sustainability Score of the Final Layout Plan Note: for details refer ITDP document on Category The principles adopted for the planning of Integrated Industrial Township, are focused on making the township sustainable. The Final Layout Plan focuses towards a low carbon development principles. These are discussed in the subsequent section, based on which the sustainability of the Final Layout Plan is assessed and a scoring is arrived to quantify the same. Maximum Points Data Source Score Parameters Considered for achieving Sustainability Densify To absorb urban growth in compact and dense forms, urban areas must grow vertically instead of horizontally. In turn, high urban densities oriented towards transit support a transit service of high quality, frequency, and connectivity. Walk Walking is the most natural, healthy, affordable and clean mode of travel for short distances and a necessary component of the vast majority of transit trips. Thus walking forms the basis for sustainable transport. The key factors for making walking appealing are safety, comfort, shortness and directness. MIX Mix When there is a balanced mix of complementary uses and activities within a local area/neighbourhood, many daily trips remain non-motorized short and walkable. The two key objectives for this principle are the provision of balanced mix of landuses and a balanced mix of resident income levels. Cycle Cycling is an elegant, emission-free, healthy and affordable transport option that is highly efficient and consumes little space and few resources. The key factors encouraging cycling are the provision of safe street conditions, and secure cycle parking and storage. Complementary Uses Residential and Nonresidential uses combined within same or adjacent blocks 10 Development is internally complementary 6 Affordable Housing Percentage of residential units provided as affordable housing 4 34% of all residential units are affordable 4 Accessibility to food Percentage of buildings that are within 500 meters radius of a source of fresh food. 1 Each sector has provision for retail function 1 15 Mix Score 11 Connect Short and direct pedestrian and cycling routes require highly connected network of paths and streets around small, permeable blocks. A tight network of paths and streets offering multiple routes to many destinations can also make walking and cycling trips varied and enjoyable. An urban fabric that is more permeable to pedestrians and cyclists than to cars also prioritizes non-motorized and transit modes. Shift Shift indicates the increase of transport mode from motor vehicles to public transit systems and other sharing systems. Transit Transit connects and integrates distant parts of the city for pedestrians. Access and proximity to high capacity public transit service such as BRT is the key objective for transit. Category Maximum Points Data Source Score 15 Landuse density is higher than the surrounding area Densify Score 15 DENSIFY Compact - In a compact city, or a compact district, the various activities and uses are conveniently located close together, minimizing the time and energy required to reach them and maximizing the potential for interaction. With shorter distances, compact cities require less extensive and costly infrastructure Quantifying the Sustainability Parameters Each parameter described above, has sub objectives with each having maximum scoring points. For the purpose of evaluating the Final Layout Plan for IIT on the basis of urban planning components, only select parameters (with subobjectives) are considered; though the ITDP documents enlists various parameters (mostly hard-core transport and building design oriented that are applicable on a city-scale rather than the township level planning). Therefore altogether, the select scoring accounts to be a Total of 64 points across all the objectives. The allocation of these points approximately reflects the level of impact of each metric in creating a transit oriented development. These select parameters have been adopted from ITDP s TOD standards. Landuse Density Average comparison conditions density to in local The scoring system provides a method to quantitatively measure the extent to which a given project leverages land use and design to support the use of transit, cycling and walking and to minimize car-use, i.e. to measure the extent of sustainable planning for the project. 9-8 Draft Site Layout Plan Report
164 Maximum Points Data Source Score Category Cycle Network Walkways Percentage of block frontage with safe, wheel-chair accessible walkways 3 All the block frontages have dedicated sidewalks (100%), building frontage are wheel-chair friendly 3 Crosswalks Percentage of inter-section with safe, wheelchairaccessible crosswalks in all directions 3 All the junctions are equipped with 2m wide pedestrian crosswalks and are wheel-chair accessible (100%) 3 Percentage of walkway segments with visual connection to interior building activity 6 Percentage of walkway segment along building frontages facing the roads out of the complete walkways along the roads. 6 Visually Active Frontage Physically permeable frontage Shade Shelter & Average number of shops and building entrances per 100 meters of block frontage. Percentage of walkway segments that incorporate adequate shade or shelter element 2 N.A due to nature of township CYCLE WALK Category 0 1 Shaded walkways throughout the year is planned by including evergreen trees alongside. (100%) 1 15 Walk Score Maximum Points Data Source Score Percentage of total street segments with safe cycling conditions 2 All the roads have dedicated cycle ways, spatially segregated by median from carriageways. (apart from greenways with exclusive cycle tracks).100% 2 Cycle Parking at Transit Stations Secure multi-space parking facilities are provided at all high-capacity transit stations 1 Dedicated secure cycle parking facilities is proposed at all transit stations (100%) 1 Cycle Parking at Buildings Percentage of buildings that provide secure cycle parking. 1 N.A 0 Cycle Access in Buildings Buildings allow interior access for cycles and cycle storage within tenant-controlled spaces. 1 N.A 0 5 Cycle Score 3 Draft Site Layout Plan Report
. 10 N.")
165 Category Maximum Points Data Source Score Prioritized Connectivity Ratio of pedestrian intersections to motor vehicle intersections 5 All motor vehicular pathways are inclusive of pedestrian intersections 5 Small Blocks Length of longest block (long side). 10 N.A due to nature of township 0 15 Connect Score 5 Category Maximum Points Data Source COMPACT CONNECT Category SHIFT Total off-street area dedicated to parking as a percentage of the development area 10 0 Driveway Density Average number of driveways per 100 meters of block frontage 2 Average driveway density is less than 2 driveways per 100m of block frontage 2 Roadway Area Total road area used for motor vehicle travel and on-street parking as a percentage of total land area. 8 Motor vehicle area is less than 15% of the site area 8 20 Shift Score 10 0 Score Number of sides of the development adjoining existing built-up sites including include transport infrastructure, protected landscape, water bodies or other natural topography that inhibits development should be considered built-up. 10 The subject site is has water body such as canal at the western edge, EPE to the south and railway line to the east. 3 Transit Options Number of different transit options that are accessible within walking distance. 5 Various transit options have been proposed for the subject site 4 15 Compact Score 7 Score Cumulative area of all nonexempt off-street parking areas and driveways is equivalent to more than 35% of the site area. Data Source Urban Site BRONZE TOD STANDARD Off-Street Parking Maximum Points SILVER TOD STANDARD GOLD TOD STANDARD 85 Sustainability Compliance Scale 9-10 Draft Site Layout Plan Report 100

166 The total score for the subject township stands at 64 out of a total of 100, thus qualifying itself for bronze standard TOD, which signifies that the majority of the proposals for the township satisfy objectives of best practice for a Transit Oriented Development thus classifying the township as sustainable. 9.6 Detailed Final Site Layout Plan for Proposed IIT After the final decision on the preferred option for the Layout Plan, the team had worked on the illustrative detailed Layout plan as exhibited in Figure 9-8. It has adopted detailed building bye-laws and regulations (GNIDA) which is reflected in the Urban Development Framework Report. In the sub-sequent sections, the illustrative views of the township are showcased. The salient features of the development are summarized as follows: SALIENT FEATURES An integrated township where you can live-work and play in high quality designed lush green environment. Available public green spaces per person is 6 sq m A world-class CBD core accommodating Convention Centers, Business Center, Exhibition Pavilion, Star Hotels and ample Retail space in the heart of the township Strategic location Excellent connectivity. Located near Multi-modal hub (4km). Unique concept of vertical, stack-up industries (total floor space available c. 46 million square feet). A perfect destination for building eco-friendly signature structures for the business Well designed, high-quality landscaped spaces central Park, Neighbourhood Park, Canal side Promenade offering quality spaces for healthy lifestyle 9.2 Million sq ft of Commercial Space for development Live and work in serene, eco-friendly township away from noise and pollution. Work place at walking distance accessed through well designed and safe greenways. This chapter has provided detailed assessment of the preferred option on various platforms. Based on the adopted Final Layout Plan, a phasing strategy for the development is recommended in the forthcoming chapter. Disclaimer Note: The Detailed Layout Plan is just an indicative demonstration to showcase that the suggested Layout Plan for IIT is implementable. This has been worked out whilst calculating the ground coverage, building setbacks, proposed frontage and building orientation as per GNIDA regulations and norms. Figure 9-8: Proposed Final Detailed Site Layout Plan 9-11 Draft Site Layout Plan Report
167 Figure 9-9: illustrative view showing Central Park Figure 9-10: Illustrative view showing core Figure 9-11: Illustrative view showing entrance cluster 9-12 Draft Site Layout Plan Report
168 10. Phasing Strategy This chapter focuses on the recommended Phasing Strategy for the development of Integrated Industrial Township at Greater Noida. It is aimed at ensuring effective implementation and operation of the township which would further ensure fulfilling the envisioned objectives of the project Phasing Strategy The key driving factors for implementing the development proposals are the market demand for specific landuse category, Client s vision and ambition, available capital investment funds amongst many. IIT Greater Noida being the flagship project, the development of the township is very central and crucial in achieving the financial gains as well as meeting the prime objective of strengthening the regional economy. The Business Plan Report (which is submitted separately) states that, the project is developed considering very optimistic demand outlook, considering the planned initiatives of Metro Connectivity, BRT, Logistics Hub, Multi-modal hub etc. Therefore the Client would market this project at Indian and International forums with an Effective Marketing Strategy. An effective marketing strategy will ensure JV Management Company to be proactive in nature, which is crucial for successful development of the Zone and quick offtake of land. Further based on the perception analysis, GNIDA and DMICDC outlook and consultation undertaken for this assignment, the expected land off take by developers is ten years. (Source: CBRE Business Plan Report for IIT, Greater Noida) The project being developed as highly ambitious, which is reflected in the Business Plan Report as well as instructed through various discussions held with the SPV Client, it was recommended to complete the infrastructure and land development works at a single stretch. Considering the project area of ha and keeping in mind the high priority of the project, the site development strategy would be achievable in the envisaged span. It is suggested that the Client should be able to build the entire infrastructure (roads, utility corridor, power distribution network, SWM facilities, ICT etc.) including land development (streetscape, landscaping of public open spaces, greenways etc.) in 2 years time and keep the serviced plots ready for take-off purpose. This too is indicated in the Business Plan Report which refers to the year-on-year absorption for various landuse categories. Table 10-1: Forecasted YOY Absorption for Landuse Categories (in percentages) Component Industries R&D Industry Biotech Industry Hi - Tech Industry IT Industry Residential Commercial Utility Open Space Road Space Total Y-O-Y Absorption Total (%) The table indicates that in the first year of construction, the land absorption for infrastructure components would be 100%. Whilst there would be gradual and periodic absorption of saleable land in the remaining project planned period. Therefore in order to enable provide the serviced plots to the investors, this model would work beneficial for the client to complete the township infra in a fast paced manner. The investors then would require few years of time to build their set-up and make it operational. Therefore within the project plan period, the employment opportunities would be created for the catchment population, which would create housing demand. This demand would be met by the residential plots planned within the township. Once the township is functional and operative, it would lead to winwin situation for all. Subsequently, the Client would start realising the revenue in a gradual manner, this in turn would facilitate the boost in the regional economy. Therefore it is envisaged that in ten years horizon period, IIT Greater Noida would showcase itself as a fully built and operational Smart and sustainable integrated township - a major milestone towards achieving objective of overall DMIC project. Usually, the Phasing and sub-phasing for the development project is suggested to carry out the implementation and construction of infrastructure elements for a wider area depending on the scale of the project. However, considering aforementioned benefits and model for IIT Greater Noida, the infrastructure work will be carried out in a single stretch, and thus sub-phasing is not proposed Way Forward In this entire process, the Consultants have put forward all the relevant information and details for shaping up the Final Site Layout Plan. Based on this, the consultants have provided detailed Layout Plan, Final Landuse Distribution, Final Urban Design Framework and Landscape Strategy (in a separate report), Final Population and Employment Generation, Final Infrastructure Demand and Broad Cost Estimates, Phasing Strategy and Recommended Development Guidelines for the entire project in the Final Layout Plan Report. This completes the Final deliverable of Master Planning (or the 1st) stage of the Project. The Final Layout Plan which is laid out on the Sustainability foundation will enable the Client in showcasing their objective for the envisaged development Source: CBRE Business Plan Report 10-1
169 11. Preliminary Cost Estimate The first chapter entails the project background, project objectives, approach and broad methodology. It provides an overview of the project assignment 11.1 Approach to Costing This chapter deals with block cost estimate of all the physical infrastructure component for Integrated Industrial Township, Greater Noida Limited. Key considerations for this costing are out lined below: Costing is carried out based on the broad demand, technology and system elaborated in chapter 8 of master plan. Unit rates for costing are derived from DSR-2014, market rates and other DMICDC project Water Supply Infrastructure 11.8 ICT Infrastructure ICT infrastructure includes SCADA for Gas, distribution, Water & recycles water pumping stations, laying of 30km ICT duct etc. Cost of ICT infrastructure is Rs Cr Gas Infrastructure Gas infrastructure cost is arrived as Rs. 4.0 Cr Site Development and Land scaping This component includes land development with earth filling, land scaping, boundary wall and Administrative building A provision of Rs Cr. is kept for overall site development and land scaping work. Water supply infrastructure has been broadly divided into two sub components, viz: (1) Potable Water Supply (2) Recycle water supply. Table 11-1 Summary of Block Cost Estimate for all infrastructure works S.No Based on above cost of water supply infrastructure is Rs Cr. Component Total Cost (Rs. In Cr.) 1 Water Supply Infrastructure Sewerage Storm Water Drainage Solid Waste Management Road Power This component includes construction of storm water drain, development of existing pond and construction of Rain Water Harvesting Structures. Cost of Storm Water Drainage infrastructure is Rs Cr. 7 ICT Gas Solid Waste Infrastructure 9 Site Development & Land scaping Sub Total Provision for contingency(3 years), Operation & Maintenance (5 years), Design, quality control & Supervision 12 Total Cost 11.3 Sewerage Infrastructure This components includes only sewer collection system and integration with the existing sewerage system of GNIDA. Cost of Sewerage infrastructure is Rs Cr 11.4 Storm Water Drainage Infrastructure This component includes Automated Waste collection system, Transfer station, Biomethanation plant etc.. Cost of Solid Waste Management infrastructure is Rs Cr , say Road Infrastructure Road infrastructure includes development of four type of roads. Those are 80m wide ROW, 60m wide ROW, 45m wide ROW and 30m wide ROW. Cost of Road infrastructure is Rs Cr Power Infrastructure Power infrastructure includes permanent electrical system (construction of 220/33 kv GIS substation), construction power system, substation automation system and solar system Cost of Power infrastructure is Rs Cr. Final Detailed Site Master Plan Report 11-1
170 Table 11-2: Water Supply Infrastructure Cost S.No 1* Table 11-4: Storm Water Drainage Infrastructure Cost Description Qty Unit Rate (Rs in Lakh) Cost (Rs in Lakh) S.No Description Qty External Works 1 Storm Water Drains 26 Recycle Water 2 Pond Development Lot a Pumping Station house near 72 MLD STP (Civil Works) 14 MLD d Transmission main from 72 MLD STP to Recycle Water Reservoir 3.2 KM Unit KM Rate (Rs in Lakh) Cost (Rs in Lakh) Total cost Table 11-5: Solid Waste Management Infrastructure Cost 2 Internal Works 2.A a S.No Clear Water Reservoir and pumping station c Elevated Service Reservoir g Potable water distribution Network h Qty Unit Potable Water Clear Water rising main from Tapping point to CWR b Description Bore well work 2.0 KM MLD ML KM Rate (Rs in Lakh) 1 Automated Waste Collection System 8.7 km Collection bins 150 Nos Vehicles 9 Nos Biomethanation plant 1 No Intermediate transfer station 2 Nos Lot Total cost 2.B Recycle Water a Recycle Water rising main from Tapping point to RWR 1.0 KM b Recycle Water Reservoir and pumping Station 14 MLD e Recycle Water Distribution Network 2.C 2.E Electromagnetic Bulk Flow meters Automation/Scada, chlorination Cost (Rs in Lakh) KM Table 11-6: Road Infrastructure Cost S.No Description Qty Unit Rate (Rs in Lakh) Cost (Rs in Lakh) 1 80m ROW 0.92 km m ROW 9.16 km m ROW 4.25 km m ROW 1.2 Km New Bridge 1 Nos Widening of existing bridge 1 Nos RCC Box culvert 16 Nos Lot Lot Total cost (External + Internal) Table 11-3: Sewerage Infrastructure Cost S.No 1 Description Sewer collection Network Qty 16 Unit KM Rate (Rs in Lakh) Cost (Rs in Lakh) Total cost Final Detailed Site Master Plan Report 11-2
171 Table 11-7: Power Infrastructure Cost S.No Description S.No Cost (Rs in Lakh) 1 Design & SITC (Supply, Installation, Testing & Commissioning) of Addition of 2 nos. bay in each source sub-stations 2 Design & SITC including all civil works of 220kV Double Circuit Transmission Line upto IIT Plot Boundary & Transmission line to cable conversion Design & SITC of 220 kv GIS a 220 kv GIS b 12 Description Cost (Rs in Lakh) Design & SITC of Power Transformers nos. of 33/11kV, 25MVA Design & SITC of SAS (Substation Automation System) Smart control, metering, communication & Advanced metering infrastructure Design & SITC of 33 & 11 kv cables & terminations Design & SITC of Earthing system for HT switchgears, RMUs & CSS Civil Cost for 220kV Electrical substation Design & SITC of Cable trays including earthing of cable tray Design & SITC of 33KV(E), 1C X 630 sq.mm Cables and terminations SITC of safety items Design & SITC of 220kV Underground cable inside plot boundary 2746 COST BORNE BY DISTRIBUTION LICENSEE- SUBTOTAL (B) Design & SITC of Power Transformers 18 Design & SITC of 3 nos. of CSS (Compact Substation) including smart meter nos. of 220/33kV, 100/125MVA Design & SITC of Smart street lighting system Design & SITC of Distribution & Lighting Transformers for 220kV S/s Design & Construction of Cable Trench for entire IIT plot Design & SITC of SAS (Substation Automation System) a SAS (Substation Automation System) for 220kV GIS substation 9 Survey & supervision charges on switchyard & transmission line COST BORNE BY SPV- SUBTOTAL (C) Total Cost (A+B+C) EPC Cost for Proposed 1.0MW Canal Top Solar System (D) 900 COST BORNE BY SPV/STATE ELECTRICITY BOARD (UPPTCL)- SUBTOTAL (A) Cost of Construction / Immediate Power Arrangement (E) Design & SITC of HT Switchgears & RMUs GRAND TOTAL (A+B+C+D+E) a 33kV Centralized switchgear b 11kV Centralized switchgear c 39 nos. of 33kV RMU d 19 nos. of 11kV RMU e Civil cost for all RMU substations building f SITC of misc Electrical works at RMU substations building g Battery, Battery charger & DCDB for RMU substations building h Providing smart meter at each plot 6.22 Table 11-8: Site Development and Land Scaping Cost S.No Description Qty Unit Rate (Rs in Lakh) Cost (Rs in Lakh) 1 Compound Wall 16 Km Administrative Building 1000 Sqm Land development and Horticulture 47 Ha Total Cost Final Detailed Site Master Plan Report 11-3
172 Table 11-9: ICT Infrastructure S.No Description Qty Rate (Rs in Lakh) Unit Cost (Rs in Lakh) 1 ICT Duct and fibre cable 1 Lot Gas monitoring 1 Lot Command and control centre 1 No Video Surveillance System 1 Lot Wifi 1 Lot Traffic Management system 1 Lot Total Final Detailed Site Master Plan Report 11-4


173 Appendix A - Village Integration Strategy The Project area of the IIT is characterised with two important settlements Ajayabpur, which falls within the project boundary and Rithori, which adjoins the site on the eastern periphery along the railway track. During the formulation of the Site Layout Plan, the Consultants have aimed at integrating carefully these settlements into the main plan, in such a way that their basic rights are not only maintained and restored, but they are improved. These settlements will be provided with the basic infrastructure facilities. The envisaged development of the IIT will benefit the residents of these villages as it would open up several employment opportunities to them. Thus the plan provision equips and integrates the village settlements physically, socially and economically. A.1 Ajayabpur The expansion area of the village includes plotted development for the village by GNIDA. The planned development includes roads - maintaining its connectivity with the immediate Abadi as well as to the remaining project area. The proposed road is partially constructed and the access for the residents of Ajayabpur is through kutcha roads. The existing 45m road is retained in the proposed Site Layout Plan Options to continue the accessibility of Ajayabpur with the rest of the Sector area and the IIT. The development consists of approximately 50 nos of modular plots with varying size. These are typically meant for residential use and are provided with the facility of Community Hall/ All Purpose Hall that would be utilised by the village residents. During the Site Layout Plan formulation, a conscious effort has been done for not allocating industrial zoning surrounding the immediate periphery. Instead green open spaces and commercial activities are planned around it. Ajayabpur settlement falls within the project boundary; however, the settlement area is excluded from the project planning area. Currently, the settlement primarily comprises of residential buildings, mostly pakka structures, vegetation and has access through the site. Although the actual settlement area (Abadi area) is much smaller, the area reserved for its expansion including buffer totals to ha. This expansion area includes the 20m wide buffer allocated by GNIDA around the settlement. Ajayabpur Rithori Figure A-2: Ajayabpur and Proposed Surrounding Zoning Figure A-1: Ajayabpur and Proposed Surrounding Zoning The proposed abutting zoning will specifically cater to the village population. i
 of the project area and then connects to the other part of Greater")
174 A.2 Rithori The Rithori village abuts the project area on the south-west periphery along the railway line. The main access to the settlement is currently through the site. In addition to this, a village road runs parallel to the railway line which adjoins the sourthern periphery (outside the boundary) of the project area and then connects to the other part of Greater Noida Sector area. The settlement has comparatively more number of pukka structures than Ajayabpur along with amenities and religious structures. Similar to Ajayabpur, Rithori also has a 60m wide green belt planned around it as well as equipped with proposed plotted development by GNIDA. As per GNIDA s proposal for Rithori, there are several residential plots having access through 12-18m roads. There are plots reserved for community purpose use and few green pockets. In order to give access to the village, a 45m wide peripheral road is planned along the edge of the project boundary abutting the site. Other than the 45m wide peripheral road, there are planned green open spaces in the immediate vicinity of the village which will primarily cater to its population. RITHORI ii
175 Appendix B: Social Infrastructure For any urban centre, the quality of life is greatly related on the availability and accessibility to quality social infrastructure. These broadly include the following: A) Education facilities. B) Healthcare facilities. C) Socio-cultural facilities. D) Open Spaces. E) Safety and Security/Public facilities Police station, Petrol station, Fire station, Postal facilities. F) Sports facilities. G) Retail facilities inclusive of banking facilities. H) Urban Street Vendors. Below Listed are Standards as stated in the Urban and Regional Development Plans Formulation and Implement (UDPFI) Volume 1, Draft Report Version 1, 2014 Guidelines Document: Table - Standard Social Infrastructure requirements in an urban context Sl. no 1 Population served per unit Education facilities, Table 8.24, pg 294 Category Integrated school without hostel facility, ranging from class I to XII. 90,000 to 1 lakh Land area requirement Area per school = 3.50 Ha. Healthcare facilities, Table 8.26, pg 297 Dispensary 2 3 Nursing Home, child welfare and maternity centre with 25 to 30 beds Intermediate hospital of category A with 200 beds 15,000 45,000 to 1 lakh 1 lakh Multi-Speciality Hospital with 1 lakh 200 beds Socio-Cultural facilities, Table 8.27, pg 298 Recreational Centre or Club 1 lakh Sl. no 5 Facilities to be provided in the township as per UDPFI guidelines For resident population (less than 40% of total population),1 school to be accommodated (this can be accommodated within commercial and mixed use landuse category, as currently, there is no provision of separate landuse category of public and semi-public ) 8 to 0.12 Ha For total population of 1.8 lakh 12 dispensary units accommodated in the proposal 0.20 to 0.30 Ha Already present in site vicinity 3.70 Ha Already present in site vicinity 9.00 Ha Already present in site vicinity 10,000 sqm For total population of 1.8 lakh 1 centre accommodated in the core 6 5, Ha 4 Neighbourhood park 15, Ha Various cluster level green spaces in industrial and residential clusters accommodated in the proposal Comprises of neighbourhood parks (2), linear park, active linear green spaces and greenways accommodated in the proposal Sports facilities, Table 8.32, pg 301 Neighbourhood play area 15, Ha District Sports Centre 8.00 Ha 1 lakh Retail facilities, Table 8.37, pg 305 Convenience shopping 5,000 Open spaces, Table 8.29, pg 300 Housing area park Population Land area served per requirement unit Safety and Security/Public facilities, Table 8.34, pg 303 Police station 90, Ha (Area inclusive of residential accommodation Police Post 40,000 to 0.16 Ha (Area 50,000 inclusive of (area not residential served by accommodation) police station) Sub fire station/fire Post Within 3-4 km 0.6 Ha (with radius residential) Fire Station 2 lakh within 1 Ha. (with 5-7 km radius residential) Postal facilities 15, sq m Table 8.43, pg 313 Post office counter without delivery Head Post Office with 2.5 lakh 750 sq m delivery office Category 1,500 sq m Local shopping including service centres 15,000 4,600 sq m Community Centre including service centres 1 lakh 5 Ha Banking facilities Table 8.43, pg 313. Bank with extension counters with ATM facility Bank with locker, ATM and other banking facilities 15, sq m 1 lakh 2500 sqm Facilities to be provided in the township as per UDPFI guidelines For total population of 1.8 lakh, police station is not proposed within site For total population of 1.8 lakh 2 police posts to be accommodated (instead of police station) For total population of 1.8 lakh, One Fire post to be accommodated Not necessary to be proposed within the site For resident population (less than 40% of total population), 3 postal facilities to be accommodated in each sector For a total population of 1.8 lakh, 1 head post office to be accommodated (this is subjective to provision of specific land use approval) Already accounted for in the green spaces For total population of 1.8 lakh 1 centre to be accommodated in the core For total population of 1.8 lakh dispersed centres accommodated within commercial/ mixed use land use For total population of 1.8 lakh dispersed centres accommodated within commercial/ mixed use land use. For total population of 1.8 lakh - 1 centre accommodated within the core. For resident population (less than 40% of total population), 3 banks to be accommodated within the site For total population of 1.8 lakh 1 bank to be accommodated within core Note: All figures considered with respect to total population of 1.8 lakh. Resident Population = less than 40% of total population. iii
.")
176 Urban Street vendors It is observed that the informal eating places mushroom at a faster rate. It is suggested to make provision for 1 informal eating place per 1 lakh population with a space allocation of 2000 sq m (NBC 2005 part 3). The norms for Informal Units for Urban Street Vendors is as given in Table 8.40, pg 308. Land Use Category Retail facilities Below listed are the social infrastructures present around the site with their relative distances from the township (Refer Figure 1). Table-1 - Existing Social Infrastructure around the site Amenity/Facility type Distance from the site South-west 2 to 2.5 km South-west 2.5 to 3 km North-east 5 to 5.5 km North-east 7 to 7.5 km North-east 7.5 to 8 km East (adjacent to the site) Less than 0.5 km South-west 2 to 2.5 km South 5 to 5.5 km North-east 7.5 to 8 km B Block park 3 to 4 km F Block park 3 to 4 km South West 7 to 8 km South West 4.5 to 5 km Bharat Petroleum Petrol Station Postal facilities North East 4 km Kol, Uttar Pradesh North West 4 to 4.5 km Dadri Post Office North West 9 km Schools Colleges Distance from the site 4 to 4.5 km Kasna, Uttar Pradesh South West 6 km Accher, Uttar Pradesh West 5km Source: Compiled from Google Earth search Location from the site Education facilities Location from the site South Banking facilities B.1 - Social Infrastructure Present around the Site: Land Use Category Amenity/Facility type Shopping centre/local shopping centre The figure below shows the social infrastructure present around the site, with the site marked in red. This information was sourced out by the consultants as an additional exercise for the self study of the site surroundings. Healthcare facilities Hospital Open Spaces Multiple parks of varying scales around the site. Part of Greater Noida Community. Police Station Kasna Police station in Greater Noida Safety and Security/ Public facilities Petrol/Diesel Filling Station CNG Filling Station Greater Noida Figure 1: Existing Social infrastructure around the site. Source: Google Earth iv
177 GNIDA Use Premises B.2 List of Facilities Proposed in the Integrated Industrial Township: Social Infrastructure Provision as per GNIDA standards GNIDA Use Premises a Education 1 Creche and Day Care Centre 2 3 Nursery School Senior Secondary School GNIDA Service Population Per Unit GNIDA Minimum service population GNIDA Unit Area in Ha Area required for IIT* in Ha Health 1 Dispensary 2 Nursing Home c Shopping Total b Provision in IIT plots Total Area in Ha Part of office use area (45.05) Permitted in all commercial plots if the plot is not reserved for hotel, convention centre and galleries Permitted in all commercial plots if the plot is not reserved for hotel, convention centre and galleries Part of office use area (45.05) Refer Final UDF Report, pg.30 and Chapter 7 Part of the commer cial plot area Refer Social Infrastructure Note, pg.12 Part of office use area (45.05) Refer Final UDF Report, pg.30 and Chapter 7 GNIDA Unit Area in Ha 0.2 Area required for IIT* in Ha 1.36 Convenient Shopping Centres 2 Sector Shopping cum Service Centre Community Centre Milk and Vegetable Booth Reference Permitted in all commercial plots if the plot is not reserved for hotel, convention centre and galleries and preferably near residential areas. Permitted in all commercial plots if the plot are not reserved for hotel, convention centre and galleries and preferably near residential areas. Permitted in both the Residential Group Housing Plots in the southern area of township, i.e. south of Kot Escape. All are accommodated in the Commercial/ Mixed use landuse of the IIT GNIDA Minimum service population The table below validates the provision of social infrastructure on the site with respect to GNIDA standards. The table shows in detail the total area requirement as per the GNIDA norms and the corresponding type of provisions that has been made in IIT. Table-2 - Social Infrastructure Requirement as per GNIDA and the Provisions within IIT, GN GNIDA Service Population Per Unit Refer Final UDF Report, pg.30 and Chapter Total d Recreation 1 Tot lot Park Play Ground Provision in IIT plots Permitted in all commercial plots if the plot is not reserved for hotel, convention centre and galleries Permitted in all commercial plots if the plot is not reserved for hotel, convention centre and galleries Permitted in all commercial plots if the plot is not reserved for hotel, convention centre and galleries Permitted in all commercial plots if the plot is not reserved for hotel, convention centre and galleries All are accommodated in the Commercial/ Mixed use landuse of the IIT Children's Play Area - Part of Neighbourhood Park and Central Park, Active Linear Green, Linear Park. Linear Park, Neighbourhood Park & Central Park Part of Neighbourhood Park & Central Park Total Area in Ha 6.25 Reference Refer Final UDF Report, pg.30 Refer Final UDF Report, pg.30 Variable - as required Refer Final UDF Report, pg.30 Part of Retail use area of 6.25 Refer Table 2 Refer Final UDF Report, pg Refer Table 2 Refer Final UDF Report, pg Refer Table 2 Refer Final UDF Report, pg *Notes: 1. Area required in IIT = Total residential population * GNIDA Unit Area for Use Premises / GNIDA Maximum Service Population for Use Premises 2. Total Population considered is residential population for the township 3. Total Area per each unit of Creche & Day Care Centre, Nursery School, and Dispensary is variable as required as per sector population. v
178 4. Table-3: Type of Parks available within Township Type of Parks Provision of Area in IIT in Ha Central Park Neighbourhood Park Linear Park Active Linear Green Total Active Green Socio-cultural/Sports facilities: Hospitals*: A hospital is present on the edge of the site, along with other facilities in the vicinity. Therefore, no major hospital facilities are provided in the design proposal, which otherwise would have led to duplication of services. However, provision for Dispensaries and Nursing Home is made in the design in commercial plot guidelines, for handling immediate emergencies, until they are transferred to larger medical facilities in the site vicinity. Fire Services*: There is a provision for fire hydrants planned alongwith the Utility Corridor. There will be separate provision for water supply meeting the fire-fighting demand. The details are dealt under Utilities design (Technical Assessment Report and Design Basis Report). *All such proposals are subjective to individual land use allocation & approval from the Client. Community centres/entertainment facilities are proposed at multiple locations in the site within commercial plots (refer to Amenities and Facilities, Ch 3.4, Final Urban Design Framework report, pg 30-31). There are no similar facilities in the vicinity. Hence, provision in the site will lead to successful usage of the facility by people who are part of the township. It is proposed as part of the leisure and entertainment facilities. Open Spaces: Primary open space, Secondary open space, greenways and cluster level open spaces provided are planned with respect to 8 sq m per person, which serve respective industrial and residential population (refer to Public Realm Strategy, Ch 4, Final Urban Design Framework report, pg 40-46). Public utilities: Police Post*: Police posts will be accommodated within additional uses. This is excluding the area occupied by a standard police station. These posts will act as an initial checkpoint for handling emergency situations, until it can be transferred to larger facilities in the site vicinity. Postal facilities: A post office counter without delivery (within commercial land use) and an independent Head post office* will be accommodated within the township. Urban Street Vendors / Hawkers Area: Informal street vendors play an equally important role as do formal retail spaces, as they bring in vibrancy to an area. In order to add character to public spaces, provision is made in the design within the ROWs (refer to Table , pg 87, Urban Design Framework Report). List of facilities not proposed in the Integrated Industrial Township: Colleges*: Junior and Senior Colleges are not proposed in the design, due to close proximity of existing education facilities in the vicinity. Also, keeping in mind the increase in population, provision of 2 schools are made. vi
179 Annexure I: Cul-de-Sac Profile 1 vii
180 Annexure II: Cul-de-Sac Profile 2 viii

181 Annexure III Correspondence between Power Distributor and GNIDA ix


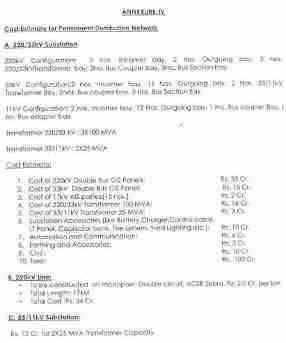
182 Annexure III Correspondence between Power Distributor and GNIDA x (contd.)
183 Annexure IV S.No Category Water Demand Calculation Area (Ha) Total Population Unit Water Demand Unit Group Housing (HIG,MIG,LIG) Residential housing for EWS 1.3 Provision for villages Flushing Water Demand (MLD) Waste Water Generation (MLD) LPCD Transient Population 9450 LPCD LPCD LPCD Industrial landuse Work force (Domestic use) Non domestic demand Landscaping irrigation 4.1 Landscaping Irrigation including road side plantation Fire fighting requirement L/ha/day L/ha/day L/Ha/day QKLD=100*(P1000) Total Gross Total at project level including 5% Losses Gross Total at source including 5% additional demand 1/ Notes: 1 Breakup of unit water demand are as follows: 2 For Residential population :150 LPCD = 105 LPCD Potable Water + 45 LPCD Non-Potable Water 3 Industrial-Domestic: 45 KL/ha. 30% taken as potable and 70% considered as non-potable 4 Industrial-non domestic : 20KL/ha is considered based on Pitampura DMICDC project 5 Landscaping irrigation : 67KL/ha is considered from DSIIDC 6 Commercial population : 500 PPH with weightage 0.2 as per GNIDA DPR 4.99 Commercial land use 4 5 Potable Water Demand (MLD) Residential land use Unit Water Demand Total Water Demand (MLD) xi 15.64
184 Annexure V Maps & Drawings Sr. No. Drawing No. 1 TCE.7504A-292-MP-6300 Final Site Layout Plan for 2 TCE.7504A-292-MP-6301 Detailed Site Layout Plan for 3 TCE.7504A-292-LU-6300 Final Building Height Plan for 4 TCE.7504A-292-LU-6301 Final FAR Plan for 5 TCE.7504A-292-TP-6300 Final Road Cross-Sections for 6 TCE.7504A-292-TP-6301 Final Road Hierarchy for 8 TCE.7504A-150-WS Layout Plan Layout Plan for Potable Water of Water Supply Distribution Network 9 TCE.7504A-150-WS Layout Plan for Recycled Water Network 10 TCE.7504A-151-SW Layout Plan for Sewerage System 11 TCE.7504A-152-SD Storm Water Catchment Area 12 TCE.7504A-152-SD Layout Plan Storm Water Drainage Network 13 TCE.7504A-153-TP-6000 Typical Utility Road Cross Section of 80 m ROW 14 TCE.7504A-153-TP-6001 Typical Utility Road Cross Section of 60 m ROW 15 TCE.7504A-153-TP-6002 Typical Utility Road Cross Section of 45 m ROW 16 TCE.7504A-153-TP-6003 Typical Utility Road Cross Section of 30 m ROW 17 TCE.7504A-110-TS-6000 Topographical Survey Drawing Name xii
185 List of References Reports/ Articles Standards/ Norms/ Guidelines a. GNIDA Building Regulations, 2010 a. Pre-Feasbility Study on Integrated Industrial Township at Greater Noida, Dadri Noida Ghaziabad Investment Region, Halcrow, Knight Frank and Synovate, July 2013 b. UDPFI Guidelines b. GNIDA Master Plan 2021, Greater Noida Industrial Development Authority c. c. d. Urban Development guidelines by Ministry of Urban Development (MOUD) Final GNIDA Master Plan 2031, Greater Noida Industrial Development Authority Indian Roads Congress d. Draft Revised Regional Plan 2021, National Capital Region, July 2013, NCR Planning Board e. Transit Oriented Development by Institute for Transportation and Development Policy (ITDP) e. NOIDA Master Plan Report 2031 f. f. g. Charter for Sustainable Urbanism, Freiburg g. h. i. j. k. l. m. n. o. Tiwari, G. Urban Passenger Transport: Framework for an Optimal Modal Mix. INRM Policy Brief No.1, ADB Transportation Research and Injury Prevention Programme (TRIPP). Bus Rapid Transit Guidelines. IIT Delhi Institute for Transportation & Development Policy. Bus Rapid Transit Planning Guide. New York USA Transit Cooperative Research Program Report 108 on Carsharing: Where and How it Succeed. Cooper, G.Howes, D. Mye, P. The Missing Link: An Evaluation of CarSharing. Oregon Department of Environmental Quality. Portland, OR, USA Woodcock, J., Tainio, M., Cheshire, J., O'Brien, O. & Goodman, A. Health Effects of the London Bicycle Sharing System: Health Impact Modeling Study. January, Swamy, H., S. Sinha, N. Bhakuni, and S. Imchen. Integrated spatial development: Summary report Ahmedabad. Technical Report, Centre of Excellence in Urban Transport, CEPT University, Ahmedabad, India Ministry of Urban Development of India. Study on Traffic and Transportation Policies and Strategies in Urban Areas in India. May, Institute for Transportation Engineers. Designing Walkable Urban Thoroughfares: A Context Sensitive Approach. ITE. Washington DC Tiwari, Geetam Urban Passenger Transport: Framework for an Optimal Modal Mix. New Delhi: Asian Development Bank. Sustainable Region Initiative, Vancouver h. Sustainability Principles of Spanish Urban Planning i. Sustainable parameters for Low Carbon cities, Malaysia j. Eco-Low Carbon Urban Planning Methodology by FCO Prosperity Fund, China s Ministry of Housing and Urban Rural Development (MOHURD) and Atkins. Websites (for graphics/ articles/ benchmarks) a. b. c. inhabitat.com d. e. p. China, ITDP October. f. q. NTDPC India Transport Report. Policy Document, New Delhi: Government of India. g. r. ITDP November. s. Chennai, ITDP h. i. j. u. FTA Car-Sharing: Where and How it Succeeds. TCRP Report 108, Washington, D.C.: Transportation Research Board. k. v. l. t. CDAC January. Cooper, Howe, Mye The Missing Link: An Evaluation of Car Sharing. Research Paper, Portland: Master of Urban and Regional Planning Workshop Projects. m. n. xiii
186 o. p. malaysiawaterfront.blogspot.com q. th r. Accessed on:16 June 2014 s. Accessed on: 16th June 2014 t. Accessed on: 15th June 2014 u. v. w. x. y. z. xiv
187 EIA of DMIC Integrated Industrial Township Greater Noida [DMIC IITGNL] Annexure- III Khasra Details and Lease Plan


188
189 EIA of DMIC Integrated Industrial Township Greater Noida [DMIC IITGNL] Annexure- IV Principal Water Allocation Letter
190

191 Water Allocation
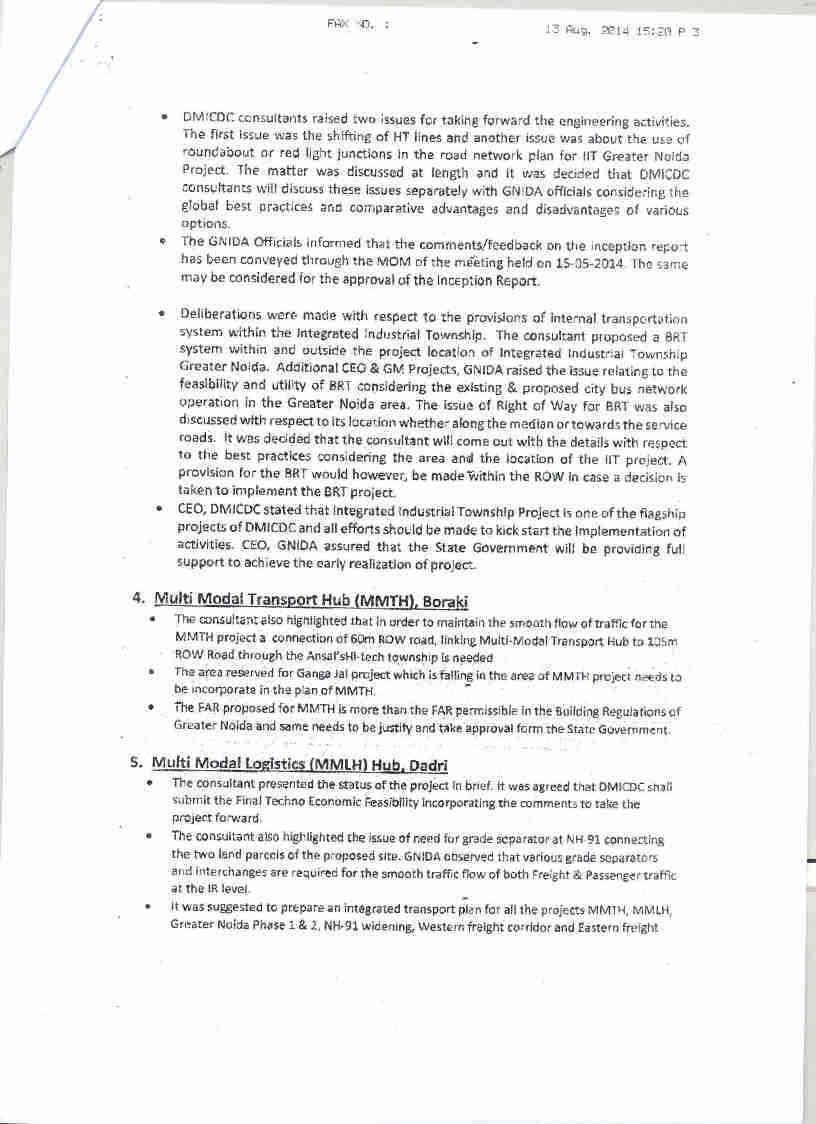
192
193
194
195 EIA of DMIC Integrated Industrial Township Greater Noida [DMIC IITGNL] Annexure- V Authorization Power Allocation Letter
196
197
198
199
200
201

202
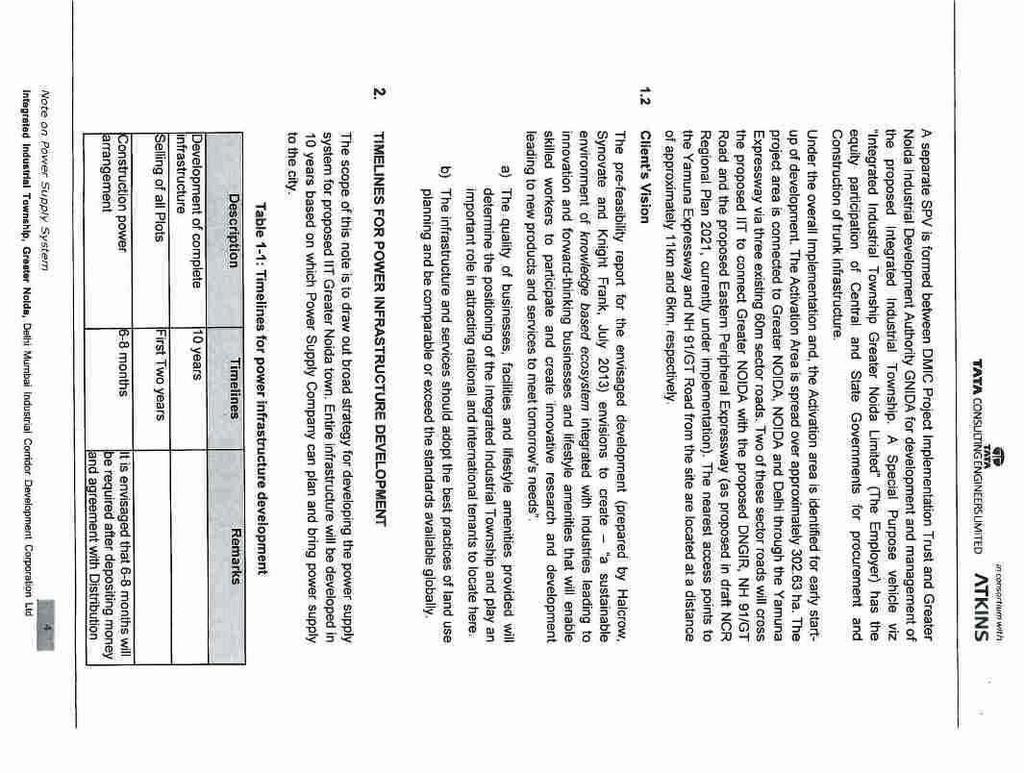
203
204
205
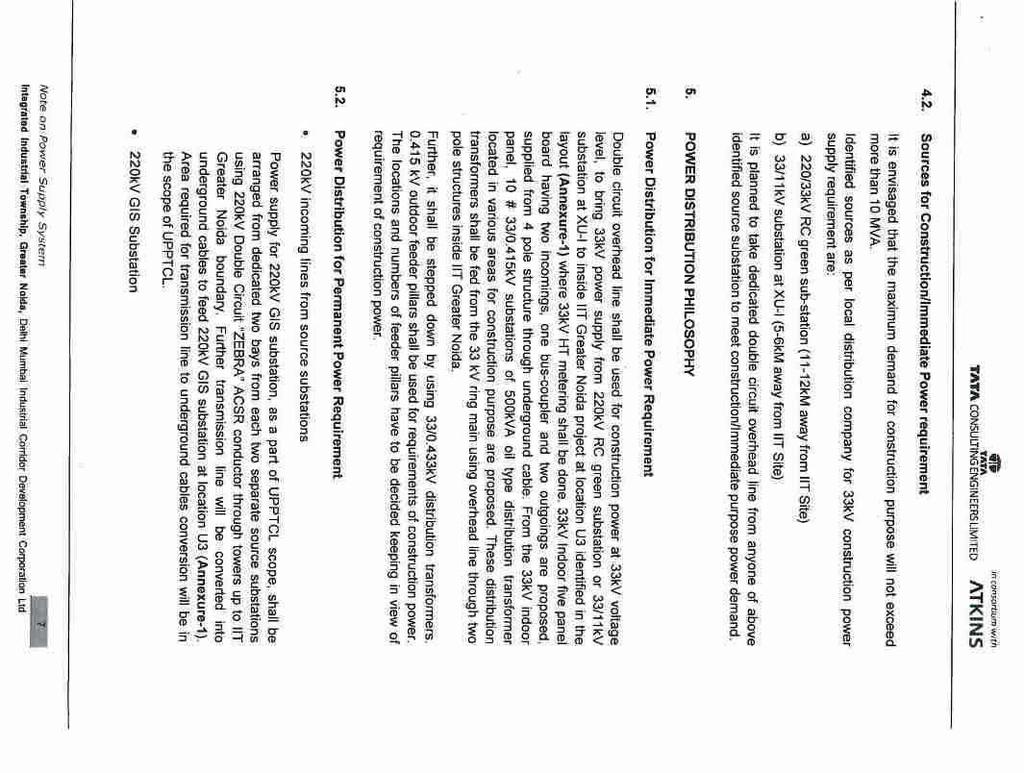
206

207

208
209

210
211

212
213
214
215
216
217
218
219 EIA of DMIC Integrated Industrial Township Greater Noida [DMIC IITGNL] Annexure- VI Environmental Monitoring Report and Data Collection Programme

.")


, Mumbai-400083 environmental monitoring will be required for both the construction and operational phases.")

220 ENVIRONMENTAL MONITORING REPORT OF AIR, GROUND WATER, SURFACE WATER, SOIL AND NOISE FOR IIT GN PROJECT NEAR AJAYABPUR, GREATER NOIDA Submitted to: INTRODUCTION The Environmental Monitoring was carried out by the Environment Team of M/s ITL Labs Pvt. Ltd. For the project of PITAMPUR DHAR-MHOW AREA FOR INDUSTRIAL DEVELOPMENT FOR DMIDC For SGS INDIA PVT. LTD., 9/F, INFINITY TOWER C,DLF CYBER CITY, DLF PHASE-II, GURGAON (HARYANA). The present work is concerning the existing Environmental condition with respect to Ambient Air, Ambient Noise, Ground Water, Surface Water, Soil and Meteorology. Tata Consulting Engineers Limited Environmental Monitoring programme is a vital process of any management plan of the th Tower A, 247 Park, 4 Floor, LBS Marg, Operational & Development. This helps in signalling the potential problems that result in from the projectvikhroli and will allow for prompt implementation of effective corrective measures. The (West), Mumbai environmental monitoring will be required for both the construction and operational phases. The main objectives of Environmental Monitoring are: Assess the changes in Environmental Conditions; Monitor the effective implementation of mitigation measures; Warn significant deteriorations in Environmental quality for further prevention action. In order to meet the above objectives the following parameters need to be monitored: Ambient Air Soil Quality Water Quality (Surface Water & Ground Water) Meteorological Data [Year] Submitted by:- Environmental Baseline Monitoring Report at BPCL, Hissar, Haryana for SGS INDIA PVT LTD Fehler! Kein Text mit angegebener Formatvorlage im Dokument. 0 ITL LABS PVT. LTD.; B-283,284; Mangolpuri Industrial Area; Phase I; New Delhi-83
221 Environmental Monitoring Report at IIT GN project near Ajayabpur, Greater Noida Contents S. NO. PARTICULARS PAGE NO. 1 SCOPE OF WORK 2 2 INSTRUMENT AND APPARATUS 3 TESTING METHOD 5 4 ABBREVIATIONS 6 5 AMBIENT AIR QUALITY LOCATIONS AND RESULTS AMBIENT NOISE QUALITY LOCATIONS AND RESULTS METEOROLOGICAL LOCATION AND REPORT GROUND WATER RESULTS AND LOCATIONS SURFACE WATER RESULTS AND LOCATIONS SOIL RESULTS AND LOCATIONS PHOTOGRAPHS LIST OF APPENDIX ATTACHED S. NO. APPENDIX NO. PARTICULARS 01 APPENDIX A TEST REPORT - AMBIENT AIR QUALITY MONITORING 02 APPENDIX B TEST REPORT - AMBIENT NOISE MONITORING 03 APPENDIX C TEST REPORT METEOROLOGICAL SURVEY 04 APPENDIX D TEST REPORT - GROUND WATER 05 APPENDIX E TEST REPORT - SURFACE WATER 06 APPENDIX F TEST REPORT SOIL Report Prepared by: ITL LABS PVT LTD, New Delhi 1
222 Environmental Monitoring Report at IIT GN project near Ajayabpur, Greater Noida SCOPE OF WORK The Scope for performing the Environment survey is as follows for IIT GN project near Ajayabpur, Greater Noida: 1. Mo itori g of A ie t Air Qualit for the para eters, a el Sulphur dio ide SO O ides of Nitroge <.5 NOX, Particulate Matter < 10 micron sized parti le PM i ro sized parti le, Parti ulate atter PM.5, Carbon Mono-oxide (CO) and Hydrocarbons at all the predefined 5 locations will be carried out for three months. 2. Collection and Analysis of the Surface Water Samples at 04 different locations and Ground Water samples at 04 different locations each within the project stretch and surrounding areas of the project site (10 km radius). 3. Collection and Analysis of 3 soil samples from different locations within the project site. (10 km radius). 4. Monitoring of Ambient Noise Level at 7 different locations within the project stretch and surrounding areas of the project site. 5. Meteorological Data (Three Months) at 1 Location at Project Site. Report Prepared by: ITL LABS PVT LTD, New Delhi 2
223 Environmental Monitoring Report at IIT GN project near Ajayabpur, Greater Noida INSTRUMENTS & APPARATUS Report Prepared by: ITL LABS PVT LTD, New Delhi 3
224 Environmental Monitoring Report at IIT GN project near Ajayabpur, Greater Noida INSTRUMENTS & APPARATUS Air Monitoring Instruments (PM 10) Instrument Make Model No. Range and Sensitivity SPM/RSPM Respirable Dust Sampler (RDS) M/s. Spectro Instruments Pvt. Ltd. New Delhi SLE -RDS 103/SLE -GA 133 GASES m3/min ±2 m3/min LPM ± 2 LPM Filter Paper Details APPRATUS Filter Paper MAKE SIZE M/S Whatmann International Ltd. SIZE PRODUCT CATEGORY NO x 25.4cm EPM 2000 Air Monitoring Instruments (PM 2.5) Instrument Make Model No. Range and Sensitivity PM Fine Partipculate Sampler(PM2.5) M/s. Spectro Instruments Pvt. Ltd. New Delhi SLE-FPS LPM Filter Paper Details APPRATUS MAKE SIZE SIZE PRODUCT CATEGORY NO. PTFE Filter Paper M/S Whatmann International Ltd. 47 mm GF/A Noise (Sound) Measuring Instrument INSTRUMENT MAKE MODEL NO. DETECTION LIMIT Integrated Sound Level Measurement Instrument Standard Accessories Envirotech SLM dB Report Prepared by: ITL LABS PVT LTD, New Delhi 4
225 Environmental Monitoring Report at IIT GN project near Ajayabpur, Greater Noida Testing Methods Followed S.No. Particular 1 Testing Method to be Followed AMBIENT AIR MONITORING PARAMETER A B Particulate Matter, < 10 micron sized IS-5182 (part 23) 2006 particle (PM10) Gravimetric Method Particulate Matter, < 2.5 micron sized EPA- Guideline particle (PM2.5) C D IS 5182 (Part II) 1969, with Improved West & SO2 (Sulfur Dioxide) Gaeke Method NO2 (Nitrogen Dioxide) E IS 5182 (Part-VI) Modified Jacobs Hochheiser Method / Arsenite Method THC 2 Gas Chromatography NOISE LEVEL MEASUREMENT Operational Manual of Noise level Meter, Model Noise Level in db (A) for continuous 24 hours 3 No. SLM 100 issued by Envirotech and IS 9899:1981 WATER ANALYSIS Standard Method for the Examination of Water & Wastewater 2012, 22 nd Edition, by Eugene W. Rice, Rodger B. Baird, Andrew D. Eaton, Lenore S. Clesceri is follow for analysis also according to various parts of IS: SOIL ANALYSIS Methods Manual- Soil Testing in India, Department of Agriculture & Cooperation, Ministry of Agriculture, GoI, 2011 and various parts of IS:2720 & FAO. Report Prepared by: ITL LABS PVT LTD, New Delhi 5
226 Environmental Monitoring Report at IIT GN project near Ajayabpur, Greater Noida Abbreviations PM2.5 = particulate Matter (< 2.5 micron sized particle) PM10 = Particulate Matter (< 10 micron sized particle) SO2 = Sulphur Dioxide NO2 = Nitrogen Dioxide AAQ = Ambient Air Quality GW = Ground Water THC = Total Hydrocarbon SW = Surface Water GL = Ground Level N = Noise S = Soil Report Prepared by: ITL LABS PVT LTD, New Delhi 6
227 Environmental Monitoring Report at IIT GN project near Ajayabpur, Greater Noida AMBIENT AIR QUALITY LOCATIONS AND RESULTS Report Prepared by: ITL LABS PVT LTD, New Delhi 7

228 Environmental Monitoring Report at IIT GN project near Ajayabpur, Greater Noida AMBIENT AIR QUALITY LOCATION Coordinates Sl.No. Location Station Name Latitude Longitude 1 AAQ1 Project Site 28 27'57.59"N 77 35'11.18"E 2 AAQ2 BASANTPUR 28 28'38.31"N 77 37'5.35"E 3 AAQ3 BIRONDI 28 28'47.41"N 77 32'27.56"E 4 AAQ4 RAMGARH 28 29'36.82"N 77 34'45.85"E 5 AAQ5 LAD PURA 28 25'46.47"N 77 35'16.84"E AMBIENT AIR MONITORING LOCATIONS ON MAP Report Prepared by: ITL LABS PVT LTD, New Delhi 8
229 Environmental Monitoring Report at IIT GN project near Ajayabpur, Greater Noida AMBIENT AIR QUALITY MONITORING DATE LIST Month Week 1st Week 2nd week 1st Month 3rd week 4th week 1st Week 2nd week 2nd Month 3rd week 4th week 1st Week 2nd week 3rd Month 3rd week 4th week AQ1 Project Site 2-Dec-16 AQ2 AQ3 AQ4 AQ5 BASANTPUR 5-Dec-16 BIRONDI 7-Dec-16 RAMGARH 7-Dec-16 LAD PURA ** 3-Dec Dec-16 9-Dec-16 9-Dec-16 ** 12-Dec Dec Dec-16 ** 15-Dec Dec Dec Dec-16 ** 17-Dec Dec Dec Dec Dec-16 ** 21-Dec Dec Dec Dec-16 ** 26-Dec Dec Dec-16 ** 27-Dec Dec Dec Dec-16 ** 29-Dec-16 2-Jan-17 2-Jan-17 3-Jan-17 3-Jan-17 ** 7-Jan-17 7-Jan-17 5-Jan-17 5-Jan-17 ** 10-Jan Jan-17 9-Jan-17 ** 9-Jan Jan Jan Jan-17 ** 14-Jan Jan Jan Jan Jan-17 ** 20-Jan Jan Jan Jan-17 ** 25-Jan Jan Jan-17 ** 24-Jan Jan Jan Jan-17 ** 27-Jan Jan Jan Jan Jan-17 ** 4-Feb-17 4-Feb-17 2-Feb-17 2-Feb-17 ** 7-Feb-17 7-Feb-17 6-Feb-17 ** 6-Feb-17 9-Feb-17 9-Feb Feb-17 ** 11-Feb Feb Feb Feb Feb-17 ** 17-Feb Feb Feb Feb-17 ** 22-Feb Feb Feb-17 ** 21-Feb Feb Feb Feb-17 ** 24-Feb-17 Report Prepared by: ITL LABS PVT LTD, New Delhi 9
230 Environmental Monitoring Report at IIT GN project near Ajayabpur, Greater Noida SUMMARY OF AMBIENT AIR QUALITY RESULTS FIRST MONTH First Week Parameters Unit AQ1 AQ1 AQ2 AQ2 Project Site Project Site BASANT PUR BASANT PUR AQ3 AQ3 BIRONDI BIRONDI AQ4 AQ4 AQ5 AQ5 RAMGARH RAMGARH LAD PURA LAD PURA 2-Dec-16 3-Dec-16 5-Dec Dec-16 7-Dec-16 9-Dec-16 7-Dec-16 9-Dec PM10 g/m 3 PM2.5 g/m SO2 g/m NO2 g/m (<1 PPM) (<1 PPM) (<1 PPM) (<1 PPM) (<1 PPM) (<1 PPM) (<1 PPM) (<1 PPM) AQ1 Project Site 12-Dec16 AQ1 Project Site 14-Dec16 AQ2 BASANT PUR 12-Dec16 AQ2 BASANT PUR AQ3 AQ3 AQ4 AQ4 BIRONDI BIRONDI RAMGARH RAMGARH 14-Dec Dec16 17-Dec16 AQ5 LAD PURA 15-Dec16 AQ5 LAD PURA 17-Dec16 CO mg/m THC PPM Second Week Parameters Unit PM10 g/m PM2.5 g/m SO2 g/m NO2 g/m (<1 PPM) (<1 PPM) (<1 PPM) (<1 PPM) (<1 PPM) (<1 PPM) (<1 PPM) (<1 PPM) AQ1 Project Site 19-Dec16 AQ1 Project Site 21-Dec16 AQ2 BASANT PUR 22-Dec16 AQ2 BASANT PUR AQ3 AQ3 AQ4 AQ4 BIRONDI BIRONDI RAMGARH RAMGARH AQ5 LAD PURA AQ5 LAD PURA 24-Dec Dec16 21-Dec16 22-Dec Dec-16 CO mg/m THC PPM Third Week Parameters Unit PM10 g/m PM2.5 g/m SO2 g/m NO2 g/m (<1 PPM) (<1 PPM) (<1 PPM) (<1 PPM) (<1 PPM) (<1 PPM) (<1 PPM) (<1 PPM) CO mg/m THC PPM Report Prepared by: ITL LABS PVT LTD, New Delhi 10
231 Environmental Monitoring Report at IIT GN project near Ajayabpur, Greater Noida Fourth Week Parameters Unit AQ1 AQ1 AQ2 AQ2 Project Site 26-Dec16 Project Site 30-Dec16 BASANT PUR 26-Dec16 BASANT PUR AQ3 AQ3 AQ4 AQ4 BIRONDI BIRONDI RAMGARH RAMGARH 30-Dec Dec16 29-Dec16 AQ5 AQ5 LAD PURA 27-Dec16 LAD PURA 29-Dec16 PM10 g/m PM2.5 g/m SO2 g/m NO2 g/m CO mg/m (<1 PPM) (<1 PPM) AQ4 AQ4 AQ5 AQ5 LAD PURA THC 3 PPM (<1 PPM) (<1 PPM) (<1 PPM) (<1 PPM) (<1 PPM) (<1 PPM) SECOND MONTH First Week Parameters Unit AQ1 AQ1 AQ2 AQ2 Project Site Project Site BASANT PUR BASANT PUR AQ3 AQ3 BIRONDI BIRONDI RAMGARH RAMGARH LAD PURA 2-Jan-17 7-Jan-17 2-Jan-17 7-Jan-17 3-Jan-17 5-Jan-17 3-Jan-17 5-Jan PM10 g/m 3 PM2.5 g/m SO2 g/m NO2 g/m (<1 PPM) (<1 PPM) (<1 PPM) (<1 PPM) (<1 PPM) (<1 PPM) (<1 PPM) (<1 PPM) AQ3 AQ3 AQ4 AQ4 AQ5 AQ5 LAD PURA 9-Jan17 LAD PURA 14-Jan17 CO mg/m THC PPM Second Week Parameters Unit AQ1 AQ1 AQ2 AQ2 Project Site 10-Jan17 Project Site 12-Jan17 BASANT PUR 10-Jan17 BASANT PUR BIRONDI BIRONDI RAMGARH RAMGARH 12-Jan-17 9-Jan Jan17 PM10 g/m PM2.5 g/m SO2 g/m NO2 g/m (<1 PPM) (<1 PPM) (<1 PPM) (<1 PPM) (<1 PPM) (<1 PPM) (<1 PPM) (<1 PPM) CO mg/m THC PPM Report Prepared by: ITL LABS PVT LTD, New Delhi 11
232 Environmental Monitoring Report at IIT GN project near Ajayabpur, Greater Noida Third Week Parameters Unit AQ1 AQ1 AQ2 AQ2 AQ3 AQ3 AQ4 AQ4 AQ5 AQ5 Project Site 18-Jan17 Project Site 20-Jan17 BASANT PUR 18-Jan17 BASANT PUR BIRONDI BIRONDI RAMGARH RAMGARH LAD PURA LAD PURA 20-Jan Jan17 21-Jan17 16-Jan Jan-17 PM10 g/m PM2.5 g/m SO2 g/m NO2 g/m CO mg/m THC 3 PPM Fourth Week Parameters Unit (<1 PPM) (<1 PPM) (<1 PPM) (<1 PPM) (<1 PPM) (<1 PPM) (<1 PPM) (<1 PPM) AQ1 Project Site 25-Jan17 AQ1 Project Site 28-Jan17 AQ2 BASANT PUR 24-Jan17 AQ2 BASANT PUR AQ3 AQ3 AQ4 AQ4 BIRONDI BIRONDI RAMGARH RAMGARH 27-Jan Jan17 28-Jan17 AQ5 LAD PURA 24-Jan17 AQ5 LAD PURA 27-Jan17 PM10 g/m PM2.5 g/m SO2 g/m NO2 g/m CO mg/m (<1 PPM) THC 3 PPM (<1 PPM) (<1 PPM) (<1 PPM) (<1 PPM) (<1 PPM) (<1 PPM) (<1 PPM) THIRD MONTH First Week Parameters Unit AQ1 AQ1 AQ2 AQ2 AQ3 AQ3 AQ4 AQ4 AQ5 AQ5 Project Site 30-Jan17 Project Site BASANT PUR 30-Jan17 BASANT PUR BIRONDI BIRONDI RAMGARH RAMGARH LAD PURA LAD PURA 4-Feb Jan17 2-Feb Jan-17 2-Feb-17 4-Feb-17 PM10 g/m PM2.5 g/m SO2 g/m NO2 g/m (<1 PPM) (<1 PPM) (<1 PPM) (<1 PPM) (<1 PPM) (<1 PPM) (<1 PPM) (<1 PPM) CO mg/m THC PPM Report Prepared by: ITL LABS PVT LTD, New Delhi 12
233 Environmental Monitoring Report at IIT GN project near Ajayabpur, Greater Noida Second Week Parameters Unit AQ1 AQ1 AQ2 AQ2 AQ3 AQ3 AQ4 AQ4 Project Site Project Site BASANT PUR BASANT PUR BIRONDI BIRONDI RAMGARH RAMGARH 7-Feb-17 9-Feb-17 7-Feb-17 9-Feb-17 6-Feb Feb17 AQ5 AQ5 LAD PURA 6-Feb17 LAD PURA 11-Feb17 PM10 g/m PM2.5 g/m SO2 g/m NO2 g/m (<1 PPM) CO mg/m THC 3 PPM Third Week Parameters Unit (<1 PPM) (<1 PPM) (<1 PPM) (<1 PPM) (<1 PPM) (<1 PPM) (<1 PPM) AQ1 AQ1 AQ2 AQ2 AQ3 AQ3 AQ4 AQ4 AQ5 AQ5 Project Site 15-Feb17 Project Site 17-Feb17 BASANT PUR 15-Feb17 BASANT PUR BIRONDI BIRONDI RAMGARH RAMGARH LAD PURA LAD PURA 17-Feb Feb17 18-Feb17 13-Feb Feb-17 PM10 g/m PM2.5 g/m SO2 g/m NO2 g/m (<1 PPM) (<1 PPM) (<1 PPM) (<1 PPM) (<1 PPM) (<1 PPM) (<1 PPM) (<1 PPM) AQ1 Project Site 22-Feb17 AQ1 Project Site 25-Feb17 AQ2 BASANT PUR 21-Feb17 AQ2 BASANT PUR AQ3 AQ3 AQ4 AQ4 BIRONDI BIRONDI RAMGARH RAMGARH 24-Feb Feb17 25-Feb17 AQ5 LAD PURA 21-Feb17 AQ5 LAD PURA 24-Feb17 CO mg/m THC PPM Fourth Week Parameters Unit PM10 g/m PM2.5 g/m SO2 g/m NO2 g/m (<1 PPM) (<1 PPM) (<1 PPM) (<1 PPM) (<1 PPM) (<1 PPM) (<1 PPM) (<1 PPM) CO mg/m THC PPM Note: Detail Test report of Ambient Air Quality is attached as APPENDIX A. Report Prepared by: ITL LABS PVT LTD, New Delhi 13
234 Environmental Monitoring Report at IIT GN project near Ajayabpur, Greater Noida AMBIENT NOISE QUALITY LOCATIONS AND RESULTS Report Prepared by: ITL LABS PVT LTD, New Delhi 14

235 Environmental Monitoring Report at IIT GN project near Ajayabpur, Greater Noida AMBIENT NOISE MONITORING LOCATIONS Coordinates Sl.No. Location Station Name Latitude Longitude 1 N1 Project Site 28 27'57.19"N 77 35'11.54"E 2 N2 Ajaybpur 28 28'15.82"N 77 35'35.21"E 3 N3 Maincha 28 26'43.38"N 77 36'22.85"E 4 N4 Dabra 28 27'11.18"N 77 34'59.18"E 5 N5 Godi Bachadae 28 28'39.61"N 77 34'31.33"E 6 N6 Kimarala Village 28 29'30.65"N 77 35'41.18"E 7 N7 Project site temple 28 27'59.54"N 77 35'2.68"E AMBIENT NOISE MONITORING LOCATIONS ON MAP Report Prepared by: ITL LABS PVT LTD, New Delhi 15
236 Environmental Monitoring Report at IIT GN project near Ajayabpur, Greater Noida AMBIENT NOISE MONITORING DATE LIST S. No. Location Name Location Code 1. Project Site N '57.19"N 77 35'11.54"E 17/12/ Ajaybpur N '15.82"N 77 35'35.21"E 16/01/ Maincha N '43.38"N 77 36'22.85"E 23/12/ Dabra N '11.18"N 77 34'59.18"E 18/01/ Godi Bachada N '39.61"N 77 34'31.33"E 19/01/ Kimarala Village N '30.65"N 77 35'41.18"E 20/01/ Project site temple N '59.54"N 21/01/2017 Report Prepared by: ITL LABS PVT LTD, New Delhi Latitude Longitude 77 35'2.68"E Date of Monitoring 16
237 Environmental Monitoring Report at IIT GN project near Ajayabpur, Greater Noida AMBIENT NOISE RESULTS Location Name Leq, db (A) Location Date of Code Monitoring Day Night Area Project Site Commercial N1 17/12/ Ajaybpur Residential N2 16/01/ Maincha Residential N3 23/12/ Dabra Residential N4 18/01/ Godi Bachada Residential N5 19/01/ Kimarala Village Residential N6 20/01/ Project site temple Silence Zone N7 21/01/ Protocol: IS 9989: 1981 PERMISSIBLE LIMIT: AMBIENT NOISE STANDARDS as per THE NOISE POLLUTION (REGULATION AND CONTROL) RULES, 2000 Limits in db(a) Leq Area Category of Area Day Time Night Time A Industrial B Commercial C Residential D Silence Zone Note: Detail Test Report of Ambient Noise is attached as APPENDIX B. Report Prepared by: ITL LABS PVT LTD, New Delhi 17
238 Environmental Monitoring Report at IIT GN project near Ajayabpur, Greater Noida METEOROLOGICAL LOCATION AND REPORT Report Prepared by: ITL LABS PVT LTD, New Delhi 18

239 Environmental Monitoring Report at IIT GN project near Ajayabpur, Greater Noida METEOROLOGICAL LOCATION Coordinates Sl.No. 1 Location M1 Station Name Project site Latitude Longitude 28 27'57.49"N 77 35'12.29"E METEOROLOGICAL LOCATION ON MAP Report Prepared by: ITL LABS PVT LTD, New Delhi 19
240 Environmental Monitoring Report at IIT GN project near Ajayabpur, Greater Noida SUMMARY OF METEOROLOGICAL DATA Avg 2 Max 25.6 Min 15.4 Avg 88.0 Max 97 Min 80 Prominent Wind Direction SE SW SW W SW SW SW NE NE & E S & SE SE SE SW W W & SW W W W S S & SW S & SE E E W W & NW W & NW W S & SW W & SW S & SW W & SW S & SW SE SE W & SW S & SE E & SE E & SE E & SE S & SE Temperature ( C) Date Humidity (%) Report Prepared by: ITL LABS PVT LTD, New Delhi Wind Speed (Km/h) Avg 4.0 Max 8.3 Min Rainfall (mm) 20
241 Environmental Monitoring Report at IIT GN project near Ajayabpur, Greater Noida W & SW SW W W W & SW W & SW W & SW W W & NW W & NW S & SW S & SW W & SW W W & SW W & NW W W & NW W & SW W & NW W W & SW W SE W NE SE E & NE E S & SE S & SE W & SW NW W W W & SW W W W W & SW S S S W W Report Prepared by: ITL LABS PVT LTD, New Delhi 21
242 Environmental Monitoring Report at IIT GN project near Ajayabpur, Greater Noida W & SW W & NW W & SW W & NW W & NW Note: Detail Test report of Meteorological Survey is attached as APPENDIX C. Report Prepared by: ITL LABS PVT LTD, New Delhi 22
243 Environmental Monitoring Report at IIT GN project near Ajayabpur, Greater Noida GROUND WATER RESULTS AND LOCATIONS Report Prepared by: ITL LABS PVT LTD, New Delhi 23

244 Environmental Monitoring Report at IIT GN project near Ajayabpur, Greater Noida GROUND WATER LOCATION Sl. No Location Sample Code Coordinate (Latitude/ Longitude) Source 1 AJAYBPUR GW '16.52"N 77 35'36.17"E Handpump Date of Sampling 9/12/ MAINCHA VILLAGE GW '43.38"N 77 36'22.85"E Handpump 7/12/ DABRA VILLAGE GW '11.18"N 77 34'59.18"E Handpump 7/12/ GHODI BACHHADE GW '39.61"N 77 34'31.33"E Handpump 7/12/2016 GROUND WATER LOCATIONS ON MAP Report Prepared by: ITL LABS PVT LTD, New Delhi 24
245 Environmental Monitoring Report at IIT GN project near Ajayabpur, Greater Noida Ground Water Results Sl. No. Parameters Location 1 Location 2 Location 3 Location 4 GW '16.52"N 77 35'36.17"E Ajaybpur GW '43.38"N 77 36'22.85"E Maincha village GW '11.18"N 77 34'59.18"E Dabra village GW '39.61"N 77 34'31.33"E Ghori bachhade Colour, Hazen units Odour 1.0 Agreeable 2.0 Agreeable 2.0 Agreeable 2.0 Agreeable 7.46 Agreeable < Agreeable < Agreeable < Agreeable < ph Value Taste Turbidity, NTU Total Dissolved solids, mg/l Aluminium (as Al), mg/l Ammonia (as total ammonia-n), mg/l Anionic detergents (as MBAS), mg/l Barium (as Ba), mg/l Boron (as B), mg/l Calcium (as Ca), mg/l Chloramines (as Cl2), mg/l Chloride (as Cl), mg/l Copper (as Cu), mg/l 16 Fluoride (as F), mg/l Free residual chlorine, mg/l Iron (as Fe), mg/l Magnesium (as Mg), mg/l Manganese (as Mn), mg/l 21 Mineral oil, mg/l Absent Absent Absent Absent 22 Nitrate (as NO3), mg/l Absent Absent Absent Absent 24 Phenolic compounds (as C6H5OH), mg/l Selenium (as Se), mg/l 25 Silver (as Ag), mg/l 26 Sulphate (as SO4), mg/l Sulphide (as H2S), mg/l Location Code Latitude- Longitude Location Name Total Alkalinity (as CaCO3), mg/l Total Hardness (as CaCO3), mg/l Zinc (as Zn), mg/l 31 Cadmium (as Cd), mg/l 32 Cyanide (as CN), mg/l Absent Absent Absent Absent 33 Lead (as Pb), mg/l 34 Mercury (as Hg), mg/l Molybdenum (as Mo), mg/l Nickel (as Ni), mg/l Report Prepared by: ITL LABS PVT LTD, New Delhi 25
246 Environmental Monitoring Report at IIT GN project near Ajayabpur, Greater Noida ND ND ND ND ND ND ND ND 41 Total Chromium (as Cr), mg/l Alachlor 42 Atrazine 43 Aldrin 44 Alpha HCH 45 Beta HCH 46 Butachlor 47 Chlorpyriphos 48 Delta HCH Dichlorophenoxyacetic acid DDT (o.p and p.p Isomers of DDT, DDE & DDD) Endosulfan (alpha, beta, and sulphate) Ethion 53 Gamma HCH (Lindane) 54 Isoproturon 55 Malathion 56 Methyl parathion 57 Monocrotophos 58 Phorate 59 Total Coliform/100ml Absent Absent Absent Absent 60 Escherichia coli/100ml Absent Absent Absent Absent Polychlorinated biphenyls (as PCB), mg/l Polynuclear aromatic hydrocarbons (as PAH), m g/l Total Arsenic (as As), mg/l Note: Detail Test report of Ground Water is attached as APPENDIX D. Report Prepared by: ITL LABS PVT LTD, New Delhi 26
247 Environmental Monitoring Report at IIT GN project near Ajayabpur, Greater Noida SURFACE WATER RESULTS AND LOCATIONS Report Prepared by: ITL LABS PVT LTD, New Delhi 27
 Source Date of Sampling SW1 28")
248 Environmental Monitoring Report at IIT GN project near Ajayabpur, Greater Noida SURFACE WATER LOCATION Sl. No Location KOT ESCAPE CANAL MAIN KANDLA DISTRIBUTOR CANAL UPPER GANGA CANAL NEAR BASANTPUR DATAWALI VILLAGE LAKE Sample Code Coordinate (Latitude/ Longitude) Source Date of Sampling SW '16.63"N 77 34'55.61"E Canal 11/02/2016 SW '15.03"N 77 34'55.41"E Canal 14/02/2016 SW '47.62"N 77 37'17.47"E Canal 14/02/2016 SW '35.81"N 77 34'0.86"E Pond 11/02/2016 SURFACE WATER LOCATIONS ON MAP Report Prepared by: ITL LABS PVT LTD, New Delhi 28
249 Environmental Monitoring Report at IIT GN project near Ajayabpur, Greater Noida SURFACE WATER RESULTS S.No. Parameters Location Code Results 1. Colour, Hazen units Colourless SW N E MAIN KANDLA DISTRIBUTOR CANAL Colourless 2. Odour Odourless Odourless Odourless Odourless 3. ph Value Temperature ( C) Turbidity, NTU Total Dissolved solids, mg/l Conductivity at 20 C, µs/cm Total Suspended Solids (as TSS), mg/l Dissolved Oxygen (as DO), mg/l Chemical Oxygen Demand (as COD), mg/l Biochemical Oxygen Demand (as BOD) (3 days at 27 C), mg/l Oil & Grease, mg/l Nil Nil Nil Nil Nil Nil Nil 15. Phosphate (as PO4), mg/l Anionic detergents (as MBAS), mg/l Sodium (as Na), mg/l Nil Nil Nil Potassium (as K), mg/l Nil Nil Nil Nil 17. Barium (as Ba), mg/l 18. Calcium (as Ca), mg/l Silica, mg/l Chloride (as Cl), mg/l Copper (as Cu), mg/l 22. Fluoride (as F), mg/l Salinity Nil Nil Nil Nil 24. Iron (as Fe), mg/l Latitude- Longitude Location Name SW N E KOT ESCAPE CANAL Report Prepared by: ITL LABS PVT LTD, New Delhi SW N E UPPER GANGA CANAL NEAR BASANTPUR Colourless SW N E DATAWALI VILLAGE LAKE Colourless 29
250 Environmental Monitoring Report at IIT GN project near Ajayabpur, Greater Noida Magnesium (as Mg), mg/l Manganese (as Mn), mg/l Total Nitrogen,(as N2) Nil Nil Nil Nil 28. Nitrate (as NO3), mg/l Phenolic compounds (as C6H5OH), mg/l Absent Absent Absent Absent 30. Selenium (as Se), mg/l 31. Silver (as Ag), mg/l 32. Sulphate (as SO4), mg/l Total Phosphorous (as P), mg/l Total Alkalinity (as CaCO3), mg/l Total Hardness (as CaCO3), mg/l Zinc (as Zn), mg/l 37. Cadmium (as Cd), mg/l 38. Total Petroleum Hydrocarbon Absent Absent Absent Absent 39. Lead (as Pb), mg/l 40. Mercury (as Hg), mg/l 41. Polychlorinated biphenyls (as PCB), mg/l Total Arsenic (as As), mg/l Total Chromium (as Cr), mg/l ND ND ND ND 44. Total Coliform/100ml Absent Absent Absent Fecal Coliform/100ml Absent Absent Absent Note: Detail Test report of Surface Water is attached as APPENDIX E. Report Prepared by: ITL LABS PVT LTD, New Delhi 30
251 Environmental Monitoring Report at IIT GN project near Ajayabpur, Greater Noida SOIL RESULTS AND LOCATIONS Report Prepared by: ITL LABS PVT LTD, New Delhi 31

252 Environmental Monitoring Report at IIT GN project near Ajayabpur, Greater Noida SOIL LOCATIONS Sl. No Location Project site Sample Code S1 1 Coordinate (Latitude/ Longitude) Source 28 27'53.91"N 77 35'12.19"E Agrifield Date of Sampling 07/12/ Retheri Village S '59.82"N 77 36'6.81"E Agrifield 07/12/ Maincha Village S '47.97"N 77 36'28.18"E Agrifield 07/12/2016 SOIL LOCATIONS ON MAP Report Prepared by: ITL LABS PVT LTD, New Delhi 32
253 Environmental Monitoring Report at IIT GN project near Ajayabpur, Greater Noida SOIL RESULTS SL. NO. CHARACTERISTICS OBSERVATION UNITS Location Code Latitude- Longitude Location Name S1 S2 S '53.91"N 28 27'59.82"N 28 26'47.97"N 77 35'12.19"E 77 36'6.81"E 77 36'28.18"E Project Site Retheri Village Maincha Village Texture - Silt Loam Silt Loam Silt Loam Sand % Silt % Clay % Porosity % Water Holding Capacity % Permeability cm/h Moisture % Cation Exchange Capacity meq/ 100gm ph at 25 C EC µmhos/cm Bulk Density g/cc Sodium Absorption Ratio Available Nitrogen mg/kg Available P as PO4 mg/kg Potassium as K meq/ 100gm Exchangeable Ca meq/ 100gm Exchangeable Mg meq/ 100gm Exchangeable Na meq/ 100gm Total Organic Matter % Zinc as Zn mg/kg Lead as Pb mg/kg Iron as Fe mg/kg Copper as Cu mg/kg < 05 < 05 < Arsenic as As mg/kg < 05 < 05 < 05 Note: Detail Test report of Soil is attached as APPENDIX F. Report Prepared by: ITL LABS PVT LTD, New Delhi 33
254 EIA of DMIC Integrated Industrial Township Greater Noida [DMIC IITGNL] Annexure- VII Land Allotment Letter DMIC IITGNL
255
256 EIA of DMIC Integrated Industrial Township Greater Noida [DMIC IITGNL] Annexure- VIII All Approved Drawings/ Maps
257

258 FINAL FSI PLAN FOR INTEGRATED INDUSTRIAL TOWNSHIP, GREATER NOIDA Project: CONSULTANCY SERVICES FOR MASTER PLAN,PRELIMINARY DESIGN REPORT ALONG WITH TENDER DOCUMENTS FOR DEVELOPMENT OF TRUNK INFRASTRUCTURE FOR INTEGRATED INDUSTRIAL TOWNSHIP UNDER DADRI-NOIDA-GHAZIABAD INVESTMENT REGION OF DMIC For: INTEGRATED INDUSTRIAL TOWNSHIP GREATER NOIDA LIMITED Client: DELHI-MUMBAI INDUSTRIAL CORRIDOR DEVELOPMENT CORPORATION (DMICDC) Consultant: Drawing title: FINAL FSI PLAN FOR INTEGRATED INDUSTRIAL TOWNSHIP, GREATER NOIDA N in mts Scale; A2 Date:15/01/2015 Rev:14 Drawing No:TCE.7504A-292-LU-6301
259 FINAL ROAD HIERARCHY PLAN FOR INTEGRATED INDUSTRIAL TOWNSHIP, GREATER NOIDA Project: CONSULTANCY SERVICES FOR MASTER PLAN,PRELIMINARY DESIGN REPORT ALONG WITH TENDER DOCUMENTS FOR DEVELOPMENT OF TRUNK INFRASTRUCTURE FOR INTEGRATED INDUSTRIAL TOWNSHIP UNDER DADRI-NOIDA-GHAZIABAD INVESTMENT REGION OF DMIC For: INTEGRATED INDUSTRIAL TOWNSHIP GREATER NOIDA LIMITED Client: DELHI-MUMBAI INDUSTRIAL CORRIDOR DEVELOPMENT CORPORATION (DMICDC) Consultant: Drawing title: FINAL ROAD HIERARCHY PLAN FOR INTEGRATED INDUSTRIAL TOWNSHIP, GREATER NOIDA N in mts Scale; A2 Date:15/01/2015 Rev:14 Drawing No: TCE.7504A-292-TP-6301
260
261
262
263 N LEGEND CATCH MEAT AREA FLOW DIRECTION POND PROJECT BOUNDARY Project: CONSULTANCY SERVICES FOR MASTER PLAN,PRELIMINARY DESIGN REPORT ALONG WITH TENDER DOCUMENTS FOR DEVELOPMENT OF TRUNK INFRASTRUCTURE FOR INTEGRATED INDUSTRIAL TOWNSHIP UNDER DADARI-NOIDA-GHAZIABAD INVESTMENT REGION OF DMIC For: INTEGRATED INDUSTRIAL TOWNSHIP GREATER NOIDA LIMITED Client: DELHI-MUMBAI INDUSTRIAL CORRIDOR DEVELOPMENT CORPORATION (DMICDC) Drawing Title: STORM WATER CATCHMENT AREA in consortium with CONSULTING ENGINEERS LIMITED ATKINS TCE.7504A-152-SD-6000
264 EIA of DMIC Integrated Industrial Township Greater Noida [DMIC IITGNL] Annexure- IX Affidavit on Stamp Paper

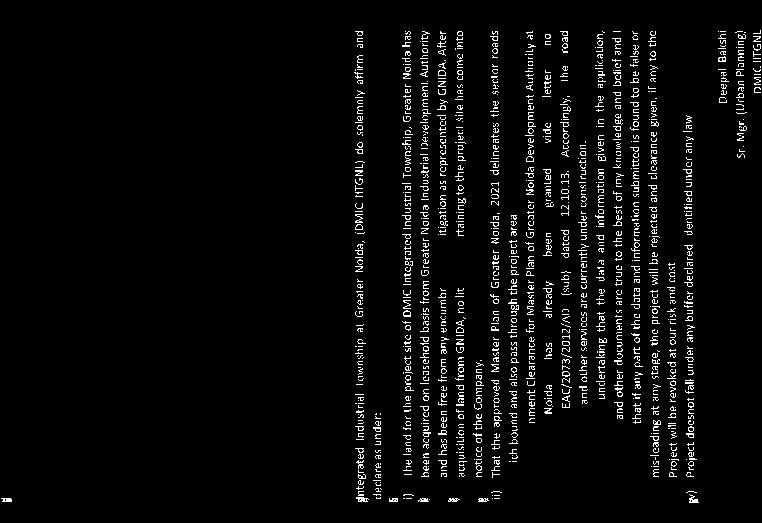

265