Delhi Environment Program, Indicus Foundation
|
|
|
- Phoebe Barnett
- 5 years ago
- Views:
Transcription
1 Delhi Environment Program, Indicus Foundation

2 Why is there so much conflicting evidence? What prevents the government from taking the right action? How should we respond as organizations, RWAs and the community? 1 st Week November 2016, 9.00 AM, India Gate
3 URJA, IIC Studies and public outreach by CSE, TERI, IIT Kanpur, IIT Mumbai, Environmental and Public Health Researchers worldwide DPCC, CPCB, Ministry of Environment and others 100s of studies quoted in media and references Pallavi Pant, and indianopendata.com team Conversations with Engineers, Farmers and Doctors and domain experts Yet to: Policymakers and Activists Work in progress, comments:

4 The Gangetic belt & large cities worst affected More than half of India s population Greenstone et. al. 2015, EPW


5 Vehicle Fuels Biomass Dust Power Organic compounds Sox, NOx SPM * Dirty Air * Output * Health Sources Technology Pollutants Weather Life-styles We will proceed in this direction
6


7 Pollution exacerbates ailments resulting in death
8 Life expectancy of 660m reduced by 3.2 yrs Harvard-Chicago-Yale Study 1.4 million dead, welfare loss at 6.4% of GDP World Bank Study ,000 deaths and >20 mill Asthma cases due to PM exposure from coal power plants IIT-Delhi Tens of thousands are dying in Delhi annually Premature Deaths in Delhi due to high SPM for ,000 50,000 48,651 40,000 30,000 20,000 19,716 14,844 10,000 7, SPM 2.5 SPM 10.0 Source: IIT-M 2016

9 Agriculture productivity stagnating Punjab Significant areas in Haryana and UP Greater wear & tear of infrastructure Cost of lighting and heating Transport and communications Fewer work hours especially fog days Greater morbidity and mortality Poor likely to be impacted the most? Tripathi et. al. 2015, Environmental Science and Technology

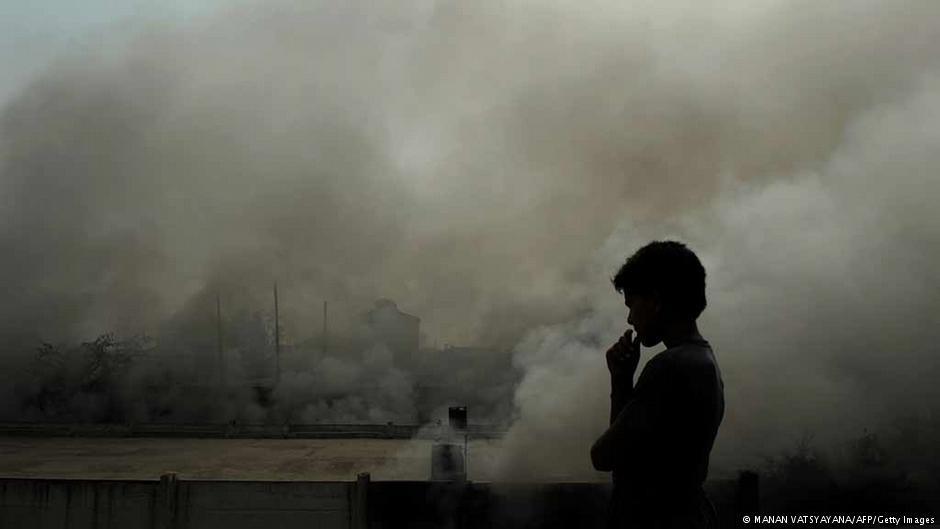
10 Probal Rashid
11

12 Festival Season Crop Burning


13 Image Source: University of Alaska-Fairbanks

14

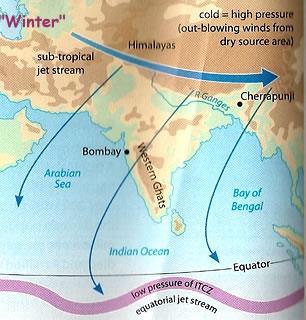
15 A cocktail of gases and particles Escape into upper atmosphere Some gets blown by winds Some settles on land surface Suspended in lower atmosphere Change character gas to particle Measurement errors are natural But no disagreement on severity
16 Air Quality Index Air Quality Index Values in Delhi Unsatisfactory Max AQI Meaning 50 Good 100 Satisfactory 200 Moderate 300 Poor 400 Very Poor >401 Severe Maximum Minimum Source: CPCB
17 Pollutant Time Weighted Average used for Standards Concentration in Ambient Air Standards Actual Levels* Sulphur Dioxide (SO2) µg/m3 Annual Nitrogen Dioxide (NO2) µg/m3 Annual PM10 µg/m3 Annual PM2.5 µg/m3 Annual Ozone µg/m3 8 hours Annual Mean SPM2.5 ug/m3 *For November & December 2016, from Indiaopendata.com & CPCB Source: World Health Organization (WHO)
18 For lucidity and focus Correlated with other pollutants Though not perfectly so Most serious problem in Delhi Most solutions for PM will reduce other pollutants as well PM PM Summer of 2014 Winter of Source IIT-K Study, 2016

19 PM 10 - less than 10 micrometres can stay in the air for many hours PM less than 2.5 micrometres stays in the air for many days & weeks Some gases also spontaneously convert to particulate matter
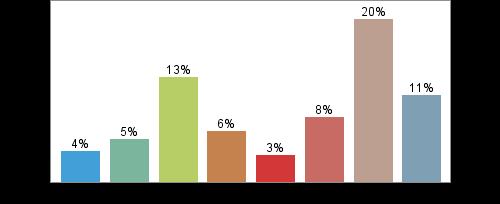
20 Sources of PM2.5 (micrograms per cubic metre) Sources Summer Winter Summer Winter Average Secondary Particles Biomass Burning Vehicles Solid Waste Burning Coal and Fly Ash Soil and Road Dust Construction Material Industrial Boiler Indicative Distribution of Sources of PM2.5 Soil and Road Dust 14% Coal and FlyAsh 15% Solid Waste 8% Vehicles 18% Secondary Particles 23% Biomass Burning 19% Total Source: Comprehensive Study on Air Pollution and Green House Gases (GHGs) in Delhi: IIT Kanpur, 2016

21 Indicative Distribution of Sources of PM2.5 Soil and Road Dust 14% Coal and FlyAsh 15% Solid Waste 8% Vehicles 18% Secondary Particles 23% Biomass Burning 19% Image Source: pollutionsolutions.com

22 Different types of roads in Delhi, Haryana and Punjab in (in km) State Surfaced Non- Surfaced Total %age Surfaced Delhi 23,381 8,686 32, Haryana 41,892 4,395 46, Punjab 93,820 11, , Source: Basic Road Statistics , Ministry of Road Transport and Highways
23 Surface additional ~8,000 km of roads in Delhi Improve quality of remaining roads Surfacing Potholes Quick repairing of dug roads Claim : Vacuuming or washing of Delhi roads will have low cleaning efficiency Why? Long term solution would also include Publicly Owned Green Belt Around Delhi Source: Basic Road Statistics , Ministry of Road Transport and Highways
 States Delhi 70 15,380 Haryana 35,800 71,160 Punjab 83,150 91,800 ROBERTO SCHMIDT VIA GETTY")
24 PM2.5 emission by Biomass burning From Crop Residue Burning (tonnes/yr) From Household Energy Consumption (tonnes/yr) States Delhi 70 15,380 Haryana 35,800 71,160 Punjab 83,150 91,800 ROBERTO SCHMIDT VIA GETTY IMAGES
25 What Solutions Specifics Straw (~80%) Stubble (~20%) Household cooking - Firewood, Dung, Crop residue Create demand for straw Reduce cost of straw collection Eliminate need to destroy stubble Universal access to LPG/PNG Strawboard Cattle-feed (with additives) Power esp. briquettes Straw collection and baling incl. in MANREGA Mechanical options Delay Rabi/Prepone Kharif Seed drill machine Mandate District Collectors to ensure universal access to LPG/PNG for all households

26 HCVs 16% Others/Mi sc 0% LCVs 8% Pass Cars - Diesel 10% 2 Wheelers 51% Pass Cars - Petrol 10% 3 Wheelers 5% Traffic of Delhi, Source: intoday.com
27 Coordination is not necessary between fuel and vehicle Accelerate low Sulphur diesel and petrol availability (10 ppm) Low suplhur capacity already exists in India and is exported from private refineries It does not take long to convert refinery and cost about 30,000 crores as per government est. Do not wait for vehicle manufacturers to convert to BS6 Older vehicles can and do work on lower fuel All countries in developed world converted with little changes in engines The more the roads the more the pollution Public transport will need to be combined with higher vehicle taxes and more footpaths, parking etc.
 Of which washed Delhi 5.")

28 Total Offtake of Non-coking Coal ( , Million Tons) State Coal Consumption by Power Utilities Total Coal Consumption (Dispatches) Of which washed Delhi Punjab Haryana Uttar Pradesh Rajasthan India
29 NTPC and Coal India Ltd major consumer and producer of coal Both are highly profitable (PAT ) NTPC >10,000 Crore Coal India > 14,000 Crore Employ ~5 lakh people Immediate Mandate to use better coal washed coal in Punjab, Haryana, Delhi and Rajasthan External monitoring of Power Plant emission Increase price of coal Staggered withdrawal from coal into GAS for NTPC

30 Image source: nature.com
31 Gases that convert to particles SOx, NOx, Volatile Compounds, etc. Similar sources as sources of other pollutants (not incl. dust but incl. construction) May be disproportionately accounted outside Delhi but not enough clarity yet Concentrating on other sources would reduce secondary particle pollution as well.
32 There will always be many unknowns More research is always needed but that should not stop action There will always be pollution, and a long term perspective requires A parallel environmental monitoring mechanism Improve community-executive interface Strengthen the executive s capabilities to counteract industry lobbies Overdependence on judiciary worsens bureaucratic laziness Incentivize a few producers to act Not force many consumers/unorganized players to change behavior Time for India to talk about environmental taxes Community action has made government change its stance many times Create a Platform for All to come together
33 Laveesh Bhandari Indicus Foundation 2nd Floor, Nehru House, 4-Bahadur Shah Zafar Marg, New Delhi , INDIA Ph , Mob