Residential Grey Water Heat Recovery. Final Design Presentation
|
|
|
- Randall Henderson
- 5 years ago
- Views:
Transcription
1 Residential Grey Water Heat Recovery Final Design Presentation

2 Project/Scope Final Design Theoretical Simulations Model Construction Testing Results Cost Savings Health and Safety Design Recommendations Future Look Ahead Conclusions
3 Mission Statement To design, develop and test a safe, reliable, and efficient method to recover heat traditionally lost from residential grey water in a manner which reduces the energy costs of a residential building. Residential waste water heat recovery unit for preheating potable boiler feedwater

4 Residential applications modeled and tested Showers and dishwashers included as grey water devices Model design, construction, and testing at typical operating conditions Recommendations for future testing

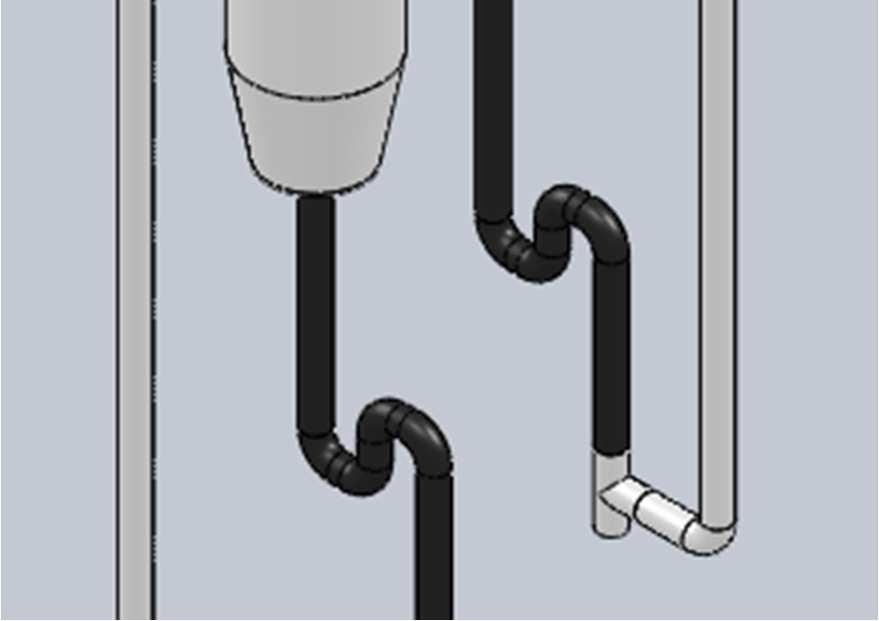
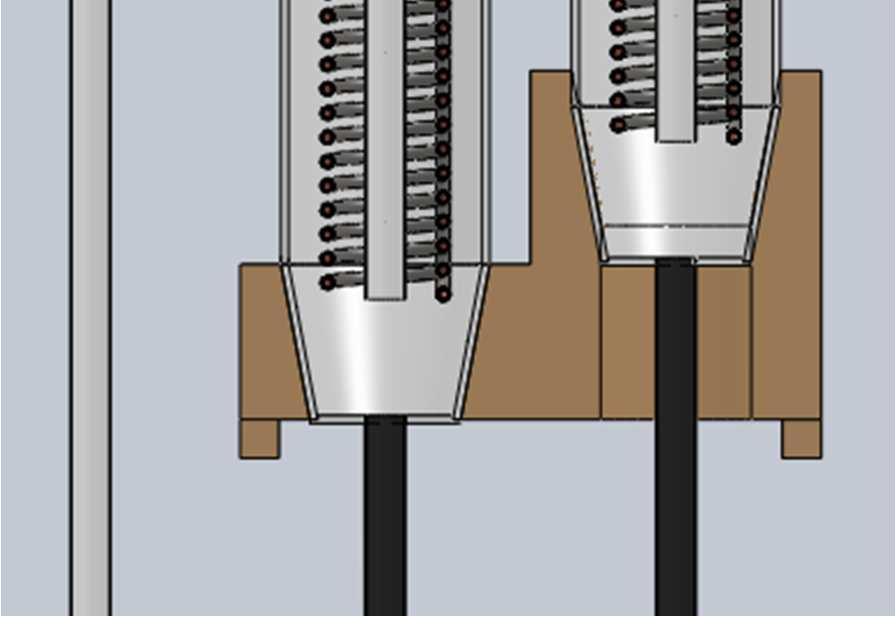
5 Coil Module The coil diameter is six inches for bending process Bottom is fitted with a draining valve that runs to the sewer for maintenance Bypass in case system backs up


6 Coil Coils protective coating provides 2 layers of separation No areas exposed to GW.

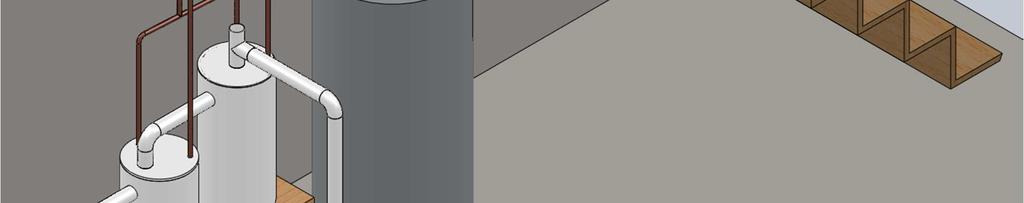
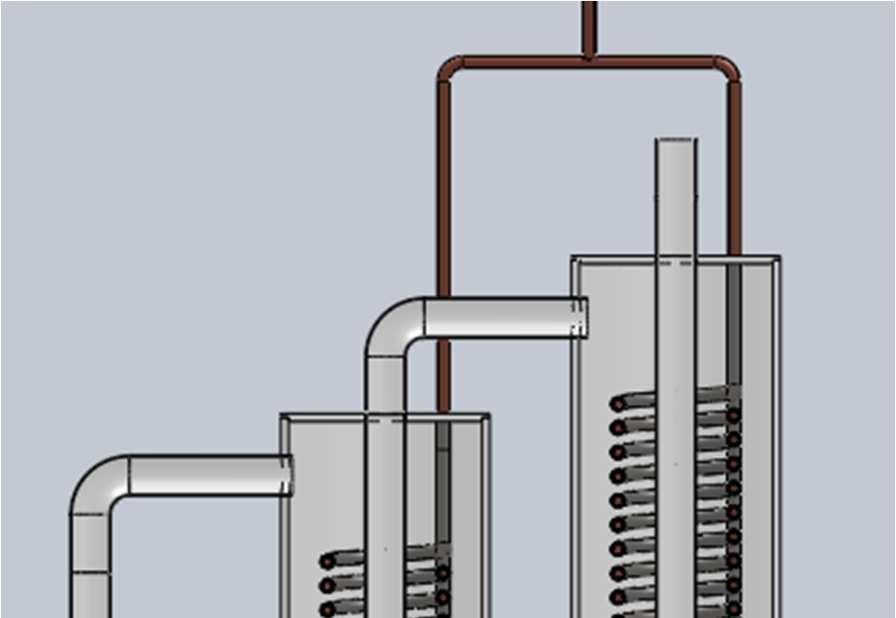
7 Two Module System PW connected in parallel GW connected in series Stand is incorporated to ensure over flow from coil to tank modules Would sit in close vicinity to HWT to ensure minimal losses through lines


8

9 Reservoir Specification: Quantity Material PVC, ABS Total Volume 40 Lt Greywater Volume 34 Lt Length 36 Diameter 10 Coil Specification: Quantity Tube Material Copper Volume 0.5 Lt Tube Diameter ½ Tube Length 25 ft Coil Diameter 6
10 During showers, a 10 C temperature increase predicted for the potable water in our constructed model. Showers are typically 90% of household hot water demand The remaining 10% of hot water demand creates potable flow but no grey water flow in the heat exchanger. The predicted average potable water temperature rise for our model is 6.85 C Our multi-stage tests predict a 15 C average temperature increase for a typical shower. Multi-stage should be more cost effective with higher hot water demands


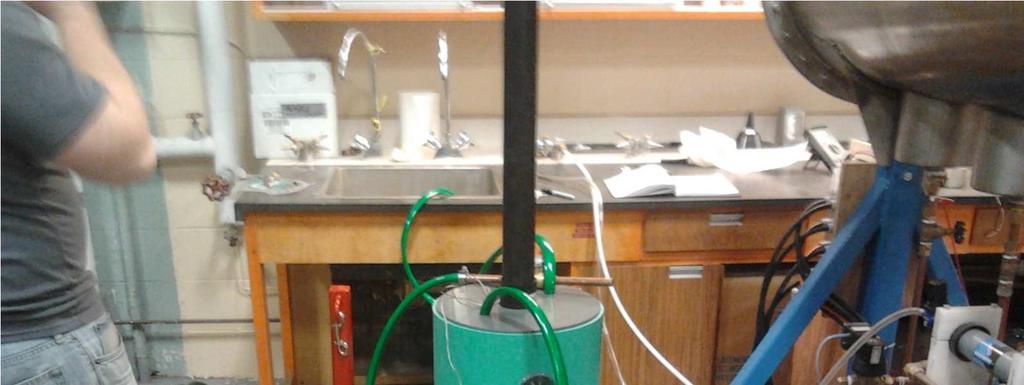
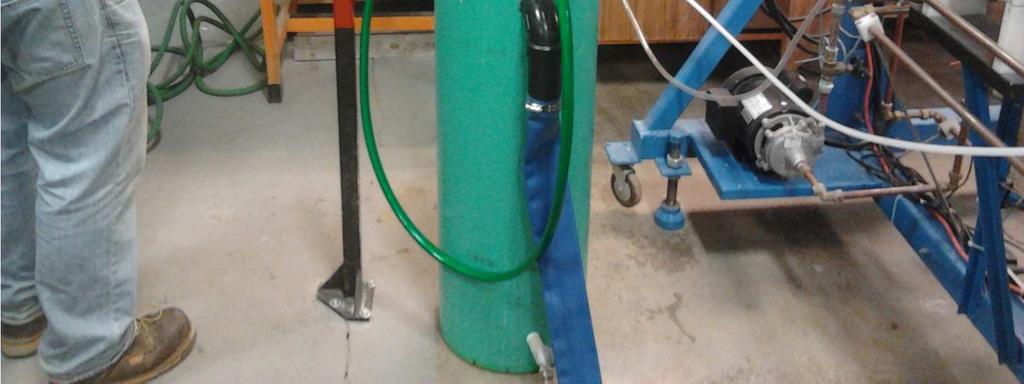
11 Proof of Concept model Reservoir with bottom sealed Overspill to allow for flow and an inlet tube Copper coil module attaches to cover of device Drain valve installed for emptying Hoses and hose clamps for connectors from sink to unit

12 Bill of Materials Material Quantity Unit Price Total Cost ($) Copper Tube 1/2" 20ft 2.26$/ft $51.98 Reservoir for Coil Comp. 1 ea. DONATION $50.00 Work Space Fluids DONATION $0.00 Tech Services 10$/hr $ Miscellaneous 3 ea. 10$ ea. $50.00 Actual Cost including Reservoir: $ $216.98
 Batch flow Only potable running (sink and bath) Typical Morning 3 ten")

13 Tested different flow conditions: Simultaneous flow Potable and wastewater flowing (shower and dishwasher) Batch flow Only potable running (sink and bath) Typical Morning 3 ten minute showers with 5 minute breaks Modular design multi-stage flow Potable water in parallel between two modules Reservoir temperature of second test at GW out temperature of first test
14 Typical morning testing 3 ten minute showers Tested different flow rates Q = 1.4, 1.6, 2.0, & 2.5 gal/min Slower flow rates result in more heat transfer Additional tests: Continuous running, Q=2.5 Decrease reservoir volume
15 Modular Design 1 st stage ΔT Average = 14.50⁰C 2 nd stage ΔT Average = ⁰C ΔT Average,1 = ⁰C Single Module, Q=1.5 gal/min ΔT average,2 = 8.92 ⁰C Multi-stage arrangement feasible with high hot water demand Gain 4 ⁰C using 2 nd module Feasibility dependant on GW temperature entering 2 nd module
16 Batch Flow Tests - Potable water, Q = 1.5 gal/min Test scenarios: Sink use, tank temp = 25 ⁰C Bath slosh, tank temp = 40 ⁰C Potable water temps begin to converge as the heat is being extracted from the reservoir over time
 14.50 43% 2 nd stage (Q = 0.75 gal/min) 11.51 49% Batch Flow 25⁰C Tank (Q = 1.5 gal/min) 5.")
17 Test ΔT (⁰C) Efficiency (%) Typical Morning Q = 1.4 gal/min % Q = 1.6 gal/min % Q = 2.0 gal/min % Q = 2.5 gal/min % Multi-Stage Design 1 st stage (Q = 0.75 gal/min) % 2 nd stage (Q = 0.75 gal/min) % Batch Flow 25⁰C Tank (Q = 1.5 gal/min) % 40⁰C Tank (Q = 1.5 gal/min) %

18 Cost Savings based on 40% of Fresh water demand being hot water used in this device Additional 5% comes from Dishwashers These were the average values for Canadian households in 2004
19 The cost savings are dependant on two parameters. Average temperature rise for potable water Hot water demand Plot shows ten degree rise for incoming potable water against hot water demand Hot water demand varies from 20 gallons per day to 60 gallons per day for a typical household
20 140.0 Cost savings ($/Year) KW-Hr/Yr Savings per year Cost Savings (KW-Hr/Yr) The trend shows that as HWD is increased, the cost savings per year increase The trends are based on the unit energy consumption equation
21 Model vs. Predicted Cost Savings Savings per year Model Savings per year Cost Savings per year
22 The only major safety risk is potential contamination of potable water supply by greywater. Risk is mitigated by using two layers of material separation between potable water and grey water and no potable water joints exposed to greywater. Potable water lines at greater pressure than greywater therefore if leak occurs potable water will leak into greywater. Product has a useful life of at least 10 years and the majority of components may be recycled at the end of its life.

23 Include Baffles in the second prototype Baffles are discs that will increase the mixing of the grey water inside the reservoir Gives the hot water entering from the bottom more time to reach the top, creating a more even temperature profile in the tank Reduce the volume in the second prototype With such a large tank used in the model testing, the mixing was poor A smaller volume in the Reservoir will result in higher convection coefficient surrounding coils Multistage for higher hot water demand
24 Explore other means of reducing potable water transit time This results in greater heat exchange to the potable water Possible avenues to explore: Increasing diameter of the copper coil Parallel flow between modules Recommended end use: Use in conjunction with energy efficient fixtures Homes with high hot water loads More efficient for shower users than bath users
25 Further prototypes should be developed and tested Using the design recommendations obtained from the first model. Greater information about GWHR system performance It is recommended that a GWHR system monitoring and evaluation program be implemented by installing the system in several residential houses and evaluating performance. Develop installation guidelines. Installation guidelines and a tool for predicting energy savings should be made available to potential consumers. Market evaluation. There is little information about consumer interest in GWHR systems therefore surveys should be conducted to determine potential market information.
26 It can be concluded that: There will be cost savings that will exceed the initial capitol cost of the product There is a great potential for cost savings with larger family households or multiple roommate arrangements Implementation would be the next step in the design process Also the construction of a new prototype that has the proper geometry
27 Fluggen Industries would like to acknowledge the following people and companies: Steve Bruneau (Project Supervisor) Dave Snook (Tech Services) Gerry Piercy (Ccore) Craig Mitchell Modern Paving
28 Proskiw, G.(1998). Technology Profile: Residential Greywater Heat Recovery Systems. Eslami-nejad, P., & Bernier, M. (2009). Impact of Grey Water Heat Recovery on the Electrical Demand of Domestic Hot Water Heaters. Environment Canada

29 Any Questions? ResidentialHeatRecovery.weebly.com

30

31 Able to warm larger amounts of water during non peak hours Volumes of GW and PW equal. PW volume increased, therefore slower flow through tank Tank holds roughly 20 ltwater Needs to withstand city water pressure on end caps
32