for Integrated Environmental Studies, Mathematics, Moscow Limnological Institute, Irkutsk
|
|
|
- Thomas Arnold
- 5 years ago
- Views:
Transcription
1 Modelling air quality in the Lake Baikal region Clemens Mensink 1, Karen Van de Vel 1, Koen De Ridder 1, Felix Deutsch 1, Joachim Maes 1, Artash Aloyan 2, Alexander Yermakov 2, Vardan Arytyunyan 2, Tamara Khodzher 3 1 VITO - Flemish Institute t for Technological l Research, Centre for Integrated Environmental Studies, 2 Russian Academy of Sciences Institute t for Numerical Mathematics, Moscow 3 Russian Academy of Sciences Siberian i Branch Limnological Institute, Irkutsk 1
2 Contents 1. Objectives of the study 2. The AURORA model 3. Results and discussion 4. Conclusions 2
3 1. Objectives Bilateral scientific co-operation between Russia (INM-RAS) and Flanders (VITO) with the aim: to mutually exchange expertise on transport-chemistry modelling and aerosol physics and chemistry in order to attain improved atmospheric modelling capabilities in both countries to perform a joint validation study for simulation domains in Russia and Flanders 3


4 Studying aerosol formation in the Antwerp area Modelling air quality in the lake Baikal region 4
5 Contents 1. Objectives of the study 2. The AURORA model 3. Results and discussion 4. Conclusions 5
6 2. The AURORA model Air quality modelling in Urban Regions using an Optimal Resolution l Approachh 3-dimensional i Eulerian grid model for meteorologyemissions-transport-chemistry different scales : regional -> urban scale, street-box submodel meteorology from ARPS model (wind, turbulent diffusion, temperature, ) 6
7 2. The AURORA model emissions from various sectors : traffic, industry, domestic combustion, biogene emissions, transport : Walcek advection, Crank-Nicholson diffusion chemistry : Carbon-Bond IV gas-phase chemistry with isoprene, limited PM CACM gas phase mechanism + MADRID2 aerosol module PAH (Polycyclic Aromatic Hydrocarbon) version output : hourly gridded pollutant concentrations (O3, PM10, PM2.5, NO2, benzene, PAH, ) 7


8 8
9 principle of nesting Multiple runs needed going from big domain at coarse resolution to domain of interest at high resolution 9
10 Software structure of nested AURORA-model CORINE, PELCOM, VEGETATION, EDC GTOPO 30 CORINAIR 85, 90, TM3 global EMEP(ann.tot.) Terrain module concentrations (veg,land cover,sh) Emissions Europe ARPS 16-km ARPS 4-km AURORA 16-km AURORA 4-km LS-emissions EMEP-ship ARPS 1-km AURORA 1-km HR-emissions i (incl. MIMOSA) Meteo prepr. ECMWF meteo-data (0.5 resolution) VISAURORA HR air quality maps Traffic Model, EIL(point sources) 10
11 advection 11
12 Surface module: LAICa q a Ta rav r ag r c T v q s( ) T v ψ v h g r ps1 r ps2 q s( T g ) ψ1 ψ 2 T g Tg rps3 ψ 3 r ps4 ψ 4 12
13 validation meteorology (T, q, R s ) s 13
14 validation O 3 concentrations 3 Bottrop simulation observation Essen 14
15 Contents 1. Objectives of the study 2. The AURORA model 3. Results and discussion 4. Conclusions 15
16 3. Results for lake Baikal Lake Baikal is the largest fresh water lake in the world The region is characterised by complex terrain, consisting of steep and densely forested hill slopes surrounding the lake A challenge with respect to the correct simulation of atmospheric dynamics and turbulence. Emissions: few large point sources, which are the dominant sources of air pollution in this area, but no information on other emissions in a wider area 16
17 ARPS AURORA coupling and nesting meteorology transport & transformation NCAR (1 ) TM4 (1 ) ARPS 30 km ARPS 10 km ARPS 3 km ARPS 1 km AURORA 30 km AURORA 10 km AURORA 3 km AURORA 1 km 17


18 AURORA :: nesting levels Number of grid points 60 x x x 50 Horizontal resolution 30km 10km 3km 18
19 AURORA input: terrain data for 3-km domain Domain : 150km x 3km resolution Terrain data : - vegetation information : VEGETATION / SPOT - land use : GLC sea surface temperature : MODIS - topography : Digital Elevation Model 19


20 Two approaches : Bottom up AURORA input: emission data local emission = activity activity factor Top down local emission = proportion of total emission Top down emission modeling : Emission inventory at low resolution Geographical databases : land use, population density, road networks, large point sources, Gridded emission data at high resolution 20


21 Top down emission modelling :: NOx emissions from EDGAR database EDGAR 3.2 database provides emission data for 1995 : - on a 1x1 degree grid - per country 21


22 AURORA: input emission data NOx emissions for 30km, 10km and 3km resolution domains 22
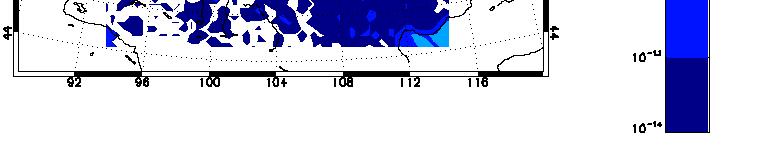
23 AURORA: input emission data SO2 emissions for 3km resolution domains 23
24 ARPS: meteo results average temperature, July 2003 : - Baikal lake : hotter water - city of Irkutsk: urban heat island 24
25 ARPS: validation meteo temperature Irkutsk wind direction Irkutsk temperatur re [ C] meas temp ARPS temp n [ ] wind direction meas winddir ARPS winddir hour since 1/7/2003:00 (UT) hour since 1/7/2003:00 (UT) wind speed Irkutsk wind speed [m/s] 3 2 meas windspd ARPS windspd hour since 1/7/2003:00 (UT) 25


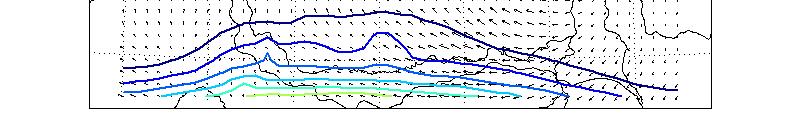

26 ARPS: day and night breezes night breeze July 2, 4am LT day breeze July 2, 3pm LT 26


27 AURORA: average concentration fields SO2 and NO2 concentration fields for the 10km resolution domain 27
28 AURORA: modelled SO2 concentrations Mondy : meas mean July 2003 : 0.5 ug/m3 Listvyanka : meas mean July 2003 : 1.4 ug/m3 Irkutsk : meas mean July 2003 : 2.4 ug/m3 28
29 AURORA: validation SO2 concentrations Monthly average SO2 for July 2003 SO O2 concent tration (µg/ /m³) 5 4,5 4 3,5 3 2,5 2 1,5 1 0,5 0 Mondy Listvyanka Irkutsk Measured Modelled 29
30 Contents 1. Objectives of the study 2. The AURORA model 3. Results and discussion 4. Conclusions 30
31 4. Conclusions Modelling air quality in this part of the world is a challenge! The ARPS model can predict some part of the dynamics, especially in the first part of July. Emission data are difficult to obtain. Background SO 2 concentrations ti (Mondy) seem ok, but the SO 2 concentrations near the main sources are overestimated by +/- a factor of two. Further analysis of the results is needed 31
32 And yes, this was also part of the bilateral co-operation Thank you! 32