IPCC WGI AR6 Needs for climate system observation data. Panmao Zhai. Chinese Academy of Meteorological Sciences, China
|
|
|
- Amy Neal
- 5 years ago
- Views:
Transcription


1 IPCC WGI AR6 Needs for climate system observation data Panmao Zhai Chinese Academy of Meteorological Sciences, China 25 September 2017
2 AR5 WGI Outline 1: Introduction 2: Observations: Atmosphere and Surface Observations 3: Observations: Ocean 4: Observations: Cryosphere 5: Information from Paleoclimate Archives 6: Carbon and Other Biogeochemical Cycles Processes 7: Clouds and Aerosols 8: Anthropogenic and Natural Radiative Forcing 9: Evaluation of Climate Models 10: Detection and Attribution of Climate Change: from Global to Regional 11: Near-term Climate Change: Projections and Predictability Models 12: Long-term Climate Change: Projections, Commitments and Irreversibility 13: Sea Level Change 14: Climate Phenomena and their Relevance for Future Regional Climate Change Annexes including Atlas of Global and Regional Climate Projections Synthesis
3 Proposed WGI Outline Summary for Policy Makers Technical Summary Large-scale climate change Chapter 1: Framing, context, methods Chapter 2: Changing state of the climate system Chapter 3: Human influence on the climate system Chapter 4: Future global climate: scenario-based projections and near-term information Chapter 5: Global carbon, biogeochemical cycles and feedbacks Chapter 6: Short-lived climate forcers Chapter 7: The Earth s energy budget, climate feedbacks, and climate sensitivity Chapter 8: Water cycle changes Chapter 9: Ocean, cryosphere, and sea level change Chapter 10: Linking global to regional climate change Chapter 11: Weather and climate extreme events in a changing climate Chapter 12: Climate change information for regional impact and risk assessment Annexes incl. options for a Regional Atlas and Technical Annexes Glossary Index
4 Proposed WGI Outline Summary for Policy Makers Technical Summary Chapter 1: Framing, context, methods Chapter 2: Changing state of the climate system Climate processes Chapter 3: Human influence on the climate system Chapter 4: Future global climate: scenario-based projections and near-term information Chapter 5: Global carbon, biogeochemical cycles and feedbacks Chapter 6: Short-lived climate forcers Chapter 7: The Earth s energy budget, climate feedbacks, and climate sensitivity Chapter 8: Water cycle changes Chapter 9: Ocean, cryosphere, and sea level change Chapter 10: Linking global to regional climate change Chapter 11: Weather and climate extreme events in a changing climate Chapter 12: Climate change information for regional impact and risk assessment Annexes incl. options for a Regional Atlas and Technical Annexes Glossary Index
5 Proposed WGI Outline Summary for Policy Makers Technical Summary Chapter 1: Framing, context, methods Chapter 2: Changing state of the climate system Chapter 3: Human influence on the climate system Chapter 4: Future global climate: scenario-based projections and near-term information Chapter 5: Global carbon, biogeochemical cycles and feedbacks Chapter 6: Short-lived climate forcers Chapter 7: The Earth s energy budget, climate feedbacks, and climate sensitivity Chapter 8: Water cycle changes Chapter 9: Ocean, cryosphere, and sea level change Regional information Chapter 10: Linking global to regional climate change Chapter 11: Weather and climate extreme events in a changing climate Chapter 12: Climate change information for regional impact and risk assessment Annexes incl. options for a Regional Atlas and Technical Annexes Glossary Index
6 Data Needs Large-scale climate change Process (Carbon &Biogeochemical, Energy, Water cycle, Short-lived climate forcers) Regional climate change Weather and climate extreme events What are the gaps? How to fill the gaps!
7 Large Scale Changes

8 Multiple Lines of Evidence for Climate Change : Warming atmosphere & ocean, snow and ice melting, sea level rising, GHG increasing,, All reflect consistent warming trend. Inconsistent in starting obs.

 Better spatial coverage")
9 Fig. SPM.1b Fig. SPM.2 IPCC 2013 IPCC 2013 Temperature change based on trend 1901 to 2012 ( C) Precipitation Trend (mm/yr per decade) Better spatial coverage for SAT but worse for precipitation!
10
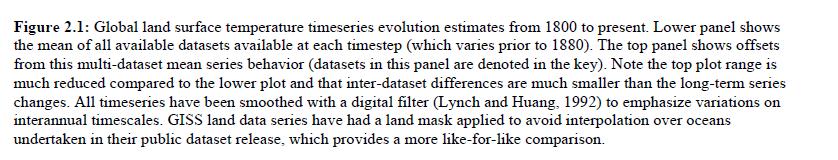
11 Global-scale observations for SAT from the instrumental era began in the mid-19th century.
12
13 Energy Budget
14 Comparison of net top of the atmosphere (TOA) flux and upper ocean heating rates (OHRs) Between 2001 and 2012, the Earth has been steadily accumulating energy at a rate of 0.50 ± 0.43 W m 2

15 Updated Monitoring on changes in global mean temperature and ocean heat content Source: Columbia University/NASA Recent observations confirm the warming trend continues! 2015 is 1.0 above pre-industrial level! More than 90% of the energy stored in the ocean!

16 Updates of AR5 findings : ocean heat content Half of total increase since the industrial has occurred in recent decades, multi-model mean from historical simulation consistent with data (Gleckler et al, Nature Clim. Change, 2016).
17 Water Cycle

18 widespread increases in surface air moisture content
19
20 Atmospheric composition & short lived climate forces
21

22 IPCC 2013 Fig. SPM.5 CO 2 provides largest RF

 Asia and North America.")
23 Annual average surface ozone concentrations from regionally representative ozone monitoring sites around the world. (a) Europe. (b) Asia and North America. (c) Remote sites in the Northern and Southern Hemispheres.
 in seven selected world regions dominated by high NOx")
24 Relative changes in tropospheric NO2 column amounts (logarithmic scale) in seven selected world regions dominated by high NOx emissions.

25 Trends in particulate matter (PM10and PM2.5 with aerodynamic diameters <10 and <2.5 μm,
26 Regional information & Extreme
27

28
29 50 Precipitation Trends are also Different in Northern and Southern China Filled (open) circles 10%, 5% increase (decrease) 20 X Significant at the 5% level

30 Changes in Runoff

31 Will the future precipitation change from the present North drought and South flood to North flood and South drought? IPCC, 2007
32 Precipitation Projection in different periods of the 21st century over China (from Gao et al)
33 No long term trends for landfal l TCs
34 Numbers of cold days/nights have decreased and Numbers of warm days/nights have increased globally since about 1950 Number of heavy precipitation events over land has increased in more regions than it has decreased Global-scale observed trend in drought or dryness since mid- 20th century Long-term changes in tropical cyclone activity, after accounting for past changes in observing capabilities Large-scale trends in storminess or storminess proxies over the last century Trends in small-scale severe weather events such as hail or thunderstorms very likely likely low confidence low confidence low confidence low confidence
35 Change in Weather and Climate Extremes Assessed in National Climate Change Report Extreme Indices Cold Wave Frost Definition Large scale cold air from high latitudes, causing dramatic cooling, severe wind and snowy-rainy weather Tmin<0C Heat Wave Extreme Precipitation Wet Spell Drought Tropical Cyclone Dust Storm Hail Strong Wind Fog Haze Thunder and Lightening Consecutive 5 days Tmax 35 Daily amount >90 percentile Consecutive rain/overcast days Ci, PDSI Cyclone from tropical ocean, with wind speed 10.8m/s Dust day with visibility below 1000m Hail weather Wind Speed 17m/s Visibility <1 km Weather with aloft particles with visibility below 10km Weather with thunder storm
36 GCOS Data support the work of the IPCC fundamentally. Regional,national ECV records can greatly help to fill the gaps. International data exchange is required for both current and historical observation data.

37

38 Over the last few decades, new observational systems, especially satellite-based systems, have increased the number of observations of the Earth s climate by orders of magnitude.