Lecture 4 Economics and Costs
|
|
|
- Cecily Hunt
- 5 years ago
- Views:
Transcription
1 Lecture 4 Economics and Costs Learning curve model to understand how costs of new (energy) technology drops Applications of the learning curve Estimating costs and economics of new energy Economic analysis Tool RETSCREEN, HOMER, Learning Curve
2 Empirical observations on cost development of new technologies

3 History of costs of new technologies Source: IEA (

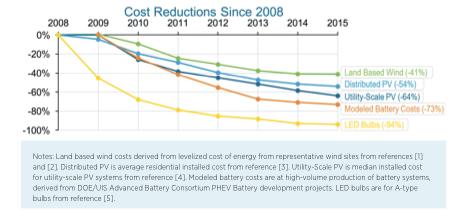

4 Dropping costs of new technologies


5 2020 < $0.5/Wp? Observations on costs: decreasing costs increase volume, and vice versa Price, $/W Progress in solar PV and wind power Cum. volume, MW 2017 Cum.col 300,000 MW $ /Wp price (PV) price (wind) volume (PV)
6 What types of measures bring costs down? Technology Development: Improves the characteristics and performance of a technology àlowers unit cost à increases sales àvolume/capacity increases Market Incentives: increasing subsidies for a new technology à competitiveness increases à volume increases, or, increasing volumes lead to economies of scale effects à lower unit cost Volume Increase: Learning-by-doing, learning-by-using, or more experience, reduces the costs à 2 approaches to bring costs down: technology push & market pull
7 Price difference influences adoption of a new technology Binary choice model between A and B (from Lect #3) If e.g. price were the only injluencing factor for choice: Probability to purchase the new product A is P (logit probability) Probability of energy preference P = B cheaper than A 1 1+ exp(c A C B ) /σ 100% 80% 60% 40% 20% A cheaper than B Technology A Technology B 0% Price difference ( /MWh)
8 Historical evidence: unit price of a product drops when the volume increases On average a 15% cost drop for each doubling of the cumulative production

9
 : Universal")
10 Learning or experience curve for predicting future costs of a technology Cost reduction versus volume can be mathematically described through a socalled learning or experience curve If a known point available (0) : Universal value p=85%
11 Observation on progress ratios for energy technologies
12
13
14 Why different progress ratios? Cost of technology (c) drops with increasing volume (x), steepness of cost reduction (α) depends on design complexity (d) Energy technology with no or less moving parts should basically have good chance for rapid cost reduction (cf transitor or solar cell) Unit cost drops by (1-PR)% when cumulative production doubles Role of design complexity in technology improvement, James McNerney, J. Doyne Farmer, Sidney Redner, Jessika E. Trancik, PNAS,
15 Applications of the learning curve MWs, or volume needed for reaching costbreakeven /$, or (learning) investments needed for cost breakthrough (e.g. grid parity) Years, or time needed for breakthrough Policies and strategies to commercialize new technologies
16 Solving the cumulative capacity needed for cost breakeven Cost of new technology c(v)=c V : Cost of new technology < cost of old technology Set target cost c=c br àsolve V br! =!"!!"! ="β#!!"!! =!!"!!!/!!

17 Cost breakeven point c V c V = 0 V 0 α
18 Learning investment
19 Solving the learning investment Learning investment = support needed before costbreakeven reached Area under the learning curve from the starting point (V 0 ) to cost-breakeven point (V br )
20 Solving the time needed for a cost breakthrough Assume that volume grows as à Subsitute V in c V with V(t) and solve c(t) à Solve t at point c t =c br à
21 Breakthrough time (t br )
22 Strategic application: effect of early cost-drop e.g. through large R&D effort Reference (target/initial cost=0.2):+40%/yr growthà36 years to breakeven R&D effort to drop initial cost (affects the C br /C 0 ratio:) 50% early cost drop à 10 years; 30%à 20 years ; 20% market growth and 30% cost drop à 20 years Years to cost breakthrough % C Peter % Lund % target to initial cost
23 Linear versus nonlinear learning curves (speeding-up the penetration) Technology jump
 Examples on how policies (both RTD and market deployment) may influence the costs of the new technology (a-f) a: classical learning curve b: strong R&D effort c: too high subsidies, low")
24 Linking policies and strategies to the learning curves Policy measures improve the economic competitiveness of the new technologies (C) and influence the penetration rate (β) which leads to increased volume (V) Examples on how policies (both RTD and market deployment) may influence the costs of the new technology (a-f) a: classical learning curve b: strong R&D effort c: too high subsidies, low competition, bottlenecks d: c+ measures e: demand>>supply, oversidized f: e+ measures
25 Economics of new energy technologies Different methods to estimate the economics, e.g. Payback (time) Internal Rate of Return (IRR) Net Present Value (NPV) Levelized cost of energy (LCOE) Each indicator reflect on different aspects of the investment Total system cost (includes all turn-key costs) >> Core technology cost (e.g. solar panel) The cost of produced electricity of an energy technology differs case by case (Δ could be even 100%!)
26 LCOE LCOE (levelized cost of energy) gives the cost of electricity produced ($/MWh). Accounts for all expected lifetime costs (including construction, financing, fuel, maintenance, taxes, insurance and incentives), which are then divided by the system s lifetime expected power output (MWh). All cost and benefit estimates are adjusted for inflation and discounted to account for the time-value of money.
27 Simplified LCOE Simplified LCOE (levelized cost of energy) Assuming equal energy production and running costs for each year d=discount factor r= real interest rate E=yearly energy produced t life =economic life-time of the investment
28 Compare slcoe two technologies; sensitivity analysis against economic parameters LCOE calculator: Capacity factor 85% Investment 6000/kW Fixed O&M 30/kW Variable O&M c/kwh Capacity factor 15-30% Investment 1000/kW Fixed O&M 10/kW Variable O&M 0.1 c/kwh

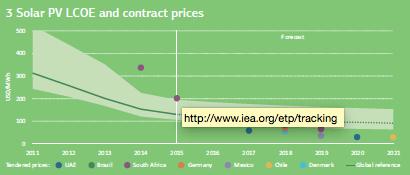


29 Status of costs of new technologies Source:IEA 2016,2017


30 Introduction to Clean Energy Project Analysis-RETSCREEN Clean Energy Project Analysis Course Clean Energy Project Analysis is a case-study based course for professionals & university students who want to learn how to better analyse the technical & financial viability of possible clean energy projects Minister of Natural Resources Canada


31 Total Cost of an Energy Generating or Consuming System Total cost purchase cost Total cost = purchase cost + annual fuel and O&M costs + major overhaul costs + decommissioning costs + financing costs + etc. Minister of Natural Resources Canada
32 Accuracy vs. Investment Cost Dilemma $100 to $1,000,000!


33 Energy Project Implementation Process Pre-feasibility Analysis Feasibility Analysis Significant barrier Clean Energy projects not being routinely considered up-front! Development & Engineering Construction & Commissioning Minister of Natural Resources Canada


 Cumulative Cashflow 0 1 2")


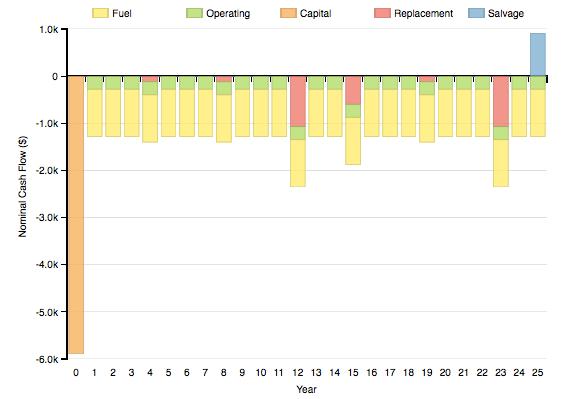
34 Cashflow Calculations: What does RETScreen do? Cash Inflows Fuel Savings O&M Savings Periodic Savings Incentives Production Credits GHG Credits Cash Outflows Equity Investment Annual Debt Payments O&M Payments Periodic Costs thousands of $ Annual Cashflows Year 50,000,000 40,000,000 30,000,000 $ 20,000,000 10,000,000 0 (10,000,000) (20,000,000) Cumulative Cashflow Indicators Time (yr) Net Present Value Simple Payback IRR Debt Service Coverage Etc. Years Minister of Natural Resources Canada

35 Key (Output) Indicators of Financial Viability Simple Payback Net Present Value (NPV) Internal Rate of Return (IRR & ROI) Meaning # of years to recoup additional costs from annual savings Total value of project in today s dollars Interest yield of project during its lifetime Example 3 year simple payback $1.5 million NPV 17 % IRR Criteria Payback < n years Positive indicates profitable project IRR > hurdle rate Comment Misleading Ignores financing & long-term cashflows Use when cashflow is tight Good measure User must specify discount rate Can be fooled when cashflow goes positive-negativepositive Minister of Natural Resources Canada

36 Comparison of Indicators: Remote Telecommunications Example Simple Payback Net Present Value (NPV) Internal Rate of Return (IRR & ROI) PV vs genset* 9 years $4,800 22% Decision Genset PV PV * Discount rate of 12%; 50% debt financed over 15 years at 7% interest rate Minister of Natural Resources Canada


37 Indicators of Financial Viability: Remote Telecommunications Example RETScreen provides a range of indicators and a cumulative cash flow graph for the project 3.8 years to positive cash flow Minister of Natural Resources Canada


38 Wind Energy Project Analysis Clean Energy Project Analysis Course Utility-Scale Turbine Photo Credit: Nordex AG Minister of Natural Resources Canada


39 Elements of Wind Energy Projects Wind resource assessment Environmental assessment Regulatory approval Design Construction Roads Transmission line Substations Installing a 40-m Meteorological Mast, Quebec, Canada Photo Credit: GPCo Inc. Substation, California, USA Photo Credit: Warren Gretz/NREL Pix
40 Wind Energy System Costs Windfarms $1,500/kW installed O&M: $0.01/kWh Selling price: $0.04-$0.10/kWh Feasibility Study Development Engineering Single turbines & isolated-grid Higher costs (more project specizic) Turbines Balance of plant Feasibility study, development & engineering represent a higher portion of costs 0% 20% 40% 60% 80% Portion of Installed Costs Expect one major component replacement of 20 to 25% of initial costs Rotor blades or gearbox
 Constraints and criteria! Environmental acceptability! Acceptance of local population!")
41 Wind Energy Project Considerations Good wind resource dramatically reduces cost of production Good resource assessment is a worthwhile investment Additional sources of revenue Government/utility production credits or Greenpower rates Sales of emissions reduction credits (ERC s) Constraints and criteria! Environmental acceptability! Acceptance of local population! Grid interconnection and transmission capacity Financing, interest rates, currency exchange rates Turbine of the Le Nordais Windfarm, Quebec, Canada


42 Introduction to HOMER renewable power simulation tool
, ca 3000 kwh/yr")
43 HOMER Demonstration Helsinki (60 N), ca 3000 kwh/yr houshold


44 HOMER Demonstration-results
45 Your Work # 4 Home work from Lecture 4 Get familiar with the LCOE calculator as you may need it in the Group Work Take a look into RETSCREEN tool (free, downloadable) In preparing for Lecture 5 (technologies) The second part of the course will focus on technologies, starting with wind and wave energy