The Future of Water Sustainability in Illinois
|
|
|
- Rosamond Robbins
- 5 years ago
- Views:
Transcription

1 The Future of Water Sustainability in Illinois The Institute for Regulatory Policy Studies Department of Economics, Illinois State University October 14, 2010 Paul G. Foran Vice President and Counsel, Regulatory Programs American Water

2 American Water Operations Heritage dates back to 1886 Largest U.S. water services provider Serves approximately 16 million people in more than 1,600 communities Operations in 35 states and two Canadian provinces More than 7,000 employees 2

3 Facts & Figures (owned Assets) More than 350 individual water systems 49,000 miles of mains and collection pipes 80 surface water treatment plants 600 groundwater treatment plants 1,200 groundwater wells 50 wastewater treatment plants 3
4 Water/Wastewater Industry Challenges CHALLENGE OF CAPITAL ATTRACTION: Infrastructure Replacement and Compliance with increasing SDWA & CWA Quality Requirements USEPA Clean Water and Drinking Water GAP analysis Drinking Water: $154 billion - $446 billion through 2019 (pt.est. = $274 billion. Clean Water: $331 Billion - $450 billion through 2019 (pt. est $390 billion. Total: $485 billion $896 billion through 2019 (pt. est = $662 billion) February 2009 USEPA Drinking Water Infrastructure Needs Survey $334.8 Billion over 20 years 2005 Estimate: $276 Billion 2002 Estimate: $154 Billion Current drinking water cost estimates are more than 100% greater than 2002 estimates. 20 year water/wastewater infrastructure costs could exceed $1 trillion 4
5 No Utility Sector is More Capital Intensive Than the Water Industry Source: AUS Utility Reports May

 (Based on")

 Source: EPA, Drinking and")

6 The US Water Industry remains highly fragmented and with limited Investor ownership Water Percentage of Drinking Water Systems and Population served by Size Class (1) (Based on 51,988 total water systems in US) Investor Owned 16% Public & Other 84% Investor Owned 2% Wastewater Public & Other 98% System Size by Population Served (1) Source: EPA, Drinking and Ground Water Statistics, The majority of water systems in the US are owned by capital constrained entities 6
7 Challenge of Fragmentation and Lack of Economies of Scale The Potential for Consolidation is Significant 3,200 Electric; 1,600 Gas 93% of small systems (<10,000 people) within 5 miles of another system 100% within 20 miles 7
8 Safe Drinking Water Act Regulatory Update A Moving Target The USEPA has drinking water regulations for more than 90 contaminants. The USEPA publishes a Contaminant Candidate List (CCL) to screen possible contaminants for future regulatory decision. The latest list (CCL3) was finalized in October 2009 and includes 104 chemicals or chemical groups and 12 microbiological contaminants. The list includes chemicals used in commerce, pesticides, biological toxins, disinfection byproducts, and waterborne pathogens. 8
9 Sustainability and Integrated Water Resource Management Management of the whole hydrologic cycle to achieve a coherent set of water resource policies and uses that balances all reasonable social, environmental, and economic needs in a sustainable way. Sustainability meeting the needs of the present without compromising the ability of future generations to meet their own needs. World Commission on Environment & Development 9
10 Some Principles of IWRM? Recognize that fresh water is a finite but renewable and vulnerable resource, essential to sustain life, development and the environment Manage water resources based on watersheds and needs of relevant stakeholders Preserve water sources and use water wisely Allocate water equitably based on input from all relevant stakeholders 10
11 Integrated Water Resource Management & Sustainability Cross Sector Integration/Interdependencies Water Supply Source of Supply Constraints Wastewater Management Conservation & Reuse Groundwater Infiltration/Recharge Watershed & Ecosystem Protection Management of Storm Water & Runoff Etc Energy, Transportation, Telecommunications Global Climate Change Security Regulatory Quality Quantity Economic Customer Needs/Competing Uses Agriculture Industry Human Consumption Habitat/Species Protection Statutory/Jurisdictional Issues Uncoordinated, Conflicting Statutes Overlapping/Limited/Conflicting Jurisdictions For water service providers, providing sustainable, high-quality, reliable, cost-effective service increasingly requires a more holistic approach to water resource management. Water reuse/recycling is only one element in a more integrated approach. 11
12 IWRM: Cross Sector Integration/Interdependencies An Integrated or Holistic approach to water resource management and sustainability is a broader issue than just the water industry. Global Climate Change Water/Energy Greenhouse Gases & Water Supply Implications Security Water Sector Interdependencies 12
13 How Much Electricity Does the Water Industry Use? Drinking water and wastewater consume: 3% of domestic electricity 1 7% of worldwide electricity 19% of California electricity 2 Energy is the largest non labor O&M cost driver: For AW system wide, approximately 30% of production related expenses Water utility energy use varies widely from 0.25 to 3.5 kwh per 1,000 gallons of drinking water produced and delivered 3 The median 50% of water utilities serving populations >10,000 had electricity use between 1.0 and 2.5 kwh/1,000 gallons 3 1. Electric Power Research Institute (Burton 1996) 2. Energy Down the Drain: The Hidden Costs of California s Water Supply 3. AwwaRF Energy Index Development for Benchmarking Water and Wastewater Utilities 13
14 Emerging Technologies Use More Energy New regulations are increasing the use of the following, energy intensive treatment processes: Added Technology Additional Energy UV Disinfection kilowatt hours/million gallons Ozone 170 kilowatt hours/million gallons Membranes Nano and RO 1,800 kilowatt hours/million gallons Ultrafiltration 1,000 kilowatt hours/million gallons Microfiltration 100 kilowatt hours/million gallons 14
15 Inventory of AW s 2007 Green House Gas Emissions Emissions Source Direct Emissions 1. Emissions in metric tons CO 2 e includes CO 2, N 2 O and methane emissions 2. Emissions from flared methane gas and HVAC were both <0.5% Emissions (tons Carbon Dioxide Equivalents) 1 Emissions (%) Stationary combustion: boilers, generators, 35, % Mobile sources: fleet 27, % Process/fugitive: biogas leakage from WWTPs % Refrigerant: leakage from A/C units 2 1, % Indirect Emissions Electricity 824, % Total 888, % 15

16 Pumping Accounts for the Biggest Energy Use One gallon of water weighs approximately 8.3 pounds! 85-99% of water treatment plant electric consumption goes to pumping. Raw water & well pumps High service pumps Filter backwash pumps Distribution system booster pumps 16

17 One Approach Climate Leaders A voluntary US EPA partnership with U.S. companies to develop long-term, comprehensive climate change strategies Inventory corporate GHG emissions Set corporate-wide GHG reduction goals Measure and report GHG emissions to the EPA For more information and a list of Climate Leaders partners, please visit American Water was accepted into the Climate Leaders Partnership on January 19,
18 Barriers to Integrated Water Resource Management Fragmented local governmental jurisdictions River systems extend across State boundaries, and individual States often have differing river quality limits Lack of national / regional coordination of resource management issues Limited bridges across drinking water (SDWA), wastewater / storm water (CWA) regulations, and other federal / state laws Insufficient resources for effective regional planning programs Existing regulatory environment / framework impacts the degree of private sector involvement 18
19 19


20 Piasa Creek Watershed Project Background 16 million gallons per day water treatment facility in Alton, Illinois to replace 100 year old facility susceptible to flooding Old plant had site specific exemption as part of National Pollutant Discharge Elimination System (NPDES) for direct discharge of residual solids and backwash water to Mississippi IEPA determined that existing site specific exemption and NPDES did not apply to the new plant 20
21 Piasa Creek Watershed Project Conventional Solution: Required construction of landfills and trucking solids over historic and scenic byways IWRM Solution: Working with local officials, community groups and state environmental agencies, a solution was reached that allowed the new plant to discharge into the Mississippi, but achieved far greater benefits than the conventional approach to disposing of residuals 21
 the discharge of the new treatment plant by 2010.")
22 Piasa Creek Watershed Project Implementation Plan Benefits $4 million investment in watershed protection & restoration results in net savings of over $3 million in capital and operating costs Reduces sediment in watershed two times (6,700 tons per year) the discharge of the new treatment plant by Reduces truck travel over historic, scenic byways, air pollution, landfill space In Piasa watershed: reduced erosion, pollution, improved water quality, storm water control, fish and wildlife habitat, stream bank stabilization Land acquisition and conservation easements Wetlands restoration Educational programs Projected benefits ahead of schedule and greater than expected 22

23 23

24 Reuse of Treated Wastewater Water reuse in the U.S. is a large and growing practice. Nationally, an estimated 1.7 billion gallons per day is reused. Reclaimed water use on a volume basis is growing an estimated 15% per year. In 2002, Florida reclaimed 584 mgd. California ranked a close second with 525 mgd used every day. Florida has an official goal of reclaiming 1 billion gallons per day by the year

25 Example: Membrane Bioreactors American Water operates nearly 30 membrane bioreactors (MBRs), to treat wastewater and provide the potential for water reuse. MBR Advantages: - Increased Reliability - High Quality Effluent - Free of Suspended Solids - Increased Pathogen Removal - Easily Automated - Reduced sludge - Reduced Footprint American Water has experience with different membrane configurations (flat sheet and immersed membranes) and cost models. Solaire, Battery Park Wrentham Mall New Jersey Antham Foxboro 25

26 MBR Technology 26

27 Case Study: The Solaire Green Building Battery Park City, NY Project Location: New York, NY The project provides wastewater treatment and recycling to a new 293-unit apartment building Treated effluent is reused for toilets, make-up cooling tower water, and landscape irrigation The treatment plant utilizes an advanced membrane bioreactor system to separate water from the waste, providing a high quality effluent Performance: 53% reduction in wastewater discharge volume 40% reduction in potable water consumption Treatment technologies include: Submerged, hollow fiber micro-filtration membranes to remove suspended solids Ultra-violet light to kill pathogenic bacteria 27
28 Case Study: Anthem Water Campus / Arizona American Water Treated wastewater discharge is recycled as irrigation water for nearby golf courses and common lawn areas. During spring and summer, nearly all wastewater discharge is recycled. During winter months, water not used for irrigation is directed to groundwater recharge facility. Facilities include: 7 mgd Potable water treatment plant 3.5 mgd Wastewater treatment plant treats wastewater to irrigation and recharge standards. Technologies (WW treatment): Activated Sludge, Ultrafiltration membrane system 28
29 Sewer Mining vs. Conventional Reuse Planning Conventional Reuse Sewer Mining Reduced Pumping + Tailored Treatment = Enhanced Sustainability 29

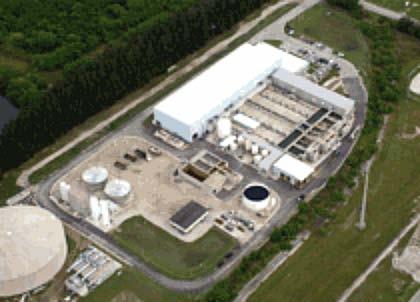


30 Co-Location of Power and Desalination Facilities Tampa Bay 30


31 And California too Moss Landing, Monterey Carlsbad Desalination Plant 31