Discovery Farms Minnesota N and P, what is happened in Farm Fields? Jerome Lensing January 9, 10, 11, 2018 AgVise Labs
|
|
|
- Albert Rich
- 5 years ago
- Views:
Transcription


1 Discovery Farms Minnesota N and P, what is happened in Farm Fields? Jerome Lensing January 9, 10, 11, 2018 AgVise Labs Jerome.lensing@hotmail.com


2 Discovery Farms is a farmer led water quality research and educational program, providing credible research, and communicates results


3 WHY WAS MAWRC FORMED? To show that we can have highly productive farmland and clean water.


4 Discovery Farms has one of the largest edge of field datasest with diverse farm systems and locations. 24 Farms 45 Fields 127 Surface Site Years 83 Tile Site Years
5 2 sites with lower precipitation 3 sites tile only 3 sites surface only 7 sites surface and tile
6 Discovery Farms has a large dataset with diverse farm systems and locations. Data collected from No tile, pattern and random tile at different spacing and depths Drainage areas from 5 to 650 acres Field slopes >1% to 9% Well drained to poorly drained soils Dairy, beef, swine, and grain operations Crops range from corn, soybean, alfalfa, sugar beets, wheat and pasture 24 Farms 45 Fields 127 Surface Site Years 83 Tile Site Years

7 Discovery Farms Provides Credible Edge-of-Field Research Typical Installation with both surface and tile


")
8 Edge-of-field surface runoff and tile drainage data is collected 365 days a year Weather Soil Flow Sediment Nitrogen Phosphorus Flow Volume X Concentration (ppm) = Loss (lb/ac)

9 Tile drainage is not a new technology but societal values have changed. A reflection of societal values 1900 s water removal 2000 s balancing production and water quality concerns Photo: Geneva Historical Society Production Environment


10 Tile drainage is extensive in parts of WI and Minnesota.
 or climate")
11 The problem with talking about tile drainage It can be polarizing and controversial. Where does sediment come from fields, river banks, or ravines? Mostly from river banks and ravines Increased river flow is accelerating bank erosion Consequence of tile drainage, land use (towns/ag land) or climate change?
12 Artificial drainage has benefits and water quality challenges. Drainage can enhance agricultural production, transportation, and economic development Drainage can increase risk of sediment and nutrient movement to surface waters Chesapeake Bay - Hypoxia Gulf of Mexico - Hypoxia Lake Erie City of Toledo Des Moines Water Works


13 Tile systems drain only a portion of the soil water - gravitational water.
14 Cement Tile Cement Tile With Open Intakes Cement Tile Clay Tile Clay Tile With Identified Collapse Clay Tile With Identified Collapse Cement Tile With Identified Collapse Tile sites that had higher concentrations of sediment had older cement or clay tile systems, tile blowouts, or surface intakes. Corrugated Plastic Tile
 25 20 15 10 5 0 Surface Runoff Tile Flow")

15 The timing and intensity of surface runoff and tile flow is much different. Annual Surface Runoff or Tile Flow (in) Surface Runoff Tile Flow Category Surface Runoff Tile Flow Annual Range (inches) 1.3 to to 6.1 Average annual days of flow Average intensity of flow (inches per day of flow)

16 There is typically more tile flow than surface runoff on an annual basis.
17 Most of the tile flow occurred in May and June at the Norman and Wilkin County sites. Average Monthly Tile Flow (in) Norman & Wilkin JAN FEB MAR APR MAY JUN JUL AUG SEP OCT NOV DEC
18 Lower amounts of tile flow on an annual basis, but timing and intensity much different for surface vs tile. Annual Runoff or Flow (in) All DF Surface Sites All DF Tile Sites Norman/Wilkin - tile Norman Wilkin Category Tile Flow Surface Runoff Annual Range (inches) 1.9 to to 4.3 Average annual days of flow Average intensity of flow (inches per day of flow)
19 Most of the tile flow occurred in May and June at the Norman and Wilkin County sites. Average Monthly Tile Flow (in) Norman & Wilkin JAN FEB MAR APR MAY JUN JUL AUG SEP OCT NOV DEC
20 The amount of annual precipitation has a large influence on the amount of tile flow, but not surface runoff. 25 Surface Runoff 25 Tile Flow Annual Surface Runoff (inches) r 2 = 0.04 Annual Tile Flow (inches) r 2 = Annual Precipitation (inches) Annual Precipitation (inches)
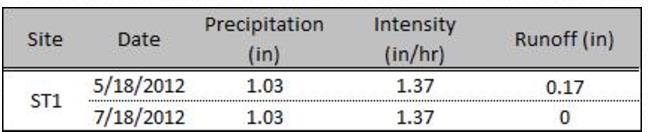
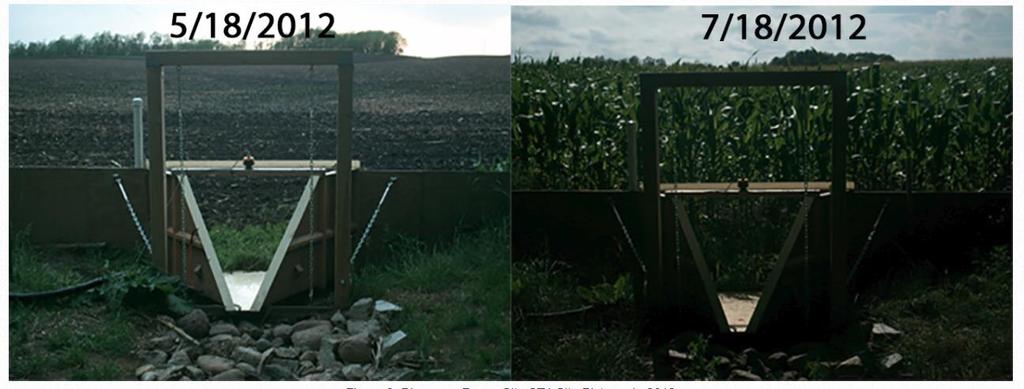
21 Timing of precipitation matters for surface runoff.

22 Intensity of precipitation matters for surface runoff.

23 Soil Loss in perspective - a 5 gallon pail will hold a about 45 pounds of soil consider that in pounds/acre that would be similar to spreading that amount over an area of a football field.
24 Soil loss mostly occurs with surface runoff Annual Soil Loss (lb/ac) Surface Runoff Tile Flow Typical Ranges: Surface Runoff: 28 to 307 lb/ac Tile Flow: 3 to 21 lb/ac Typical Ranges Buckets: Surface Runoff: to Tile Flow:.06 to.47

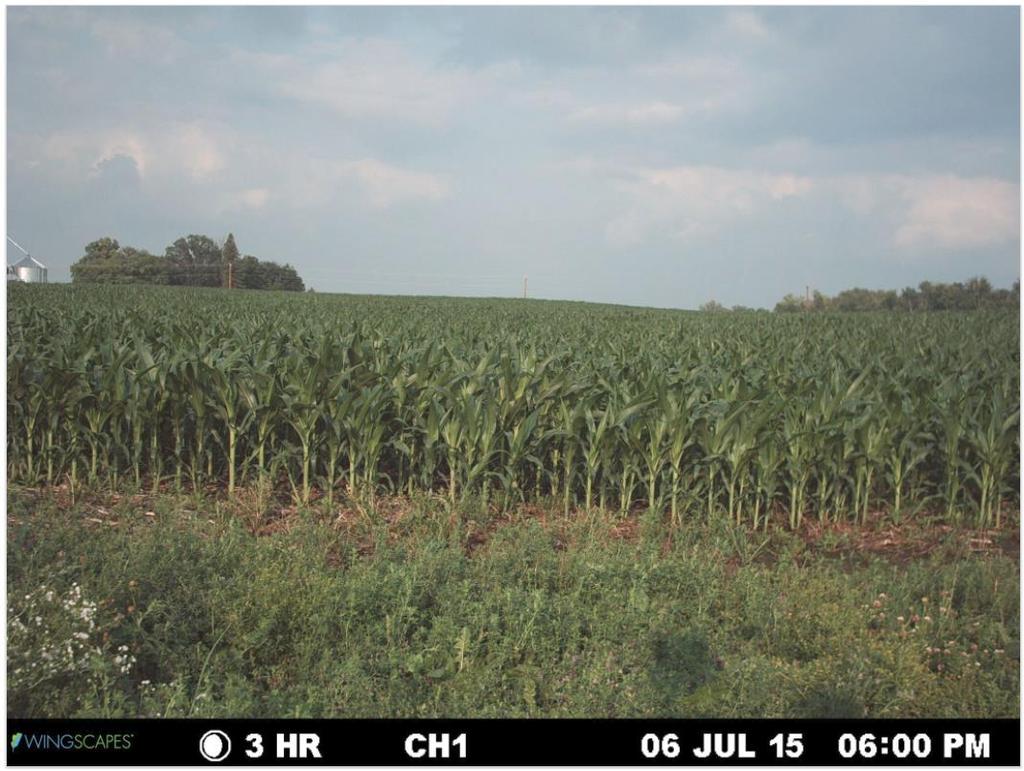
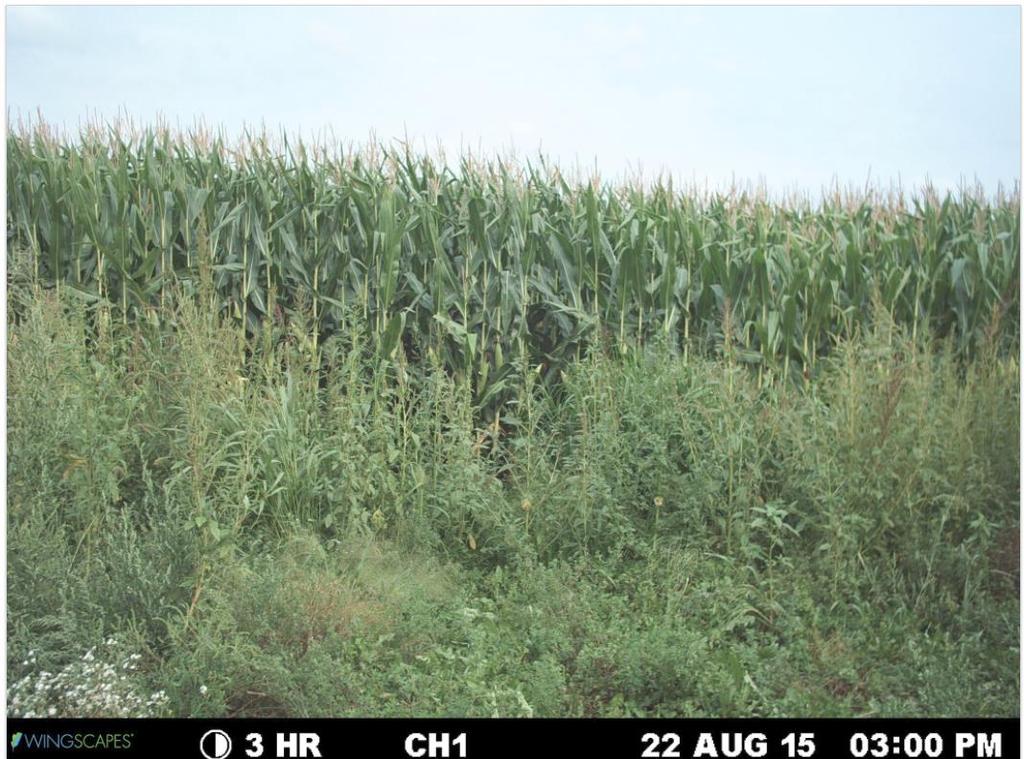
25 Soil loss mainly occurs in April, May, and June. April, May, and June: Combination of vulnerable fields and intense storm events. Reduce soil losses by providing protection during this critical time period. Level of protection needed is site specific.


26 Level of soil protection needed is site specific. How do we know whether we have enough protection? Take a drive, watch where water flows Look for: Sedimentation in corners, Soil covered plants in June Use treatment practices for concentrated erosion to slow water and protect soil
27 Get screened! There is no zero with any land use or ag management practices. Source: Interpreting Nitrate Concentration in Tile Drainage Water, Purdue Extension, Purdue University
 80 70 60 50 40 30 20 10 0 Surface Runoff Tile Flow Typical Ranges: Surface Runoff: 1.84 to 8.")
28 Nitrogen loss mainly occurs with tile flow and nearly all of the nitrogen in tile systems is in the nitrate form. Annual Total Nitrogen Loss (lb/ac) Surface Runoff Tile Flow Typical Ranges: Surface Runoff: 1.84 to 8.79 lb/ac Tile Flow: 6.76 to lb/ac
29 Tile nitrate concentrations in RRV have been similar to other tile monitoring sites. Lower losses are because of decreased tile flow. 120 Nitrate-N Sample Concentration (mg/l) All DF Tile Samples (n = 1367) Norman (n = 77) Wilkin (n = 61)
30 Annual Nitrate and Total Nitrogen Loss Lbs/a No Manure vs. Manure sites Surface Nitrate N.: No Manure: 0.0 to 0.6 #/a Manure: 0.3 to 1.8 #/a Surface Total Nitrogen.: No Manure: 0.4 to 3.5 #/a Manure: 2.7 to 11.2 #/a Tile Nitrate N.: No Manure: 2.1 to 10.6 #/a Manure: 8.7 to 41.1 #/a Tile Total Nitrogen: No Manure: 2.3 to 10.8 #/a Manure: 13.6 to 44.3 #/a
31 Annual Nitrate and Total Nitrogen Flow Weighted Mean Concentration No Manure and Manure sites Surface Annual TN Flow Weighted Conc.: No Manure: 2.09 to 6.05 mg/l Manure: 5.42 to mg/l Tile Annual TN Flow Weighted Conc.: No Manure: to mg/l Manure: to mg/l
32 The amount of nitrogen loss in tile systems is dependent on the amount of flow. 100 Annual Tile Nitrate Loss (lb/ac) y = 4.05x (r 2 =0.83) Annual Tile Flow (in)

33 Timing and rate of nitrogen applications influence loss. Oct 16, 2012: Soil Temperature 50 degrees F
34 Nitrate nitrogen concentrations in surface runoff at one Discovery Farm location in 2015 Urea had been broadcast to the soil surface of harvested soybean stubble in late November of 2014 after the soil temperature had dropped below 50 F. No fall incorporation of the urea.
35 Nitrate nitrogen concentrations in surface runoff at one Discovery Farm location in 2015 Shallow incorporation resulted in the nitrate nitrogen produced from the breakdown of urea remaining close to the soil surface. Surface runoff caused by spring rains in May and June then carried a portion of the nitrogen away, resulting in potential economic loss for the farmer and potential environmental concerns.

36 Phosphorus loss mainly occurs with surface runoff, but a few tile sites have had elevated losses. Annual Total Phosphorus Loss (lb/ac) Surface Runoff Tile Flow Typical Ranges: Surface Runoff: 0.45 to 1.89 lb/ac Tile Flow: 0.03 to 0.24 lb/ac


37 There are Two Time Periods for P Loss Snowmelt and Spring Runoff Feb/Mar: 44% Apr/May/Jun: 48%
38 Tile phosphorus concentrations in the RRV have been much lower than other tile monitoring sites. Lower losses are because of decreased concentrations and tile flow. Total Phosphorus Sample Concentration (mg/l) All DF Tile Samples (n = 1367) Norman (n = 77) Wilkin (n = 61)
39 Annual Soluble and Total Phosphorus Flow Weighted Mean Concentration No Manure and Manure sites Surface Annual TP Flow Weighted Conc.: No Manure: 0.69 to 1.62 mg/l Manure: 1.17 to 3.52mg/l Tile Annual TP Flow Weighted Conc.: No Manure: 0.02 to 0.28 mg/l Manure: 0.09 to 0.54 mg/l
40 Annual Dissolved and Total Phosphorus Loss Lbs/a No Manure vs. Manure sites Surface Dissolved P.: No Manure: 0.09 to 0.53 #/a Manure: 0.23 to 1.06 #/a Surface Total P.: No Manure: 0.12 to 1.05 #/a Manure: 0.52 to 2.18 #/a Tile Dissolved P.: No Manure: 0.00 to 0.12 #/a Manure: 0.05 to 0.51 #/a Tile Total P.: No Manure: 0.01 to 0.21 #/a Manure: 0.07 to 0.76 #/a
41 Controlling soil losses is JUST the first step to managing phosphorus loss. Till median: 205 lb/ac No-till median: 65 lb/ac Rank sum p value: Till median: 0.9 lb/ac No-till median: 1.2 lb/ac Rank sum p value: Till median: 0.3 lb/ac No-till median: 0.8 lb/ac Rank sum p value: <0.001 Till Count: 53; No-till Count: 37
42 During the Growing Season Phosphorus Loss is Driven by Soil Loss Surface fertilizer applications just prior to runoff
43 High soil test P levels in MN, ND, SD are not typical. Soil Samples with Bray P >50 ppm (%) Georgia Florida New Jersey North Carolina Delaware South Carolina Alabama Pennsylvania Virginia Maryland New York Michigan Wisconsin Indiana Colorado Ohio Iowa Illinois Kentucky Nebraska Oklahoma Mississippi Tennessee Arkansas Kansas Minnesota Texas Louisiana Missouri South Dakota Montana North Dakota SD ND
44 Phosphorus loss in tile systems is influenced by sediment concentrations and soil test phosphorus levels.
45 Managing soil test phosphorus levels and stratification is just as important. 4.0 Study Period Dissolved P FWMC (mg/l) Surface Runoff Sites Tile Drainage Sites r 2 =0. 68 r 2 = Soil Test P (ppm); 0-1 inches
46 We have been collecting edge-of-field water quality data in MN and WI for years, what do we know? Losses are different than expectations Every farm and every management system has an area where environmental impact could be improved There are no silver bullet solutions

47 What changes have been made since the start of the program by cooperators Increased manure testing and timing and rates of manure applications Changes in tillage practices and amount of tillage Removal of intakes or installation of equipment that reduces the amount of sediment into intakes
48 Keys to reduce risk of soil and nutrient losses. Control soil loss by using appropriate level of soil protection and update and maintain tile systems. Consider timing and placement of application and check soil test phosphorus levels to reduce dissolved phosphorus. Consider timing and rate of application to reduce nitrogen loss and know your tile nitrate levels.
49


50 Nitrogen Conference 4 SW, 4.5 NM,.5 PM Nutrient Conference 1 PM, 2 SW, 6 MN.


51 Thanks to our sponsors!


52 Have a very profitable 2018