Improved Software Tools for Regional & Local Integrated Land Use/Transportation Planning in California (funded by Caltrans)
|
|
|
- Darleen Bennett
- 5 years ago
- Views:
Transcription
1 Improved Software Tools for Regional & Local Integrated Land Use/Transportation Planning in California (funded by Caltrans) Training Session Tuesday June 26, :00 to 12 noon AGENDA Opening: Introductions & Opening Remarks Jerry Walters, Fehr & Peers Participant selfintroductions. Project team introductions. Overview & Goals of Training Session.
2 AGENDA 1. Review of Ds Modules, Purpose and Derivation 2. Travel Model Swap Testing and Calibration Process 3. Land Use Data Buffering, Test Results, Post- Processor Formulation; Forecast Demo 4. Applying the Module 5. Other Tool Applications (UPlan, GIS tools) 6. Next Steps 2


3 Model Improvement Process RTP Guidance Model Development / Implementation* RTP Review Data Analysis SACOG Fresno COG Rail Corridors Statistical Ds Modules Full Models SACOG SANDAG Rail corridors Small MPOs: SJ Valley No Sac Valley Central Coast Inland Empire Sensitivity Tests Travel Demand Model Post- Processor * Fresno, Tulare, Kern, San Joaquin/ Stanislaus/ Merced, San Luis Obispo, Butte, Shasta


4 Consistent Estimation of Land Use / Travel Effects for SCS and RTP Household Travel Survey Land Use D Characteristics SCS Statistical Relationships: Ds >> Vehicle Ownership Ds >> Vehicle Trips Ds >> VMT URBAN FORECASTING AND PLANNING Transport Networks Parcel and Zonal Attributes Population Attributes Accessibility Statistical D Modules Population and Long Term Choice Simulator VO, VT, VMT Person Day Simulator HH/Person day-tour-trip list REPORTING AND QUERY SUBSYSTEM AB HOUSEHOLD TRAVEL DEMAND SIMULATOR Special Generators (eg, airport ) External trips Trip Aggregator Commercial movements OD Matrices D s Adjustment Network Using VT traffic Module assignment RTP TRANSPORT MODEL SYSTEM D s Adjustment Using VMT Module Network performance (skims)


5 Ds Module based on NHTS Survey Data County Total Households Monterey County 167 San Benito County 16 San Luis Obispo County 173 Santa Barbara County 201 Santa Cruz County 178 Imperial County 48 Riverside County 802 San Bernardino County 764 Butte County 185 Glenn County 17 Shasta County 176 Tehama County 61 Fresno County 381 Kern County 309 Kings County 63 Madera County 64 Merced County 89 San Joaquin County 306 Stanislaus County 262 Tulare County 173 TOTAL 4,435


6 Sequential Ds Analysis Module Flow Charts Two-Step Ds Analysis Module Household Vehicle Trip Probability Form: Binary Logistic D Variables: Density Diversity Distance to Transit Three-Step Ds Analysis Module Household Vehicle Trip Probability Form: Binary Logistic D Variables: Density Diversity Distance to Transit Daily Household VMT Form: Linear Regression D Variables: Density Diversity Design Distance to Transit Household Vehicle Trip Generation Form: Linear Regression D Variables: Density Diversity Destinations Vehicle Trip Length Form: Linear Regression D Variables: Density Diversity Design Destinations Distance to Transit Daily Household VMT

7 Two-Step Ds Analysis Module: Effect of D Variables on VMT Density Developed acres* Population per residential acre* Record in urban area Total jobs* Minor commercial acres* Diversity Jobs per household* Land use entropy* Design Roadway density* Distance to Transit Nearest rail station VT Probability VMT [ * ] = Based on ½-mile buffer. Note: The "+" symbol denotes positive effect; "-" symbol denotes negative effect. One symbol denotes <10% of total absolute model effect; two symbols denote between 10% and 20%; three symbols denote >20%.

8 Three-Step Ds Analysis Module: Effect of D Variables on VMT Density Developed acres* Population per residential acre* Home-end household density* Home-end employment acres* Home-end in urban core Non-home-end household density* Non-home-end minor commercial jobs* Diversity Design Jobs per household* Home-end job entropy* Non-home-end job mix* Non-home end job entropy* Non-home-end land use entropy* Non-home-end road and intersection density* Home-end road and intersection density* Destination Accessibility Transit time based retail accessibility Distance based attractions accessibility Distance to Transit Nearest rail station Household Vehicle Trip Probability Household Vehicle Trip Generation Vehicle Trip Length [ * ] = Based on ½-mile buffer. Note: The "+" symbol denotes positive effect; "-" symbol denotes negative effect. One symbol denotes <10% of total absolute model effect; two symbols denote between 10% and 20%; three symbols denote >20%.
9
10 Ds Analysis Module Calibration Approach Statistical D Models Regional Travel Models Sensitivity Tests e.g. changes in Density, Diversity, Design, Expected Values Model Estimates Statistical Comparison Calibration Equations for Post-Processor
11 Travel Model Swap Testing and Calibration Process - Part 1 Base year land use modified to create second scenario with new land uses in selected zones known as the Swap land use Area types with new land uses substituted for some zones. These have measurable changes in the D variables Some zones kept same land use but density increased Generally, though not always, zonal swaps expected to reduce vmt Networks kept identical for both land use scenarios
12 Travel Model Swap Testing and Calibration Process - Part 2 Swap scenarios were analyzed BOTH With the MPO regional model and With the Ds Analysis Module developed for this study While land use scenarios are the same, the Ds Analysis Module is sensitive to more variables Both models are expected to show sensitivity to the land use changes. The Ds Analysis Module should be more sensitive
13 Travel Model Swap Testing and Calibration Process Part 3 Difference in VMT results (home-based VMT) were calculated by TAZ for both the TDF model and the Ds Analysis Module (Base VMT Swap VMT) The DoD was regressed against the changes in the D variables between the Base and Swap. Next Slide illustrates (Full list of Variables used in developing the DoD was regression Next Slide, presents the variables that are based on ½ Mile buffers)

")
14 Ds Module Calibration Process STEP 1 STEP 2 STEP 3 STEP 4 Land Use Data Run Models Regress Differences Adjust Regional Models Ds Analysis Module [½ mile buffer] MPO Model [TAZ level] Base Sustainable Base Sustainable HB VMT Base HB VMT Sustainable HB VMT Base HB VMT Sustainable = (Sustainable- Base) Run OLS = (Sustainable- Base) Adjustment Factors Macro Adjustments: Adjust Regional VMT or Micro Adjustments: Adjust Trip Tables (pre-assignment) Adjustment Factors
 Intersection Count Road Length Distance to RR Station Entropy Indices (Emp.")
15 Buffering: ½ Mile Radius from TAZ Centroid Population (total, density) Households (total, density) Employment (total, density) Jobs/HH Residential Acres Employment Acres Local Retail Acres Developed Acres Urban (2010 Census) Intersection Count Road Length Distance to RR Station Entropy Indices (Emp., Land Use) Jobs Diversity

16
17 Post Processer to Adjust 4-step Models
18 Fresno COG Ds Module Calibration Equation

19 Two-Step D s Analysis Module Implementation Household Vehicle Trip Probability Form: Binary Logistic D Variables: Density Diversity Distance to Transit Daily Household VMT Form: Linear Regression D Variables: Density Diversity Design Distance to Transit
20 Calibration Tool Building Ds Analysis Module (TxD) HB VMT Base HB VMT Scenario Y TxD = HB VMT (Scenario-Base) % (1/2 - mile buffer) LU Buffer Ds Base LU Buffer Ds Scenario X di TxD = LU Buffer VMT D of % D Difference of % Difference ** (Scenario - Base) Dependent (Y) = % (Y TxD - Y TDF ) Independent (b) = (Xdi TxD ) MPO TDF Model HB VMT Base HB VMT Scenario (TAZ level) LU by TAZ Base LU by TAZ Scenario Y TDF = HB VMT (Scenario-Base) % Where di = Each D-variables ** Difference of % Difference is a quasi-experimental technique used in econometrics to measure the change induced by a particular treatment or event. In this way one can look at the events before and after and derive relationships.

21 TDF Base LU Calibration Tool Building VMT Base TDF Swap LU VMT Swap
22 TDF: Land Use Base and Swap 50 TAZ change land use: 20 Place Type Swaps 5 (10) Geography Swaps 10 Increases in Density (HH & Emp) 10 Decreases in Density (HH & Emp)

23 Buffered Ds: Base and Swap Base ½ Mile Ds Buffers Future ½ Mile Ds Buffers

 = VMT Base TDF Swap LU")

24 Calibration Tool Building TDF Base LU Ds Base LU VMT Base = SED and TAZ (Land Use) = VMT Base TDF Swap LU Ds Swap LU VMT Swap VMT Swap VMT % Difference VMT % Difference


25 Calibration Tool Building TDF Base LU VMT Base Test Land Use Variables in both Models Ds Base LU VMT Base TDF Swap LU Ds Swap LU VMT Swap Constrain the Analysis to Swap TAZs and Adjacent TAZs VMT Swap VMT % Difference VMT % Difference

 Diversity (2) Design (1) Distance to")
26 Calibration Tool Building TDF Base LU VMT Base Test Land Use Variables in both Models Ds Base LU VMT Base TDF Swap LU Ds Swap LU VMT Swap Constrain the Analysis to Swap TAZs and Adjacent TAZs VMT Swap VMT % Difference Regress Difference of Percent Differences VMT % Difference Against: Differences in Density (4) Diversity (2) Design (1) Distance to Transit (1)
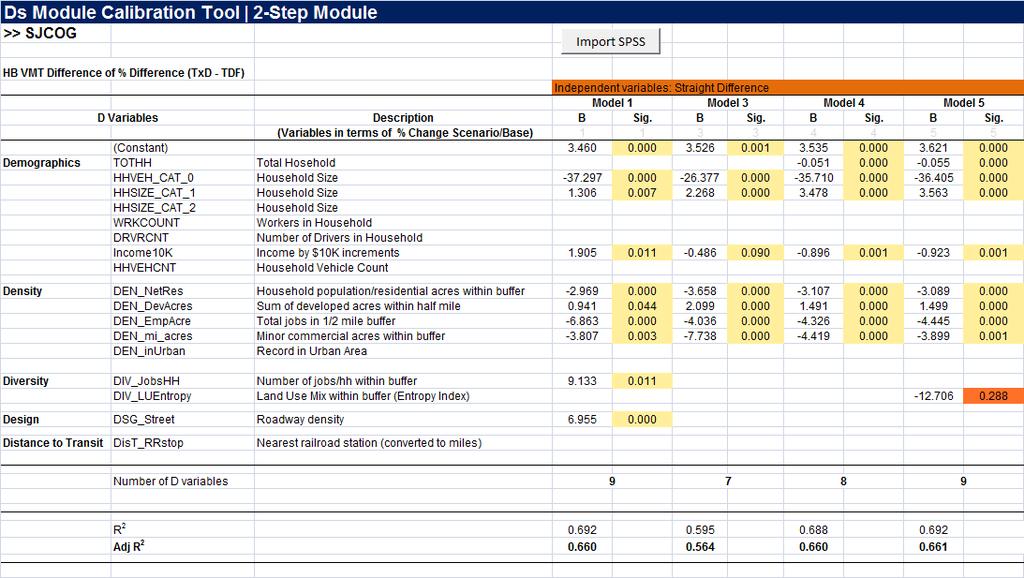
27 Calibration Equation D Variables Description Calibration Model (Variables in terms of Scenario - Base Difference) Beta t (sig) (Constant) Demographics TOTHH Total Household per TAZ HHVEH_CAT_0 % Zero Vehicle Households HHSIZE_CAT_1 % of Household Size with 1 person HHSIZE_CAT_2 % of Household Size with 2 persons WRKCOUNT Workers in Household DRVRCNT Number of Drivers in Household Income10K Income by $10K increments HHVEHCNT Household Vehicle Count Density DEN_NetRes Household population/residential acres within buffer DEN_DevAcres Sum of developed acres within half mile DEN_EmpAcre Total jobs in the 1/2 mile buffer DEN_mi_acres Minor commercial acres within buffer DEN_inUrban Record in Urban Area Diversity DIV_JobsHH Number of jobs/hh within buffer DIV_LUEntropy Land Use Mix within buffer (Entropy Index) Design DSG_Street Roadway density Distance to Transit DisT_RRstop Nearest railroad station (converted to miles) Number of D variables 9 Region-wide VMT reduction -2.69% R Adj R


 + β (Ds")
28 Tool Implementation Conceptual Show TDF Base LU Ds Base LU Base ½ Mile Ds Buffers Delta TDF Future LU Ds Future LU Future ½ Mile Ds Buffers VMT Future Apply calibration equation to obtain VMT DofD and generate factors VMT (Change) = β (Ds Delta) + β (Ds Delta) + Adjusted VMT Future
29 Application TAZ by TAZ


30 Outskirts of City of Fresno - Close up The Ds Modules factors are allowed to vary up or down depending on the Land Use effects.
31 Region-wide VMT The 2020 SED and Land Use Scenario was run to prove the concept. Land Use cover buffer assumption were in place. Original Future 2020 VMT Future 2020 VMT (With Ds Module) Percent Trip Purpose Sum Pct Trip Purpose Sum Pct Reduction HBW_VMT_P 3,430, % HBW_VMT_P 3,315, % -3.34% HBW_VMT_A 3,421, % HBW_VMT_A 3,328, % -2.72% HBW_VMT_INT 12, % HBW_VMT_INT 12, % 0.00% HBO_VMT_P 7,837, % HBO_VMT_P 7,560, % -3.54% HBO_VMT_A 7,826, % HBO_VMT_A 7,584, % -3.09% HBO_VMT_INT 16, % HBO_VMT_INT 16, % 0.00% NHB_VMT_P 2,213, % NHB_VMT_P 2,213, % 0.00% NHB_VMT_A 2,214, % NHB_VMT_A 2,214, % 0.00% NHB_VMT_INT 20, % NHB_VMT_INT 20, % 0.00% TOTAL: 26,992, % TOTAL: 26,266, % -2.69% HBW* 6,864, % HBW* 6,656, % -3.02% HBO* 15,680, % HBO* 15,161, % -3.31% NHB 4,448, % NHB 4,448, % 0.00% TOTAL: 26,992, % TOTAL: 26,266, % -2.69% *Post-Processor Tools takes HBW and HBO reduction only

32 Tulare CAG Ds Module Calibration Equation
 Geography Swaps 10 Increases in Density (HH & Emp) 10 Decreases in Density (HH &")
33 TDF/Buffer - Land Use Base and Swap 50 TAZ change land use: 20 Place Type Swaps 5 (10) Geography Swaps 10 Increases in Density (HH & Emp) 10 Decreases in Density (HH & Emp)
34 Calibration Tool Building TDF Base LU VMT Base Test Land Use Variables in both Models Ds Base LU VMT Base TDF Swap LU Ds Swap LU VMT Swap Constraint the Analysis to Swap TAZs and Adjacent TAZs VMT Swap VMT % Difference Regress Difference of Percent Differences VMT % Difference Against: Differences in Density (4) Diversity (2) Design (1) Distance to Transit (1)
35 Calibration Equation D Variables Description Calibration Model (Variables in terms of Scenario - Base Difference) Beta t (sig) (Constant) Demographics TOTHH Total Household per TAZ HHVEH_CAT_0 % Zero Vehicle Households HHSIZE_CAT_1 % of Household Size with 1 person HHSIZE_CAT_2 % of Household Size with 2 persons WRKCOUNT Workers in Household DRVRCNT Number of Drivers in Household Income10K Income by $10K increments HHVEHCNT Household Vehicle Count Density DEN_NetRes Household population/residential acres within buffer DEN_DevAcres Sum of developed acres within half mile DEN_EmpAcre Total jobs in the 1/2 mile buffer DEN_mi_acres Minor commercial acres within buffer DEN_inUrban Record in Urban Area Diversity DIV_JobsHH Number of jobs/hh within buffer DIV_LUEntropy Land Use Mix within buffer (Entropy Index) Design DSG_Street Roadway density Distance to Transit DisT_RRstop Nearest railroad station (converted to miles) Number of D variables 7 Region-wide VMT reduction -2.58% R Adj R
36 Tool Implementation Conceptual Show TDF Base LU Ds Base LU Base ½ Mile Ds Buffers Delta TDF Future LU Ds Future LU Future ½ Mile Ds Buffers VMT Future Apply calibration equation to obtain VMT DofD and generate factors VMT (Change) = β (Ds Delta) + β (Ds Delta) + Adjusted VMT Future

37 Region-wide VMT The 2020 SED and Land Use Scenario was run to prove the concept. Land Use cover buffer assumption were in place. Original Future 2020 VMT TxD Future 2020 VMT Percent Trip Purpose Sum Pct Trip Purpose Sum Pct Reduction HBW_VMT_P 2,084, % HBW_VMT_P 2,019, % -3.1% HBW_VMT_A 2,086, % HBW_VMT_A 2,035, % -2.4% HBW_VMT_INT 5, % HBW_VMT_INT 5, % 0.0% HBO_VMT_P 2,367, % HBO_VMT_P 2,300, % -2.8% HBO_VMT_A 2,368, % HBO_VMT_A 2,262, % -4.5% HBO_VMT_INT 29, % HBO_VMT_INT 29, % 0.0% NHB_VMT_P 1,087, % NHB_VMT_P 1,087, % 0.0% NHB_VMT_A 1,088, % NHB_VMT_A 1,088, % 0.0% NHB_VMT_INT 68, % NHB_VMT_INT 68, % 0.0% TOTAL 11,187, % TOTAL 10,898, % -2.6% HBW 4,176, % HBW 4,060, % -2.8% HBO 4,765, % HBO 4,592, % -3.6% NHB 2,244, % NHB 2,244, % 0.0% TOTAL: 11,187, % TOTAL: 10,898, % -2.58%


38 Three-County Model Ds Module Calibration Equation Status Update

39 TDF/Buffer - Land Use Base and Swap

40 TDF/Buffer - Land Use Base and Swap
41 Calibration Equation

42 SLOCOG Ds Module Calibration Equation Status Update

43 TDF/Buffer - Land Use Base and Swap

44 TDF/Buffer - Land Use Base and Swap
45 Results from the Other Test Regions Butte Kern and Shasta
46 Applying the Module Live Demo of TDF Calibration Tool (Excel)
47 Ds Analysis Modules for GIS and UPlan

48 Sketch7 A Python Based VMT Calculator Written in Python To be available in a Free, and Open Source format Primarily in the 2 Stage formulation 3-stage formulation is also available, but probably not as readily suitable for scenario planning use
49 2 Stage Formulation Small MPOs (same as model post-processor just demonstrated) SACOG, SANDAG
50 3 Stage Formulation Small MPOs SACOG, SANDAG
51 Helper Functions Prepare data for the VMT Engine; 2 Levels: Land Use/Land Cover summarizing/buffering Half mile buffers HH Separation by cross-classified category


52 UPlan
 CommunityViz (Placeways) Index (Criterion Planning) Open Source Toolkit Other Areas Updated")
53 Beyond UPlan Spreadsheet Model (SACOG) Other Developers with Stated Interest UrbanFootprint (Calthorpe Associates) Envision Tomorrow (Fregonese Associates) CommunityViz (Placeways) Index (Criterion Planning) Open Source Toolkit Other Areas Updated Data
54 Next Steps, Summary and Conclusion Project has: Quantified VMT sensitivity to local built environments in various CA regions. Developed a means to post-process travel model VMT to capture D effects. Study results can be implemented for MPO SCS/ RTP planning and modeling processes. Next Steps - Finalize Models and Report in July/August (2012)