Analyzing the Changes to the Hydrologic Cycle. with the Implementation of LID Techniques in Korea
|
|
|
- Elaine Gordon
- 5 years ago
- Views:
Transcription
1 Analyzing the Changes to the Hydrologic Cycle with the Implementation of LID Techniques in Korea Jung Min Lee
2 Contents 1 Introduction 2 Change of New City Paradigm on Korea 3 Case Study 4 The Effects of Water Cycle Rehabilitation 5 Conclusion
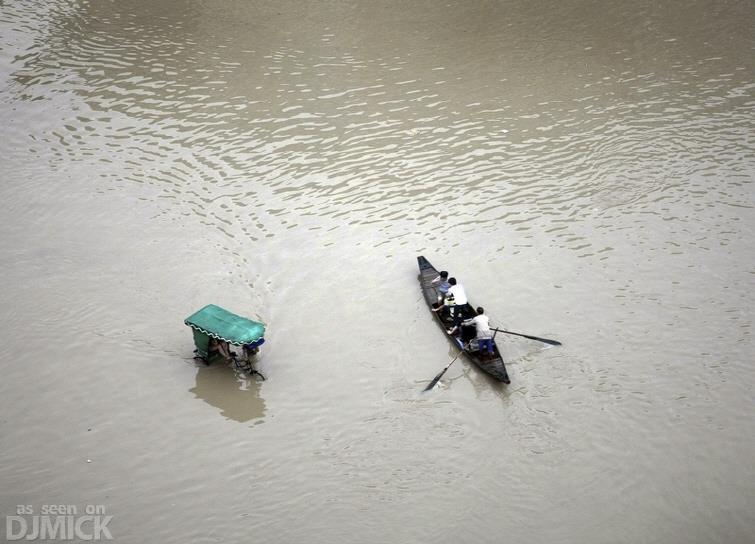
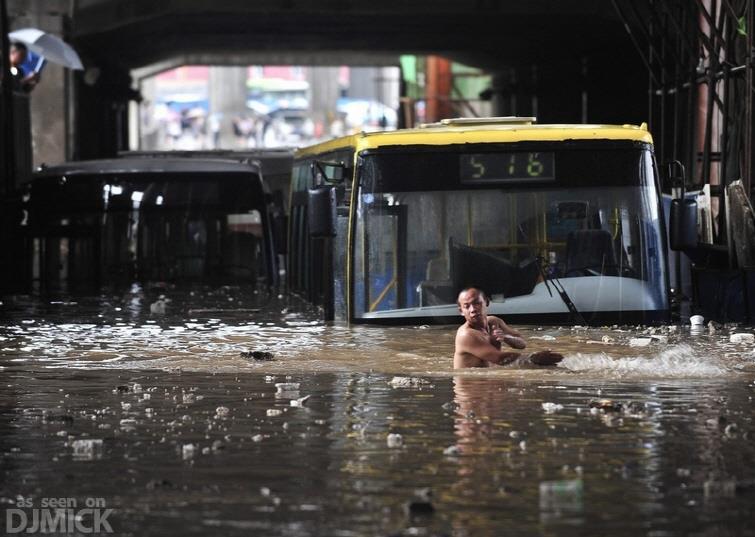
3 Introduction
4 Introduction

5 Introduction
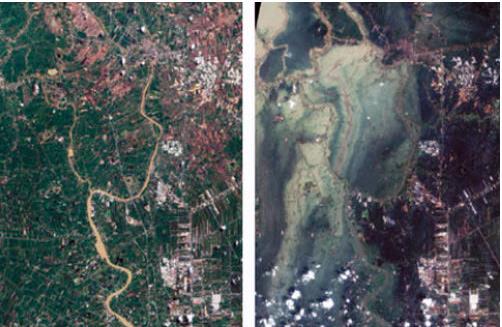


6 Introduction 출처 : NASA 위성사진, 2011
7 Introduction
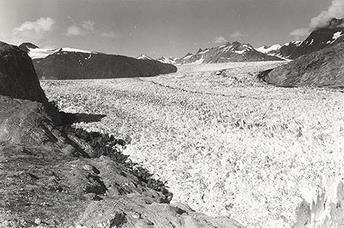
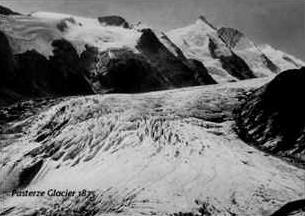
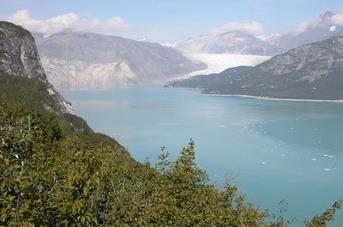
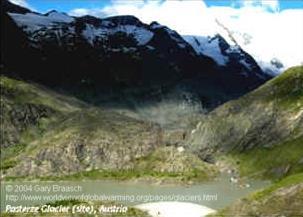
8 Introduction Alaska, Muir-Riggs Glacier Austria Pasterze Glacier
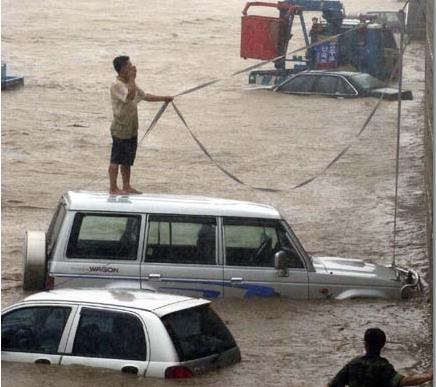
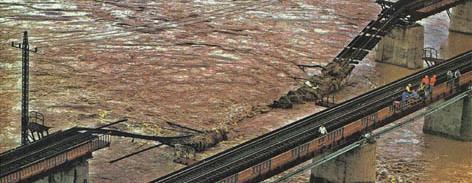
9 Introduction
] Industrialization Step [Modern")
![new City(60,70years)] shortage of housing solve step [First new city (80, 90years)]](/docs-images/92/108757631/images/10-3.jpg "Friendly Environment Well Being City Compact city Blue Network City Water cycle-city")
] Construction for supply Harmony of Human, Nature, Technology")
10 Change of New City Paradigm on Korea Existing new city - Past - Future new city Rehabilitation step after war [ Planless City (50 years)] Industrialization Step [Modern new City(60,70years)] shortage of housing solve step [First new city (80, 90years)] Friendly Environment Well Being City Compact city Blue Network City Water cycle-city Healthy city safe city Low Carbon City Housing + self-sufficiency step [Second new city(2000 years early)] Construction for supply Harmony of Human, Nature, Technology Sustainable Development for Consumer


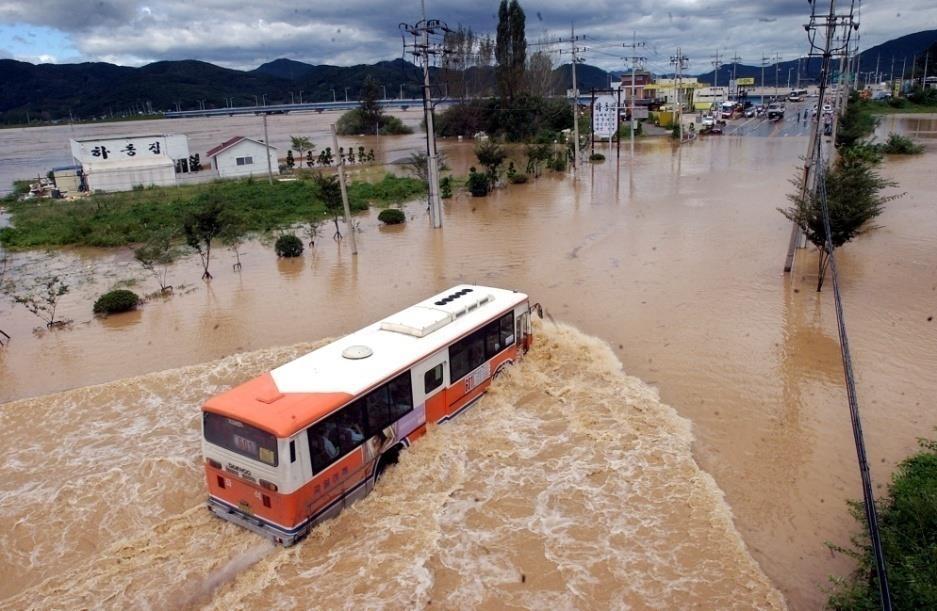
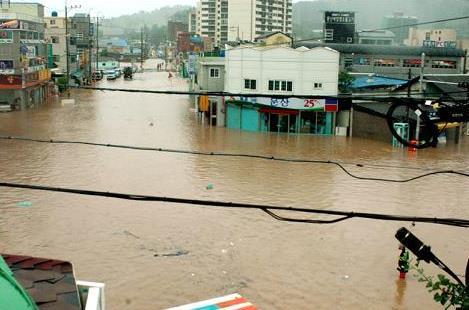
11 Change of New City Paradigm on Korea Urban development is the primary cause of the expansion of impervious area. Decreases infiltration of rainwater, increases runoff volume Increase in impervious area such as asphalt pavement, artificial ground increase of quantity of stormwater discharge and non-point pollution load, reduce of evapotranspiration, drying the rivers How can we solve these problems Mitigation and Adaptation of Climate Change

12 Change of New City Paradigm on Korea LID (Low Impact Development) : The new paradigm of rainwater management Low Impact Development (LID) methods have been used to restore the natural hydrology of predevelopment sites using site design techniques such as infiltration, evaporation, and retention. Centralized rainwater management Decentralized rainwater management

13 SWMM5-LID MODEL SWMM5 has been developed as a model to analyze the hydrologic impacts of LID facilities. [conceptualization of the surface runoff SWMM5-LID] [Conceptual diagram of a bio-retention cell of LID]


14 Case study P-New Town Location of project area Step of project area Land use planning map (After development) Location of LID Test-bed in Cheon-an city Location of LID Test-bed in Seo-san city


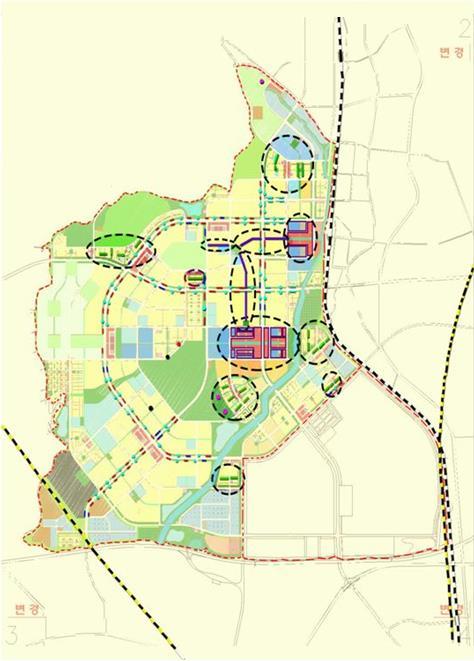
15 Case study P-New Town Applicable LID in P New-Town


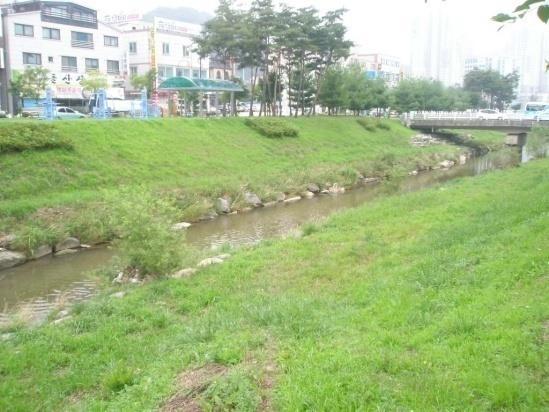
16 Case study A-New City This study performed hydrologic cycle analysis and evaluated the flood reduction effect of the Jangjae Stream watershed by the design of LID facilities of the rainwater management demonstration district of New Town (Korea).
 to analyze data")

17 Model Input Data we used Geographic Information System (GIS) to analyze data about the stream such as slope, soil characteristics and land use. [TIN] [DEM] [Soil Map]

18 Change of landuse
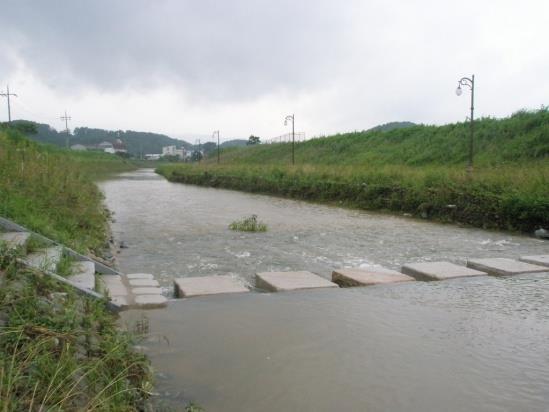
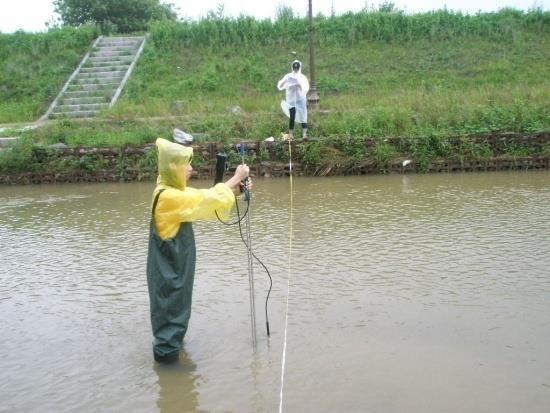
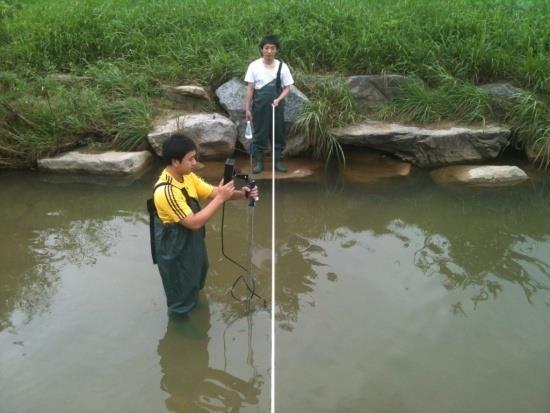
19 Flow Measurement [middle stream] [flow measure] [down stream] [flow measure]

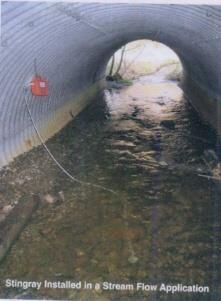
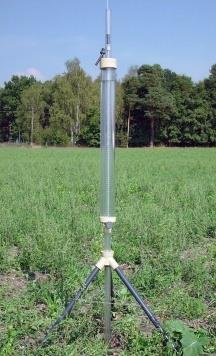
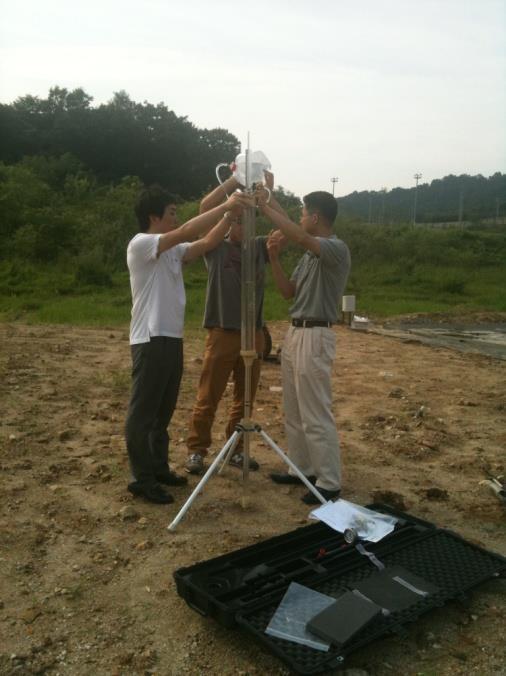
20 Measure material [flow measurement] [infiltration ratio measurement ]

21 LID Rainwater Management District LID facilities were comprised of infiltration trench, rain barrel, vegetation swale, etc. The site was divided into 15 basins, in which 60 urban constructed wetlands, 463 lateral infiltration ditches, 845 infiltration swales, and 80 vegetation swales will be installed. LID stormwater management in Asan-Tangjeong


22 The Effects of Hydrologic Cycle Rehabilitation we used weather data for around 38 years collected from the Cheonan observatory. In order to examine the hydrologic cycle rehabilitation effect by the installation of LID facilities, we performed continuous simulation of urban runoff Before development After development After setting LID
23 Flood reduction effects of runoff simulation Rainfall (mm) Discharge (m 3 /s) Before development After development After LID development after Before Flood peak reduction 23.3% decrease /17/05 12:00 9/17/05 18:00 9/18/05 0:00 9/18/05 6:00 9/18/05 12:00 Time (mm/dd/yy hh:nn) [ ]
24 The Effects of Hydrologic Cycle Rehabilitation [Table] Hydrologic cycle comparison by development and setting LID mm/yr Landuse Components Before After After Development Development Setting LID Precipitation 1, , , (%) (100.0) (100.0) (100.0) Infiltration Surface (%) (45.73) (7.93) (25.88) Water Evaporation (%) (14.23) (13.88) (14.64) Surface Runoff , (%) (40.04) (78.19) (59.48)
25 The Effects of Hydrologic Cycle Rehabilitation [Table] Hydrologic cycle comparison by development and setting LID mm/yr Landuse Components Before After After Development Development Setting LID Infiltration (%) (45.73) (7.93) (25.88) Upper Zone ET (%) (17.42) (2.13) (9.27) Subsurface Lower Zone ET Water (%) (3.95) (0.94) (1.73) Groundwater Flow (%) (24.31) (4.81) (14.83) Deep percolation (%) (0.04) (0.05) (0.05)

26 The Effects of Hydrologic Cycle Rehabilitation INDEX


 Drought episodes (water management, rainwater utilization) Storms (the height of the building,")
27 Conclusions Urban water circulation and Safety Urban Planning Urban spatial structure of carbon and energy reduction Sunshine and light shaft, passive, active plan New regeneration energy usage and provision systems Low-energy, Plus-energy architecture (Passive Haus) Transportation system for reduction of CO 2 Restoration of hydrological cycle, rainwater infiltration, evapotranspiration management of stormwater at the sources of urban development area Mitigation Planning + Strategic Adaptation Circular Metabolism restoration of circulation system (LID) Heavy rain (disaster prevention, permeation, retention area) Heat waves (green area, wind ways, waterfronts, evapotranspiration) Drought episodes (water management, rainwater utilization) Storms (the height of the building, type, arrangement)

28